
In identifying the core measure set, the Committee sought to balance the need for parsimony with the need for usability and applicability for a variety of stakeholders at different levels throughout the health system. This chapter describes the Committee’s process for and considerations in developing the core measure set; presents the core measure set; describes the rationale, supporting evidence, and current data availability for the set; and identifies provisional data indicators as the best available reflections of the current performance levels for each of the core measures, as well as related priority measures that various groups may wish to use to provide a more granular reflection of the current state for each of the core measures. The concluding section provides an overview of processes and approaches anticipated for developing, applying, and improving the core measures over time.
APPROACH TO IDENTIFYING THE CORE MEASURE SET
The Committee considered a broad range of issues and approaches for the process of identifying and evaluating candidate core measures and the qualities of the overall set. Key considerations included ensuring that the core set would address the most critical issues and elements of the American health system, as well as meet the Committee’s criteria for a core measure set presented in Chapter 3 (see Box 3-1), and choosing best current measures to be used until the processes could be set in motion to refine the measures needed for application at every level.
Addressing the Criteria for the Set
To ensure that the core measure set would be as relevant, useful, and effective as possible for a broad range of stakeholders, the Committee focused on identifying measures for the health influences, characteristics, and interventions that matter most in the domains of healthy people, quality of care, costs of care, and people’s engagement in health and health care. Furthermore, the Committee considered the potential core measurement needs, priorities, and challenges for key stakeholder groups, including patients, families, and the public; clinicians; health care organizations; payers and employers; public health agencies at multiple levels; regulatory authorities; grant-making organizations; and media. In addition to the evidence base for various candidate core measures, the Committee considered the potential utility of candidate measures as tools for motivating change, with particular attention to national health priorities, the face validity of measures, the strength of their linkage to progress, their capacity to promote broader change, their technical reliability, and their relevance at multiple levels of the health system.
These and other considerations were operationalized through the development of criteria for the core set, described in Chapter 3 (see Box 3-1). These criteria served as a tool for assessing the set of measures at various stages of development and ensuring that the final product of the Committee’s deliberations would accord with its intentions. At one point, for example, the Committee’s core set had expanded to include more than 50 measures, which upon consideration, the Committee concluded did not meet the criterion of parsimony. Similarly, the Committee considered various process measures, such as measures of screenings or interventions for specific conditions, throughout its deliberations. However, a core set consisting substantially of process measures would fail to meet the criterion of being outcomes-oriented. The Committee also chose not to focus the set on individual diseases because other candidate measures had greater potential to spur progress as well as utility at multiple levels while maintaining the principle of parsimony.
Addressing the Criteria for the Measures
As discussed in Chapter 3, building on lessons learned from previous core measure initiatives, the Committee also developed criteria to guide the selection of individual measures: the importance of the issue addressed by a measure, the strength of a measure’s linkage to progress, its face validity, its technical reliability as an indicator, its potential for broader system impact, and its utility at multiple levels (see Box 3-1). The Committee used these criteria to assess candidate measures on a three-point scale (meets criterion,
somewhat meets criterion, does not meet criterion), using the results of this process to guide changes and refinements. For example, while counseling on smoking cessation is an important clinical intervention for a particular addictive behavior, it does not meet the criterion of potential for broader system impact, as it is focused narrowly on a specific intervention within the care system. Similarly, it does not meet the criterion of strength of linkage to progress as cessation counseling alone, while supported by evidence of effectiveness, is unlikely to dramatically reduce smoking prevalence absent broader concerted efforts to address the social and cultural correlates of tobacco use and other addictions.
Choosing a Best Current Measure
The core measure set presented in Table 4-1 targets the most critical issues for making progress toward healthy people, better-quality care, lower costs, and engaged people. In many cases, these core measures will need to
TABLE 4-1 Core Measure Set
| Domain | Key Element | Core Measure Focus | Best Current Measure | Current National Performancea | |
| Healthy people | Length of life | Life expectancy | Life expectancy at birth | 79-year life expectancy at birth | |
| Quality of life | Well-being | Self-reported health | 66% report being healthy | ||
| Overweight and obesity | Body mass index (BMI) | 69% of adults with BMI 25 or greater | |||
| Healthy behaviors | Addictive behavior | Addiction death rate | 200 addiction deaths per 100,000 people age 15+ | ||
| Unintended pregnancy | Teen pregnancy rate | 27 births per 1,000 females aged 15 to 19 | |||
| Healthy social circumstances | Healthy communities | High school graduation rate | 80% graduate in 4 years | ||
| Domain | Key Element | Core Measure Focus | Best Current Measure | Current National Performancea | |
| Care quality | Prevention | Preventive services | Childhood immunization rate | 68% of children vaccinated by age 3 | |
| Access to care | Care access | Unmet care need | 5% report unmet medical needs | ||
| Safe care | Patient safety | Hospital-acquired infection (HAI) rate | 1,700 HAIs per 100,000 hospital admissions | ||
| Appropriate treatment | Evidence-based care | Preventable hospitalization rate | 10,000 avoidable per 100,000 hospital admissions | ||
| Person-centered care | Care match with patient goals | Patient–clinician communication satisfaction | 92% satisfied with provider communication | ||
| Care cost | Affordability | Personal spending burden | High spending relative to income | 46% spent >10% income on care, or uninsured in 2012 | |
| Sustainability | Population spending burden | Per capita expenditures on health care | $9,000 health care expenditure per capita | ||
| Engaged people | Individual engagement | Individual engagement | Health literacy rate | 12% proficient health literacy | |
| Community engagement | Community engagement | Social support | 21% inadequate social support | ||
a See Table 4-2 for current performance sources and definition of terms.
be translated into specific, validated measures with associated data that can be applied at different levels for different groups, from the national or state level to the level of a single community or organization. Although the Committee recognizes the limitations of the data currently available for gauging multilevel performance on the issues addressed by the core measure set, it
believes that a reliable measure—single or composite—can be developed for each core measure focus identified. Further, including the measures in the core set can create the impetus to develop the data needed to calculate them.
In the face of current limitations, and until specific measures can be further tested and made available at multiple levels or new measures and composites are developed that better capture the full intent of the measure foci, the Committee has identified best current measures that provide a near-term reflection of the target issues and their associated outcomes and can be used to help operationalize the measure set now. For example, the core measure focus for appropriate treatment is evidence-based care. Because a high-quality composite measure for this indicator is not yet available, the Committee selected the preventable hospitalization rate as a best current measure. Although this measure has a number of limitations, including that it focuses exclusively on hospital care and is not pegged to specific guidelines or associated evidence, it does provide useful information about the health care system’s ability to provide appropriate treatment and evidence-based care. To illustrate how the core measures will be operationalized, the Committee developed an example set of national performance numbers for each of the best current measures. These figures for current national performance are presented for illustrative purposes and do not represent the Committee’s endorsement of the detailed measure specifications behind each number. While they may be imperfect in fully capturing the core measure foci, they are measures for which reliable data are available at the national level. (See Table 4-2 for national performance measures source material and definitions.)
Another important consideration was the selection of appropriate benchmarks for performance, although the identification of specific benchmarks or goals for the core measures was beyond the scope of the Committee’s charge. A key question here was whether there should be fixed benchmarks for national performance or benchmarks should be identified relative to an individual’s, organization’s, or community’s past performance. Fixed benchmarks would allow for direct comparisons of relative performance among groups, while relative benchmarks would incentivize improvement for all participants and would be less dependent on individual circumstances, variations in population characteristics, or geography. Relative benchmarks also could be helpful for individuals and organizations seeking to assess the success of their improvement efforts over time.
Overall, in selecting best current measures for the core measure foci, the Committee gave priority to those for which data are commonly used, available, and understood, and it attempted to adhere as closely as possible to the intent of each core measure and to ensure that the current measures selected would be readily understandable to a broad audience.
TABLE 4-2 Current National Performance on Best Current Measures, with Provisional Local and Institutional Sources
| Best Current Measure | National Performancea | Source | Yearb | Local Source (provisional) | HCO Source (provisional)c | ||
| Life expectancy at birth | 79-year life expectancy at birth | CDC VSSd | 2014 | VSS state data | Local data | ||
| Self-reported health | 66% report being healthye | CDC NHISf | 2013 | CHR,g BRFSS | Patient query | ||
| Body mass index (BMI) | 69% of adults with BMI of 25 or greaterh | CDC NHANESi | 2013 | CHR, NCCDPHP | Clinical records | ||
| Addiction death rate | 200 addiction deaths per 100,000 people aged 15+j | SG and VSSk | 2014 | VSS state data | Clinical records | ||
| Teen pregnancy rate | 27 per 1,000 females aged 15 to 19l | CDC VSS | 2014 | CHR, NCHS | Local birth data | ||
| High school graduation rate | 80% graduate in 4 yearsm | DOEd NCESn | 2014 | CHR, NCES | Local data | ||
| Childhood immunization rate | 68% of children vaccinated by age 3o | CDC NISp | 2012 | Local PH | Clinical records | ||
| Unmet care need reported | 5% report unmet medical needsq | CDC NHIS | 2014 | State estimates | State estimates | ||
| Hospital-acquired infection (HAI) | 1,700 HAIs per 100,000 hospital admissionsr | CDC HAI and AHRQ HCUPs | 2014 | CDC state data | Clinical records | ||
| Preventable hospitalization rate | 10,000 avoidable per 100,000 hospital admissionst | AHRQ HCUP | 2013 | CHR; HCUP | Clinical records | ||
| Patient–clinician communication | 92% report satisfactionu | CAHPSv | 2013 | Plans, providers | Patient query | ||
| High spending relative to income | 46% spent >10% of income on health or were uninsured in 2012w | CFx | 2012 | CF state data | Patient query | ||
| Per capita expenditures on health care | $9,000 per capitay | CMSz | 2013 | State spending | TCOC & RUaa | ||
| Health literacy rate | 12% with proficient health literacybb | DOEd NCES | 2006 | (not available) | (not available) | ||
| Social support | 21% inadequate social supportcc | CDC BRFSS | 2014 | CHR, BRFSS | Patient query | ||
a Rounded to nearest integer or nearest 1,000.
b Year refers to year published.
c HCO = health care organization.
d CDC VSS = Centers for Disease Control and Prevention Vital Statistics System.
e Percent who report excellent or very good health.
f NHIS = National Health Interview Survey.
g CHR = County Health Rankings.
h Overweight defined as having a BMI of 25 or greater. Refers to BMI for adults 20 and older.
i NHANES = National Health and Nutrition Examination Survey.
j Computed. 2014 Surgeon General’s Report: The Health Consequences of Smoking—50 Years of Progress estimates 480,320 deaths among people 35 and older are attributable to smoking annually, 2005-2009. Add 39,030 drug-induced deaths among people 15 and older in 2009 and 24,515 alcohol-induced deaths among people 15 and older in 2009 (CDC Deaths: Final Data 2009). Summing these figures produced a total of 543,865 addiction-induced deaths in 2009 among people 15 and older. Given that there were 240,144,000 people 15 and older in 2009, this produced a rate of 226.5 addiction-induced deaths per 100,000 people 15 and older, which was rounded to 200 addiction deaths per 100,000 people 15 and older.
k SG = 2014 Surgeon General’s Report: The Health Consequences of Smoking—50 Years of Progress.
l Computed. In 2013, 274,641 babies were born to women 15-19 years old. This gives a live birth rate of 26.6 per 1,000, which was rounded to 27 per 1,000.
m Refers to public high school graduation rate.
n DOEd NCES = Department of Education National Center for Education Statistics.
o Refers to vaccination rate for children 19-35 months of age who receive combined series of recommended vaccines. Includes ≥4 doses of DTaP, ≥3 doses of poliovirus vaccine, ≥1 dose of measles vaccine, full series of Hib (3 or 4 doses, depending on product), ≥3 doses of HepB, ≥1 dose of varicella vaccine, and ≥4 doses of PCV.
p NIS = National Immunization Survey.
q Refers to the percent of people who failed to obtain needed medical care because of cost at some time during the past 12 months.
r Computed. Refers to patients in acute care hospitals with at least one health care–associated infection (http://www.nejm.org/doi/full/10.1056/NEJMoa1306801#t=articleTop). This total of 648,000 patients with HAIs was converted to a per 100,000 rate using data from the National Inpatient Survey (NIS), which estimates 39 million hospital stays in 2010. This yielded 1,662 HAIs per 100,000.
s CDC HAI = CDC Healthcare Associated Infection Prevalence Report; HCUP = Agency for Healthcare Research and Quality (AHRQ) Healthcare Cost and Utilization Project.
t Computed. HCUP reports 3.9 million preventable hospitalizations per year. This was converted to a per 100,000 rate using the HCUP 2010 National Inpatient Survey, which reports 39 million hospital stays per year. This yields a rate of 10,000 per 100,000.
u Refers to the percent of people reporting the highest level of satisfaction with their provider’s communication.
v Top box scores from Consumer Assessment of Healthcare Providers and Systems (CAHPS) Clinician and Group Survey 2013.
w Refers to percent of adults who were uninsured or underinsured in 2012. Underinsured is defined as insured all year but experiencing either out-of-pocket expenses that were 10% or more of income; out-of-pocket expenses equaling 5% or more of income if low-income (less than 200% of poverty level); or deductibles equaling 5% or more of income.
x CF = The Commonwealth Fund.
y Refers to national health expenditures per person in 2013.
z CMS = Centers for Medicare & Medicaid Services.
aa TCOC & RU: total cost of care and resource use.
bb Proficiency represents the highest level of literacy on the following scale: below basic, basic, intermediate, proficient.
cc Behavioral Risk Factor Surveillance System (BRFSS) data as reported by the County Health Rankings for 2005-2011. Refers to inadequate social and family support.
The Committee anticipates the development of better measures over time, along with progress in the capacity for their use and impact.
If, on the one hand, single measures such as life expectancy and self-reported health status are too narrow to serve as a proxy for American health, and health care, and, on the other hand, there exist too many overlapping and uncoordinated measures to enable a ready assessment of the state of America’s health and health care, how can the right number of measures be identified? Because there is no definitive answer to that question, the Committee approached the issue by using a framework with the four domains in its charge—healthy people, quality of care, costs of care, and people’s engagement in health and health care—as a starting point. Within each domain, the Committee then pursued a consensus-based, iterative process for identifying the critical facets or “key elements” of each domain. Within each key element, the Committee then identified major foci for measurement and assessment, or “core measures.” A single core measure was identified for each key element. The exception to this pattern was healthy behaviors, for which, because of their distinctiveness and importance, the Committee identified three core measures. As discussed above, to facilitate near-term applicability, the Committee also identified a best current measure for each of the 15 core measures. These indicators represent how each core measure can, or could, be operationalized to provide practical information about the state of American health and health care.
Finally, the Committee identified an additional 39 “related priority measures” that, together with the core measures, give a more detailed view of the state of the nation’s health and health care and enhance the flexibility of core measures for application in diverse health stakeholder groups. While improving health is a shared goal across the health system, stakeholder groups have different foci for action and, therefore, may have priorities for measurement in certain areas.
These related priority measures, shown in Table 4-3, are sufficiently granular and specific to be actionable by stakeholders as needed for their particular circumstances. The Committee anticipates that these related measures would provide texture for those working with a particular emphasis in health and health care. For example, related priority measures could provide more actionable information for providers working in certain specialties, or for community activists who are focused on particular community health outcomes or issues. Given the broad nature of the core measure set, the related priority measures can increase the actionability of the set by providing a tool for different stakeholder groups to focus attention on particular areas.
TABLE 4-2 Core Measure Set with Related Priority Measures
| Core Measure Focus | Best Current Measures | Related Priority Measures | |
| Life expectancy | Life expectancy at birth |
Infant mortality Maternal mortality Violence and injury mortality |
|
| Well-being | Self-reported health |
Multiple chronic conditions Depression |
|
| Overweight and obesity | Body mass index |
Activity levels Healthy eating patterns |
|
| Addictive behavior | Addiction death rate |
Tobacco use Drug dependence/illicit use Alcohol dependence/misuse |
|
| Unintended pregnancy | Teen pregnancy rate |
Contraceptive use |
|
| Healthy communities | High school graduation rate |
Childhood poverty rate Childhood asthma Air quality index Drinking water quality index |
|
| Preventive services | Childhood immunization rate |
Influenza immunizations Colorectal cancer screening Breast cancer screening |
|
| Care access | Unmet care need |
Usual source of care Delay of needed care |
|
| Patient safety | Hospital-acquired infection rate |
Wrong-site surgery Pressure ulcers Medication reconciliation |
|
| Evidence-based care | Preventable hospitalization rate |
Cardiovascular risk reduction Hypertension control Diabetes control composite Heart attack therapy protocol Stroke therapy protocol Unnecessary care composite |
|
| Care match with patient goals | Patient–clinician communication satisfaction |
Patient experience Shared decision making End-of-life/advanced care planning |
|
| Personal spending burden | High spending relative to income |
Health care–related bankruptcies |
|
| Core Measure Focus | Best Current Measures | Related Priority Measures | |
| Population spending burden | Per capita expenditures on health care |
Total cost of care Health care spending growth |
|
| Individual engagement | Health literacy rate |
Involvement in health initiatives |
|
| Community engagement | Social support |
Availability of healthy food Walkability Community health benefit agenda |
|
The Committee believes that the core measure set presented in Table 4-1 constitutes a set of the vital signs for assessing the state of the nation’s health and health care and progress in their improvement over time. The text that follows describes each core measure in turn—its importance, the best current measure for its focus, the related priority measures, and the disparities among population subgroups in that focus area.
| Life Expectancy |
Importance
Life expectancy is a validated, readily available, and easily comprehensible indicator for a critical health concept—length of life—based on the simple logic that healthier people tend to live longer. Because life expectancy depends on a full range of individual and community influences on health—from cancer to homicide—it provides an inclusive, high-level indicator for health, broadly defined. Life expectancy also is useful comparatively across institutions, communities, states, regions, and nations as a means of quickly assessing relative health. Given its broad scope, moreover, life expectancy has significant potential to drive coordinated action toward health improvement. A reversal in life expectancy for a group, or an intractable or increasing disparity, is a fundamental and strong failure alert. Improving life expectancy for any group requires the engagement of a broad range of stakeholders working individually and in coordination to address the causes of premature death in the population as whole, as well as in key demographic subpopulations. For example, safer cars and roads
could reduce traffic fatalities; more effective community policing could reduce violent crime; increased investment in biomedical research could result in new therapies and interventions; and improved health literacy could lead to more people taking an active role in maintaining and improving their behavioral health. Thus, life expectancy is a sentinel and cross-cutting core measure for which a broad range of stakeholders are accountable.
Best Current Measure
The Committee identified life expectancy at birth, as reported by the Centers for Disease Control and Prevention’s (CDC’s) Vital Statistics System, as the best current measure for life expectancy (CDC, 2015b). This measure encompasses deaths at all ages and from all causes and is a simple, reliable, accessible, and routinely utilized barometer for the overall health of a population. Data for this measure have been collected by the U.S. government for more than 100 years (Glover, 1921). The CDC reports life expectancy estimates annually, including estimates for different demographic groups. The data used to create these life expectancy estimates are collected and reported at the county level, such that data in the CDC Vital Statistics System can be used for more granular estimates of county, state, and regional life expectancy. Life expectancy also is an important indicator of the relative performance of the United States among peer countries. While the average life expectancy at birth for the OECD countries was 80.1 years in 2011, American life expectancy was 78.7 years (see Figure 4-1), 4.1 years less than citizens could expect to live in Switzerland, the leader in life expectancy (OECD, 2013).
It should be noted that life expectancy at birth has limitations as a best current measure for life expectancy, including issues of representativeness. For example, life expectancy alone provides little information on specific causes of or potential solutions for health challenges; more specific measures of mortality for specific causes or groups can be useful in developing interventions or solutions aimed at improving life expectancy. The usefulness of life expectancy may also be limited for small groups or groups including only young people in whom the number of deaths is low. Additionally, because life expectancy includes infant mortality, these deaths may have a large effect on the average.
While significant additional measure development is needed for the majority of the core measures, life expectancy at birth is an example of a best current measure that is sufficiently valid and reliable to represent the core measure concept. However, additional development in the measurement of life expectancy may produce more innovative approaches to both measuring and presenting information about length of life.
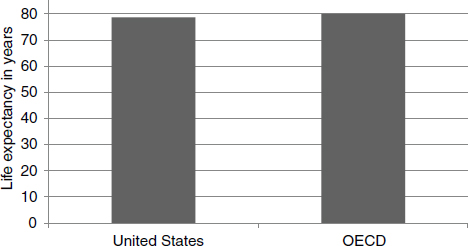
FIGURE 4-1 Life expectancy at birth: United States versus OECD countries.
SOURCE: OECD, 2013.
Related Priority Measures
Alternative measures considered by the Committee include life expectancy at various ages, infant mortality, maternal mortality, quality-adjusted life years (QALYs), health-adjusted life years (HALYs), and mortality due to violence and injury. Each of these measures provides important information about a key factor in the population’s health. These measures generally are more granular than life expectancy at birth, and they provide additional information about significant causes of shorter life expectancies in the United States. Among them, the Committee selected three related priority measures for the life expectancy core measure: infant mortality, maternal mortality, and mortality due to violence and injury. Each of the issues addressed by these measures is important to improving life expectancy in the United States, and each may be useful for stakeholder groups focused on particular aspects of length of life. For example, a community organization with a particular focus on preventing violence would use mortality due to violence and injury to provide additional insights to serve its particular mission.
Disparities
Life expectancy reveals disparities in overall health outcomes for demographic and socioeconomic groups, as well as for geographic regions. While life expectancy for the white population is 78.9 years, it is 75.1 years for the black population and 81.2 years for the Hispanic population (Murphy et al., 2013) (see Figure 4-2). In Mississippi, life expectancy among African
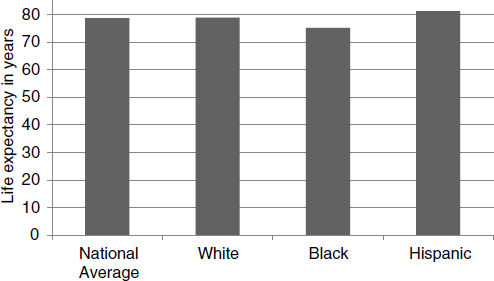
FIGURE 4-2 Disparities in U.S. life expectancy at birth.
SOURCES: Murphy et al., 2013; OECD, 2013.
Americans is 72.4 years, while white residents of that state live 76.1 years (CDC Vital Statistics Cooperative Program, 2010). Moreover, life expectancy for women generally is longer than for men—81.0 years versus 76.2 years (Murphy et al., 2013).
| Well-being |
Importance
Life expectancy and death rates from various diseases and injuries provide clear measures of health in a population group, but health and well-being in the population have many other components, including illness from chronic or acute diseases, injury, functional capacity, mental health, sense of security, and social networks. As the World Health Organization notes, “Health is a state of complete physical, mental, and social well-being and not merely the absence of disease or infirmity” (WHO, 1946). The health of an individual has both objective and subjective dimensions. In fact, people’s perception of their own health not only is an indication of well-being but is often a predictor of utilization of and satisfaction with health care.
An estimated 84 percent of health care spending in the United States is attributable to chronic diseases, which affect approximately half of the adult population (RWJF, 2010). Closely linked to many of these chronic diseases are a variety of health risk behaviors. For example, approximately half of adults do not get sufficient aerobic exercise, and approximately three-quarters of adults fall short of recommendations for regular muscle-strengthening physical activity (CDC, 2012c). And approximately 23 percent of adults report eating vegetables less than once per day (CDC, 2013c). Chronic diseases are associated with significant disabilities, which negatively impact well-being and life expectancy, among other health factors. For example, approximately half of adults with disabilities report no physical activity, and they are more likely to have one or more chronic diseases relative to adults with disabilities who do report physical activity (Carroll et al., 2014).
Well-being is a measure with the capacity to drive action among a broad range of stakeholder groups, as it encompasses a large number of potential causal factors, from poverty to depression to chronic disease. Improving well-being across the nation will require collective action, extending well beyond the care system to include such groups as employers, schools, community organizations, and others.
Best Current Measure
The Committee identified self-reported health status as the best current measure for well-being. It is a uniquely broad and accessible measure that encompasses such factors as mental health, disability, and reproductive health, among others, in a simple manner that needs no explanation. The use of self-reported health status as a measure of health emerged in the early 1980s, prompted by the publication of the Manitoba Longitudinal Study, which found that self-reported health status was a stronger predictor of health outcomes than medical records or self-reports of medical conditions (Mossey and Shapiro, 1982). Self-reported health status has been shown to be an independent predictor of life expectancy and a reliable measure for health and wellness in the United States (Idler and Benyamini, 1997). People who self-report that their health is poor have a mortality risk twice as high as that of people who report excellent health (DeSalvo et al., 2006). Self-reported health also has been shown to be a useful predictor for expenditures (DeSalvo et al., 2009).
Data on self-reported health status are collected annually through the CDC’s National Health Interview Survey (NHIS). In 2014, 66.2 percent of people reported that they were in excellent or very good health (Ward et al., 2014). The NHIS also provides estimates of self-reported health status for subpopulations, including by gender, race, and ethnicity. Data on
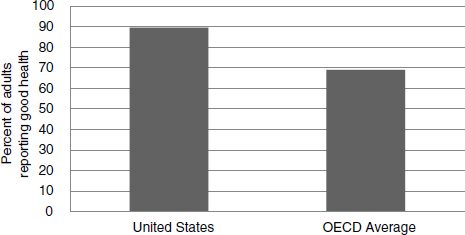
FIGURE 4-3 Adults self-reporting good health: United States versus OECD countries.
SOURCE: OECD, 2013.
self-reported health status also are available at more granular geographic levels from various other sources. Figure 4-3 shows a comparison of the percentage of adults reporting good health in the United States and the OECD countries.
A potential limitation of self-reported health status is that it may reflect cultural factors not directly dependent on health, such that some subpopulations may score systematically lower because of differing cultural concepts and definitions of what it means to be healthy (Shetterly et al., 1996). This limitation may also affect comparability on an international scale, although self-reported health is used as a health indicator by the World Health Organization and the OECD.
While self-reported health status is a powerful tool for assessing well-being in terms of both its statistical validity and its conceptual simplicity, additional measure development may lead to improvements. For example, some survey structures may be superior to others for assessing well-being, so that improvements in the structure and wording of survey questions could lead to more accurate measures. There may also be novel solutions to incorporating self-reported health into electronic health records, such that data could be gathered and aggregated from the individual level rather than through a traditional survey mechanism.
Related Priority Measures
Alternative measures considered by the Committee include functional status, healthy days, QALYs or HALYs, mental health, and reproductive health. While each of these measures provides valuable information about aspects of well-being, many of these other measures provide additional, more detailed information about different aspects of well-being. Among them, the Committee selected two related priority measures for well-being: multiple chronic conditions and depression. These two measures provide information about well-being from two critical perspectives for the nation’s health: chronic disease and mental health. An estimated 117 million Americans, or half of the U.S. population, have at least one chronic disease, and these conditions account for an estimated 86 percent of health care dollars (CDC, 2015a; Ward and Schiller, 2013). An estimated 25 percent of Americans have a mental illness, and the economic burden of mental illness was estimated at $300 billion in 2002 (Reeves et al., 2011).
Disparities
Self-reported health status shows disparities across certain demographic groups (see Figure 4-4). For example, 70.5 percent of non-Hispanic whites report excellent or very good health, compared with 58 percent for Hispanics, 60.1 percent for non-Hispanic blacks, and 66 percent for the population at large (CDC, 2013a). Data also suggest that men are more likely than women to report having excellent health, while women are more likely than men to report that their health is fair (CDC, 2013a). Moreover, the percentage of people reporting excellent or very good health tends to decrease with
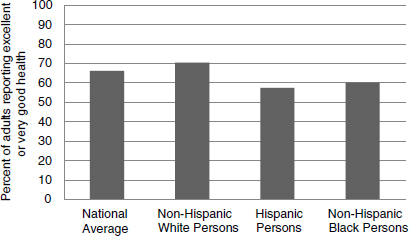
FIGURE 4-4 Disparities in U.S. self-reported health status.
SOURCE: CDC, 2013a.
age, from 84 percent for people under age 18, to 64 percent for those aged 18-64, to 45 percent for those aged 65 and older (CDC, 2013a).
| Overweight and Obesity |
Importance
An estimated 35 percent of U.S. adults and 17 percent of U.S. children and adolescents are obese (Ogden et al., 2014). Obesity accounts for an estimated $147 billion annually in medical costs, and people who are obese have annual individual medical costs estimated to be $1,429 higher than those of people who are not obese (Finkelstein et al., 2009). The increasing rates of overweight and obesity among U.S. adults and children are associated with numerous health conditions, including hypertension, coronary heart disease, type 2 diabetes, and stroke. Figure 4-5 shows a comparison of the prevalence of obesity in the United States and the OECD countries.
Overweight and obesity presents a significant challenge for American health. It is a feature of American life with causes and consequences that extend beyond the scope of the health system, including socioeconomic, cultural, and lifestyle factors, in particular diet and physical activity, which together constitute leading causes of early death. Therefore, reducing the prevalence of overweight and obesity in the United States—and, by
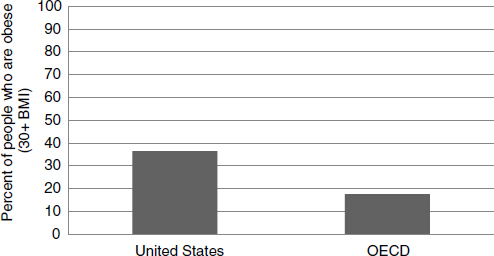
FIGURE 4-5 Obesity prevalence: United States versus OECD countries.
NOTE: BMI = body mass index.
SOURCE: OECD, 2013.
extension, improving health and reducing care costs across the nation—will depend on the coordinated efforts of many stakeholder groups.
Best Current Measure
Body mass index (BMI), a relative number derived from an individual’s weight and height, serves as a reliable indicator of overweight and obesity. The Committee therefore identified BMI as the best current measure for this core measure focus.
Data on BMI are collected annually by the CDC through the National Health and Nutrition Examination Survey (NHANES), and they are also available through a variety of other sources and at various levels. In 2012, an estimated 69 percent of U.S. adults were overweight or obese, which is defined as having a BMI of 25 or greater (CDC, 2013b). The CDC NHANES data provide estimates for different subpopulations by age, gender, and race and ethnicity. Calculating this weight/height ratio is easy and inexpensive in both the care and the home settings, allowing for quick comparisons of weight status among individuals, groups, and the public. The BMI scale marks the relationship between weight and obesity-related disease and death.
Because of the ease of measurement and high standardization, BMI is the most common method for assessing obesity and screening for associated health risks. The CDC uses BMI as its primary measure to determine overweight and obesity among the general population. BMI calculation, used primarily as a screening tool, can be followed by more detailed diagnostic tests to fully assess health risk. BMI can be calculated personally with the aid of online BMI charts, and because of its ease of applicability it can be a tool for motivating change.
While the BMI ratio does not measure body fat directly, research has shown that it is strongly correlated with more direct measures of body fat (Mei et al., 2002). Although the correlation between BMI and body fat percentage is strong, this correlation differs, however, according to gender, age, and race, largely because BMI does not distinguish between body fat and lean body mass. At a constant BMI ratio, for example, women are likely to have more body fat than men, and older adults are likely to have more body fat than younger adults. In addition, research has indicated differences in health risks across ethnicities at the same BMI. Studies have found that blacks have a leaner muscle mass and thus lower body fat than whites, suggesting that blacks are at a lower risk of obesity-related health issues than whites with the same BMI ratio (Rush et al., 2007). However, the incidence of obesity is higher in non-Hispanic blacks in the United States than in non-Hispanic whites, so overall, the former are still more susceptible to obesity-related health issues than the latter (Flegal et al., 2012).
Better measures for overweight and obesity may be developed in the future. For example, while BMI data are relatively easy to collect and calculate based on weight and height, more precise measurements based on percent body fat or other features may become feasible with improvements in data and measurement.
Related Priority Measures
Alternative measures considered by the Committee include caloric intake, fruit and vegetable consumption, sedentary lifestyles, and activity levels. Each of these measures provides important information about a key component of overweight and obesity. Among them, the Committee selected two related priority measures for overweight and obesity that provide a more granular view of two major elements of excess body fat: excessive caloric input and insufficient caloric output. Activity levels and healthy eating patterns focus on these two critical factors in overweight and obesity, and they are closely linked to the shifts in behavior that matter most for reducing overweight and obesity nationwide.
Disparities
The BMI ratio underscores disparities in health outcomes for racial and socioeconomic groups, as well as a regional divide in overweight and obesity statistics across the nation. For instance, 83 percent of males of Mexican origin are overweight or obese, while 69 percent of adults aged 20 and over are classified as overweight or obese in the general U.S. population (NCHS, 2014). From 2009 to 2012, 36 percent of the general U.S. population was obese or had a BMI greater than or equal to 30. Obesity was slightly more common among women, at 36 percent, than among men, at 35 percent. Black men and women had obesity rates of 39 and 58 percent, respectively. Among people of Mexican origin, 41 percent of males and 48 percent of females were obese (NCHS, 2014) (see Figure 4-6).
| Addictive Behavior |
Importance
Addiction and addictive behavior represent a significant and complex challenge for the health system, as well as for communities and families. Approximately 19 percent of American adults smoke, 17 percent of adults
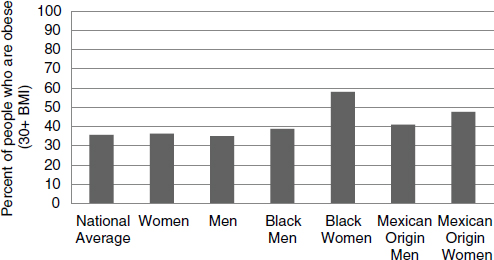
FIGURE 4-6 Disparities in obesity prevalence.
NOTE: BMI = body mass index.
SOURCE: NCHS, 2014.
binge drink, and an estimated 9 percent of people aged 12 years and older were found to have used an illicit drug within the past month (CDC, 2011, 2012b; NCHS, 2014). Increasingly, misuse of prescription drugs contributes to premature death. The estimated economic cost of substance abuse and addiction in the United States is $559 billion per year (NIDA, 2008).
Smoking persists as a significant cause of poor health despite decades of scientific evidence for its contributions to morbidity and mortality, as well as governmental and public health efforts to counter both smoking behavior and its biological effects (HHS, 2014a). Figure 4-7 shows a comparison of the percentage of adults who smoke daily in the United States and the OECD countries. Today, tobacco use is considered the leading cause of preventable morbidity and mortality in the United States (CDC, 2011). The most recent estimate available from the CDC suggests that between 2005 and 2009, 480,320 deaths were attributable to smoking each year, including deaths from cancer, cardiovascular and metabolic diseases, respiratory conditions, perinatal conditions, and secondhand smoke (HHS, 2014a). It is estimated that smokers live an average of 11 to 12 fewer years than nonsmokers (HHS, 2014a).
Addiction and misuse of alcohol and drugs also present a central challenge for the health and health care of Americans. And the broad family and social impacts of addiction to alcohol and other drugs may well exceed the consequential impacts of tobacco use.
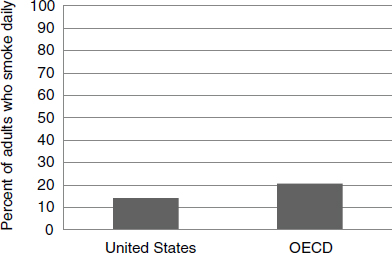
FIGURE 4-7 Smoking behavior. Percentage of adults who smoke daily: United States versus OECD average.
SOURCE: OECD, 2013.
All addictions are shaped by a range of biological, social, and cultural factors, and progress in preventing, mitigating, and managing the health impacts of addiction depends on the coordinated actions of multiple stakeholders beyond health care, including policy makers, scientific researchers, schools, law enforcement, families, and other community stakeholders. The success of counteradvertising, taxation, and labeling in reducing tobacco use stands as an important testament to this fact, as do other successes related to alcohol and drug use (Hammond et al., 2003).
Best Current Measure
The Committee identified the addiction death rate as the best current measure for addictive behavior. Data on mortality due to addictive behavior come from a variety of sources, including the CDC Vital Statistics System, which reports data on the numbers and rates of death associated with individual International Classification of Diseases (ICD)-10 codes. Summing the CDC estimates for contributions from tobacco, alcohol, and drugs, the Committee computed an approximate best estimate of 200 addiction-related deaths per 100,000 people aged 15 and older (see Table 4-2). It should be emphasized both that this is a rough approximation, derived from different sources, and that the methodology will need substantial work if it is to be available on an annual basis and computable at multiple levels.
Related Priority Measures
Alternative measures considered by the Committee include rates of smoking, excessive alcohol use, and illicit drug use. While deaths due to addictive behavior provide an aggregate view of U.S. mortality across these three addiction categories, the Committee selected three related priority measures that reflect these categories for use by stakeholder groups that may need a more detailed view of the behaviors associated with addiction-related mortality: tobacco use, drug use, and excessive drinking. For example, some communities may have smoking rates that are lower than average but a significantly higher incidence of drug use. For such communities, the use of a measure of drug use can provide more actionable information than the aggregate current best measure.
Disparities
Data on addiction-related mortality highlight significant disparities in health and mortality across groups defined by geography, race/ethnicity, gender, and socioeconomic status (see Figure 4-8). For example, it is estimated that 138 deaths per 100,000 population are attributable to smoking in Utah, while the estimated rate in Kentucky is 371 per 100,000. In terms of gender, the CDC estimates that 16 percent of women are current smokers, compared with 21 percent of men. Among racial/ethnic groups, smoking rates are lowest among Asian adults (10 percent), and are higher for American Indian or Alaska Native adults (19 percent), white adults (19 percent), and black adults (17 percent). Additionally, the percentage of current smokers under age 65 is twice as high within both the uninsured
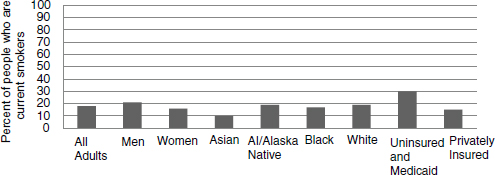
FIGURE 4-8 Current smokers by demographic group.
NOTE: AI = American Indian.
SOURCE: Blackwell et al., 2014.
and Medicaid populations (30 percent) relative to the privately insured population (15 percent) (Blackwell et al., 2014).
| Unintended Pregnancy |
Importance
Unintended pregnancy presents a significant challenge for both individual and community health. According to a report from the CDC’s Division of Vital Statistics, it is the most direct available measure of women’s ability to choose the number and timing of their pregnancies. As such, it is a measure that aggregates a variety of social, behavioral, cultural, and health factors, particularly the availability and use of both knowledge and tools for family planning.
In 2010, an estimated 37 percent of births in the United States were unintended at the time of conception—a figure that had not declined significantly since 1982 (Mosher et al., 2012). The literature on unintended pregnancy shows that infants and children whose births were unintended by the mother have a variety of elevated risks, including adverse social, economic, and health outcomes. Factors implicated in these increased risks include delayed prenatal care, smoking during pregnancy, not breastfeeding the baby, poorer childhood health, and poorer outcomes for both the mother and the mother–child relationship (Mosher et al., 2012). The results of longitudinal studies following the children of unintended pregnancies into adulthood also have found poor long-term social and health outcomes (David, 2006). Making national progress in reducing unintended pregnancy will depend on a network of stakeholders at different levels, as the drivers and consequences of unintended pregnancy reach across the boundaries of the care system to include cultural factors and institutions, education, care access, and healthy behaviors.
Best Current Measure
The Committee identified teen pregnancy rate as the best current measure for unintended pregnancy. The number of live births to women aged 15 to 19 is readily countable, and it presents an accessible view of the extent to which births in the United States are planned and, by extension, the variety of social, cultural, educational, and health care factors related to the behaviors associated with unintended pregnancy. The data come from the CDC’s Vital Statistics System, which reports birth data annually. In 2012, the live
birth rate for women aged 15-19 was 26.6 per 1,000, or a total of 274,641 babies born to women in this age group (see Figure 4-9) (Hamilton et al., 2013). The rate of teen pregnancy has been declining over the last decade, with 2012 representing a record low. The cause of this decline is unknown, but it may be related to lower levels of sexual activity in this age group, as well as greater use of birth control. Teen pregnancy was estimated to cost U.S. taxpayers $9.4 billion in 2010 as a result of elevated health care and foster care costs, as well as increased incarceration rates and lower income among the children of teen mothers (The National Campaign to Prevent Teen and Unplanned Pregnancy, 2013). This last deficit is related to high school dropout rates for teen mothers. The children of teen mothers also experience poorer health outcomes relative to the children of older mothers.
While teen pregnancy offers a look at unintended pregnancy in the population of women aged 15 to 19, better measures are needed to provide a full assessment of unintended pregnancy across age groups. For example, the CDC’s National Survey of Family Growth found that 23 percent of teen pregnancies were intended at conception, indicating that teen pregnancy is an imperfect proxy for unintended pregnancy (Mosher et al., 2012). Thus, as stronger measures are developed, teen pregnancy could be replaced by a more inclusive and precise measure of unintended pregnancy.
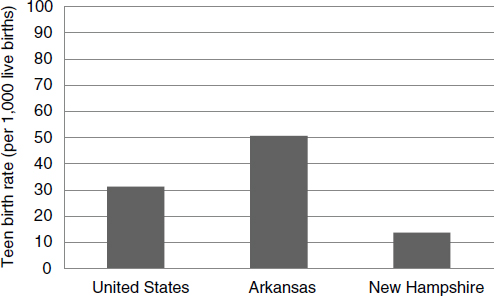
FIGURE 4-9 Teen pregnancy (aged 15-19 years): National average, worst-performing state, best-performing state.
SOURCE: Martin et al., 2013.
Related Priority Measures
Alternative measures considered by the Committee include family planning, contraceptive use, prenatal care, and low birth weight. Among these, the Committee selected contraceptive use as a related priority measure for unintended pregnancy. While teen pregnancy highlights a critical outcome related to contraceptive use, it also is more narrowly focused as it considers only women aged 15 to 19. The related priority measure of contraceptive use considers unintended pregnancy at any age, and could be useful for stakeholder groups that work with older populations or with a broader focus on women’s health and health care.
Disparities
While teen pregnancy rates have declined over the past decade across all demographic groups, disparities persist in the rates for some racial and ethnic minorities. As illustrated in Figure 4-10, in 2013 the teen pregnancy rate was 39 per 1,000 live births for non-Hispanic blacks, 42 for Hispanics, 31 for American Indians/Alaska Natives, 19 for non-Hispanic whites, and 9 for Asians/Pacific Islanders (Hamilton et al., 2014).
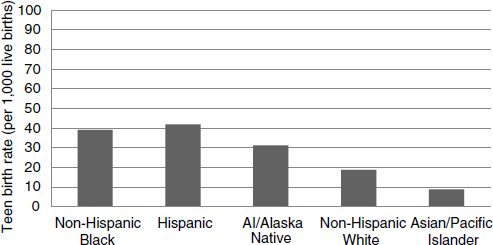
FIGURE 4-10 Teen pregnancy (aged 15-19) by race/ethnicity.
NOTE: AI = American Indian.
SOURCE: Hamilton et al., 2014.
| Healthy Communities |
Importance
Individual health is a function of a wide range of socioeconomic and community factors, ranging from environmental quality to infrastructure to social connections. Thus, our health is closely tied to our communities, and, just as individual actions to improve health can benefit the community, community actions to improve health can benefit each individual member. Community health encompasses critical elements of health that fall outside of the care system but have a major impact on care and health outcomes, such as education, employment, housing, and environment.
Best Current Measure
The Committee identified high school graduation rate as the best current measure for healthy communities. An estimated 80 percent of high school students graduate in 4 years (DOEd, 2014). Selecting a single indicator to represent the range of factors involved in community health presents a measurement challenge. The Committee discussed the possibility of a community needs composite measure or index that would combine the full range of socioeconomic, cultural, and community factors impacting health into a single, accessible measure. While a variety of promising measures of this sort exist, including the Rockefeller Institute’s Economic Hardship Index or Dignity Health’s Community Need Index, the Committee concluded that additional work would be needed to develop a reliable composite measure of community health. For the near term, the Committee suggests high school graduation rate as a best current measure for general community health. Education level is certainly one of the strongest predictors of health, associated with a range of improved health outcomes, including length and quality of life.
Among the elements typically measured to assess socioeconomic status—education, income, and occupation, or a composite thereof—education appears to be the strongest and most consistent socioeconomic status predictor of good health (Winkleby et al., 1992). While the effect of education on health is due in part to the education itself, educational attainment measures, such as high school graduation rate, also are correlated with poverty and socioeconomic status both before and after graduation. People who graduate from high school tend to have higher incomes than those who do not, and higher income can lead to improved access to care
as well as better quality of life. These effects can span generations, with children of educated parents being more likely to attain a quality education than children of parents with low educational attainment. While high school graduation rate falls short of encompassing the full range of community health factors, it is a useful, accessible proxy for assessing socioeconomic status and community quality in the short term.
Unemployment and poverty were also considered as potential candidates for the best current measure for community health, and the Committee believes that a composite measure for community health would likely include all of these elements. Although unemployment and poverty might provide more immediate measures of community health, and effects on education are likely to occur over a longer time period, the Committee considered it important to highlight education as a critical factor in community health and socioeconomic well-being and a major determinant of health. This was due in part to the conclusion that elements of socioeconomic status linked to income are demonstrated in other areas of the core measure set, particularly within “personal spending burden.” Findings in the literature suggest that the correlation between income and education is not strong enough to justify using one as a proxy for the other and that, in some cases, education may be the best single socioeconomic predictor of good health (Braveman et al., 2005; Winkleby et al., 1992). Further, high school graduation rate serves to highlight the important role of stakeholder groups not traditionally considered to be part of the health system.
Data on high school graduation rates are available from a variety of sources, including the National Center for Education Statistics, and have been collected annually by the federal government since 1870 (Snyder, 1993). Graduation rate data also are available at many levels—from individual schools to counties to states—and can be readily parsed by gender, race, and ethnicity.
Improving high school graduation rates and, by extension, the health of communities will require coordinated efforts from a broad range of stakeholder groups both within and outside of the health system. For example, one study found that a 10 percentage point increase in Medicaid eligibility among children resulted in a 5 percent decline in a state’s high school dropout rate (Cohodes et al., 2014). This finding suggests that increasing access to health care may enable more students to complete high school and, by extension, have higher incomes and make greater contributions to the economy throughout their lives.
While the Committee considers high school graduation rate to be the best current measure for community health, it could be replaced in the near term with a high-quality composite incorporating several of the most critical elements of community health. A preliminary composite measure for healthy communities might include education, air quality, walkability,
socioeconomic status, and access to healthy food. Developing composites for this and other measures where data currently are lacking is a priority for the implementation of core measures.
Related Priority Measures
Alternative measures considered by the Committee include environmental quality, poverty, quality of life, employment, and infrastructure. While many of these measures provide important information about a key aspect of community health, the Committee selected childhood poverty rate, childhood asthma, and air quality index as related priority measures. These three measures may be useful to certain stakeholder groups by illuminating additional facets of community health. For example, some communities may have particular challenges with air quality relative to other communities, such that assessing environmental health would increase the actionability of core measures for that community.
Disparities
As indicated by the high school graduation rate measure, 67 percent of American Indian/Alaska Native public high students graduate in 4 years, compared with 80 percent of public high school students across the country (DOEd, 2014). This statistical difference exemplifies the socioeconomic, racial, and regional disparities illuminated by the graduation rate measure (see Figure 4-11). During the 2011-2012 school year, 85 percent of female
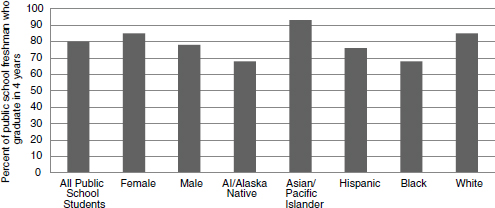
FIGURE 4-11 Disparities in percentage of public high school freshman who graduate in 4 years.
NOTE: AI = American Indian.
SOURCE: Stetser and Stillwell, 2014.
students graduated within 4 years, compared with 78 percent of male students. Graduation rates also varied by race and ethnicity, with data reported for the following groups: American Indian/Alaska Native (68 percent), Asian/Pacific Islander (93 percent), Hispanic (76 percent), black (68 percent), and white (85 percent) (Stetser and Stillwell, 2014).
| Preventive Services |
Importance
Appropriate use of clinical preventive services—immunization, counseling, and chemo prophylaxis—is important to improving health status and outcomes as well as efficiency in the delivery of care. The U.S. Preventive Services Task Force (USPSTF) recommends a range of services for different groups, from hearing loss screening for infants to tobacco cessation counseling for current smokers (USPSTF, 2010).
Spending on health care in the United States is focused disproportionately on treatment of disease. While more than 75 percent of U.S. health care expenditures is related to the treatment of preventable conditions, only an estimated 3 percent is devoted to prevention and public health improvement activities (IOM, 2012b). The 2012 Institute of Medicine (IOM) report For the Public’s Health: Investing in a Healthier Future recommends that Congress double federal appropriations for public health in the interest of delivering a minimum package of public health services in every community nationwide (IOM, 2012b).
Increasing the coverage rate for preventive services is a goal that could bring together a broad range of stakeholder groups. While clinicians and public health stakeholders play a role in the direct provision of these services, education and outreach are critical to ensuring that people are both aware of the preventive services they need and readily able to access those services. The Patient Protection and Affordable Care Act (ACA) may have a significant impact on this core measure focus as it requires coverage without copays or deductibles for all USPSTF-recommended preventive services. Community actors such as employers, public schools, and religious organizations could play a critical role in connecting people with public health resources and eliminating the barriers that keep people from receiving recommended preventive services.
Best Current Measure
The Committee identified childhood immunization rate as the best current measure for preventive services. According to the CDC’s National
Immunization Survey, 68.4 percent of children aged 19-35 months received the combined series of recommended vaccinations in 2012 (CDC, 2012a). (The combined series includes at least 4 doses of DTaP, at least 3 doses of poliovirus vaccine, at least 1 dose of measles vaccine, the full series of Hib [3 or 4 doses, depending on the product], at least 3 doses of HepB, at least 1 dose of varicella vaccine, and at least 4 doses of PCV.) The Committee discussed the need for a composite measure that would express the extent to which people receive recommended preventive services. However, there is currently no high-quality measure that meets the Committee’s criteria. For the short term, the Committee proposes immunization status as a proxy for preventive services because it represents a particularly stable and long-lasting component of prevention and covers a broad non-disease-specific population. Immunizations have been shown to be among the most powerful preventive services in terms of their impact on both disease burden and costs. Data for this measure also are reliable. The CDC has collected data on immunization status annually since 1994 through the National Immunization Survey. These data provide estimates at the national and state levels and for selected urban areas (CDC, 2014d).
Whereas childhood immunization status provides a useful current window into preventive services by focusing on a single critical set of services, better measures may be developed in the future to assess the extent to which people receive the full range of recommended preventive services. Such a measure could take the form of a binary—the percentage of people receiving or not receiving recommended services—or an index, which would be used to assess the extent to which preventive services are received throughout the population. Developing composites for this and other measures where current data are lacking is a priority for the implementation of core metrics.
Related Priority Measures
Alternative measures considered by the Committee include the incidence of vaccine-preventable disease, colorectal cancer screening, aspirin for primary prevention of cardiovascular disease, breast cancer screening, tobacco cessation counseling, BMI screening and follow-up, and control of high blood pressure. While each of these measures provides important information about a key component of prevention, immunization status was selected as a proxy because it represents a particularly stable and long-lasting component of prevention and covers a large, non-disease-specific population. In addition to childhood immunization, the Committee identified three related priority measures for preventive services: influenza immunization, colorectal cancer screening, and breast cancer screening. While screening for many additional cancers are included in the USPSTF recommendations for preventive services, the Committee chose to highlight colorectal and breast cancer because they are associated with the highest rates of mortality other than lung cancer, which is included as a component of the core measure for addictive behavior (American Cancer Society, 2014).
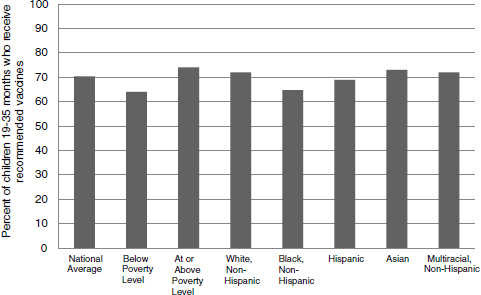
FIGURE 4-12 Disparities in percentage of children aged 19-35 months who received recommended vaccines, 2012.
SOURCE: CDC, 2012a.
Disparities
The immunization status measure highlights disparities in health outcomes across demographic groups, particularly within socioeconomic subgroups (see Figure 4-12). In 2012, recommended vaccines were received by 64 percent of children aged 19-35 months living below the federal poverty level, compared with 70 percent of children of this age in the U.S. population at large (CDC, 2014d) and 74 percent of those at or above the poverty level (CDC, 2012a). Childhood vaccine coverage, as reported by the CDC, is estimated at 72 percent for non-Hispanic white children, 65 percent of non-Hispanic black children, 69 percent of Hispanic children, 73 percent of Asian children, and 72 percent of non-Hispanic multiracial children.
| Care Access |
Importance
The ability to receive care when needed is a critical precondition for effective system performance. Unmet need for health care may occur for a variety of reasons, including lack of or insufficient health insurance, clinician shortages, lack of transportation, language barriers, insufficient health literacy, and physical limitations. Regardless of the reason, the avoidance or lack of needed care has a negative impact on health and may result in the deferral of treatment until a condition becomes more serious as well as in higher costs for both individuals and the health system.
Unmet need for medical care is a challenge that could be addressed with a variety of approaches and by a range of stakeholders. While the ACA increased access to health insurance by establishing insurance exchanges and expanding eligibility for Medicaid, millions of Americans still lack insurance coverage, a significant challenge for meeting the medical needs of the full population. Further, some areas of the country may have insufficient health care resources and staffing such that people are unable to receive timely appointments or lack the physical ability or transportation to reach a medical facility.
Best Current Measure
The Committee identified unmet care need as the best current measure for care access. Data on unmet care need are collected through a variety of measures and surveys, including the Agency for Healthcare Research and Quality’s (AHRQ’s) Medical Expenditure Panel Survey, which was initiated in 1996 (AHRQ, 2009), and the NHIS. The NHIS unmet need survey instrument assesses inability or delay in receiving needed medical care, dental care, or prescription medications, and it considers affordability and lack of sufficient insurance as potential causes. A variety of other survey mechanisms, including the Consumer Assessment of Healthcare Providers and Systems (CAHPS) Clinician and Group survey, collect data on various aspects of access to care and unmet medical need. In addition, the data on unmet care need can be stratified by different geographic, demographic, and socioeconomic subpopulations, enabling comparisons for populations of interest. According to the NHIS, for January-June 2014, an estimated 5.4 percent of the population failed to obtain needed medical care because of cost at some point during the past 12 months (CDC, 2014a).
Access to care is an area in which significant change is under way as a result of the enactment and implementation of the ACA, which expanded access to other care resources in addition to insurance and placed limits on out-of-pocket spending. As the impact of these changes unfolds, new measures may need to be developed to accord with the evolving landscape of what access means in the context of the American care system.
Related Priority Measures
Alternative measures considered by the Committee include usual source of care, delay in initiation of needed care, lack of health insurance, and underinsurance. While each of these measures provides important information about aspects of care access, unmet need encompasses the broadest range of causes and consequences of lack of access to care. In addition to unmet need, the Committee selected usual source of care and delay of needed care as related priority measures that provide detail about different foci of access to care. Usual source of care can be used to assess not only whether people receive care but also whether they receive it in a consistent and predictable way from a known source. Delay of needed care provides additional detail about the gray area between receiving and not receiving care, in which people may choose to delay or ration their care so as to reduce or avoid medical costs.
Disparities
Unmet medical need, as defined by the percentage of people who delay or avoid needed care, exhibits disparities in terms of race and ethnicity, gender, education, residency status, and poverty status, as reported by the CDC (see Figure 4-13). In 2012 nationwide, an estimated 10 percent of people delayed seeking care because of cost. Unmet need was greater for women, at 11 percent, than for men, at 9 percent. In terms of race and ethnicity, 10 percent of white individuals delayed receiving care, compared with 11 percent of African Americans, 9 percent of American Indians/Alaska Natives, 6 percent of Asians, 13 percent of people who identified as two or more races, and 11 percent of individuals of Hispanic or Latino origin. Poverty also affects unmet medical need, which was experienced by 28 percent of poor individuals compared with 9 percent of those living between 250 and 400 percent of the federal poverty level (CDC, 2014c).
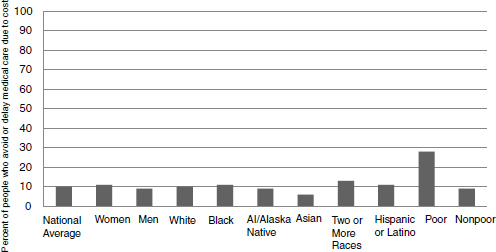
FIGURE 4-13 Percentage of people who delay medical care because of cost across demographic groups, 2012.
NOTE: AI = American Indian.
SOURCE: CDC, 2014c.
| Patient Safety |
Importance
Avoiding harm is a primary obligation of the health care system, yet despite the steadily declining hospital mortality in the United States, one of every three hospitalized patients may be harmed during their stay, and one of five Medicare patients are rehospitalized within 30 days of admission (IOM, 2012a). These harms often are associated with certain risk factors, such as the use of indwelling medical devices, surgical procedures, injections, contaminations of the care setting, and misuse of antibiotics. Infections acquired in care settings are estimated to have an economic cost in the billions and to contribute to tens of thousands of lives lost each year (HHS, 2014b). Ensuring that patients are safe in all their interactions with the health care system requires a systematic, coordinated approach to the provision of care services, as well as a culture of care that makes safety a priority. Patient safety also is a critical challenge for providers outside of the hospital setting. For example, misuse or overuse of opioids, often the result of poor prescribing practices, can pose a significant risk to patient
safety, a challenge that includes such stakeholders as community providers, pharmacists, and local and state health agencies.
Avoiding adverse events is a complex challenge without a singular or simple solution, in part because measures of these events include counts of several different types of events. The CDC data also show that significant progress has been made since 2008 in reducing hospital-acquired infections. Making progress toward reducing the incidence of adverse events requires the coordinated action of a range of stakeholders not only within the provider community but also among patients and their caregivers.
Best Current Measure
The Committee identified hospital-acquired infection rate as the best current measure for patient safety. Data on avoidable adverse events are available from many sources, with some studies suggesting that certain adverse events are underreported (Seiden and Barach, 2006) and others suggesting that claims-based measures may have significant error. The CDC’s Healthcare-Associated Infection prevalence survey provides an annual national estimate for the incidence of some of the most common health care–associated infections in hospitals, and these data are considered both reliable and valid. An estimated 648,000 patients in acute care hospitals had at least one health care–associated infection, converted for presentation purposes to a rate of approximately 1,700 per 100,000 using data on annual admissions and discharges from the Healthcare Cost and Utilization Project’s (HCUP’s) National Inpatient Survey (Magill et al., 2014; Pfuntner et al., 2012). Health care–related adverse events also are monitored via the National Healthcare Safety Network and the Emerging Infections Program (CDC, 2014b). Some states require reporting of wrong-site surgeries, although there is no uniform nationwide reporting system for these incidents. Improvement and standardization are necessary for this measure.
A preferred measure would be a composite measure for patient safety that would reflect patient safety more broadly by integrating performance with the most important patient safety events, mapped against a fuller range of patient care settings. Such a composite might include wrong-site surgeries, hospital-acquired infections, medication reconciliation, and pressure ulcers. Although the formal specification of such a composite core measure will require careful research and testing to ensure that the measure reflects as clearly as possible the state of patient safety, the development of composites for this and other measures where current data are lacking is a priority for the implementation of core metrics.
Related Priority Measures
Alternative measures considered by the Committee include blood infection from intravenous (IV) lines, treatment-associated infections, patient safety measures, and never events such as wrong-site surgeries. In addition to the best current measure of care-associated infections, the Committee identified a second priority measure: unnecessary care. This measure is a step removed from but closely related to the concept of patient safety. As such, it may be useful for certain stakeholder groups with more specific interest in this area. Unnecessary care targets the overuse of certain services or care resources, driven in part by fee-for-service models of care that emphasize volume of services and reflected, for example, in the Choosing Wisely services unsupported by evidence (ABIM, 2014).1
Disparities
Variations are seen in the incidence and severity of patient safety events for some population subgroups, although additional research is needed to articulate the relationships between demographics and patient safety events. For example, an analysis of AHRQ data on patient safety incidents among veterans found that rates of postoperative hemorrhage or hematoma were highest among African Americans, while African Americans had the lowest rate for another patient safety incident, foreign body left during a procedure (Shimada et al., 2008). Another study found that Hispanic patients had better outcomes than white patients on 7 of 14 patient safety measures, although incidence rates were higher for Hispanic relative to white patients for two additional measures (Russo et al., 2006a).
Interpreting variations in the incidence of patient safety events can present an analytic challenge because of underlying variations in risk factors such as hospitalization rates and comorbidities. Additional measure development is needed to ensure that disparities in avoidable adverse events are monitored and addressed in health and health care improvement activities.
_______________
1 Choosing Wisely is an initiative of the American Board of Internal Medicine (ABIM) aimed at identifying and eliminating unnecessary medical procedures and expenses.
| Evidence-Based Care |
Importance
The quality, effectiveness, and consistency of care depend on the application of evidence to clinical circumstances. One of the central challenges for the American health system is ensuring that care delivered is based on the best available scientific evidence for appropriateness and effectiveness. While advances in medicine and health care have led to substantial gains in life expectancy and quality of life over time, many people still fail to receive recommended care or receive care that is not based on scientific evidence. One study found that people receive only about 55 percent of recommended care (McGlynn et al., 2003). As clinical research has progressed for various conditions, new ways of assessing predispositions to disease, as well as treating conditions, have been developed, and these are targets of the rapidly proliferating measurement requirements. Ironically, the plethora of measures has taken on a reductionist character, focusing attention narrowly rather than on activities with broad-based impacts on improving systems of care across the spectrum.
This proliferation of measures also deflects attention from things that ought not to be done. Choosing Wisely highlights the extent to which today’s health care practices are out of line with the evidence. Through the work of Choosing Wisely, more than 60 medical specialty societies have identified lists of “things physicians and patients should question,” highlighting common practices or procedures that are often overutilized or poorly deployed. For example, the American College of Physicians recommends against obtaining imaging studies for nonspecific low back pain, the American Academy of Pediatrics recommends against the use of antibiotics for viral respiratory illnesses, and the American College of Obstetricians and Gynecologists recommends against annual Pap tests for women aged 30 to 65 (ABIM, 2014). These lists, which are provided in formats for both physicians and patients, are intended to encourage conversations between doctors and patients about care that may not be supported by evidence and, in the process, to promote better alignment between clinical practice and evidence and assist patients in actively engaging in decision making about their care.
Best Current Measure
The Committee identified preventable hospitalization rate as the best current measure for evidence-based care. The Committee found that an
appropriate, valid measure for the proportion of all care delivered that is based on evidence is lacking, in part because of the condition-specific nature of the data required to assess appropriateness. Several national registries include data on appropriateness, and efforts are under way to expand requirements for the collection of data on appropriateness across a broad spectrum of treatments and procedures. Nonetheless, the lack of an existing measure forced the Committee to consider proxy measures for this target. The Committee selected preventable hospitalizations as a proxy for the short term because it incorporates both the provision of appropriate health care services and the community factors that contribute to patients’ ability to manage their own care.
Data on preventable hospitalizations are available from a variety of sources, and several different definitions are in routine use, including National Quality Forum (NQF)-endorsed measures from Bridges to Excellence (NQF #0704, 0708, 0705, 0709), as well as measures of readmissions developed and used by National Committee for Quality Assurance (NCQA) and others (NQF# 1789, 1768). The Centers for Medicare & Medicaid Services (CMS) also administers the Hospital-Acquired Condition (HAC) Reduction Program, which was established by the ACA to promote improvement in patient safety in hospital settings by tying performance incentives to payment (CMS, 2014a). AHRQ collects data on preventable hospitalizations through the HCUP. These data are derived from administrative records and are available at the national and state levels, as well as for Medicare, Medicaid, and private insurance. The HCUP estimate is 3.9 million preventable hospitalizations per year. For presentation purposes, this estimate was computed to a rate based on the HCUP 2010 National Inpatient Survey, which reported 39 million hospital stays per year, yielding a rate of about 10,000 per 100,000 avoidable hospitalizations (Pfuntner et al., 2012; Torio and Andrews, 2013).
Preventable hospitalizations represent a failure of the health system to provide adequate care in advance of an acute medical event. However, a broad range of factors may contribute to preventable hospitalizations, including issues of access, the availability of ambulatory resources, communication with patients, care coordination, and social services. Thus, preventable hospitalizations is a relevant measure that captures accountability for a broad range of stakeholder groups.
At the same time, the Committee identified this as one of the most important areas for the development of a composite, standardized, systems-oriented proxy, in particular because of the rapid growth in untested measures with a narrow focus. An ideal measure would take the form of a composite that would reflect evidence-based care more broadly, integrating standardized performance on the delivery of care that follows established protocols for the most urgent and most common conditions and
failures to follow protocol without adequate justification. This measure could be tracked through a blend of sampling, electronic health records, and multi-payer databases. A composite measure for evidence-based care might include assessment of the use of basic, proven protocols whose implementation requires the culture and practice of focus on proven care, including protocols for treatment of heart attacks, stroke, diabetes, high blood pressure, surgical care, and mental health, as well as such measures as preventable hospitalizations that cut across disease and treatment categories. Significant research and pilot testing will be necessary to ensure that such a measure (or measures) performs appropriately and provides an accurate view of the state of evidence-based care delivered in a particular setting. Developing standardized composites for this and other measures where current data are lacking is among the highest priorities for the implementation of reliable core metrics.
Related Priority Measures
Alternative measures considered by the Committee include chronic disease management, readmissions, cardiovascular risk reduction, and elective delivery. While each of these measures provides important information about a key aspect of evidence-based care and appropriate treatment, preventable hospitalizations encompasses the broadest range of potential causes and conditions and also reflects such key health system performance issues as communication with patients, availability of ambulatory resources, care coordination, and social services.
The Committee identified three related priority measures for which certain data sets are available: cardiovascular risk control, hypertension control, and diabetes control, each representing a critical area of evidence-based care. These three measures deal with major chronic diseases and the extent to which they are managed by both clinicians and patients, and their selection reflects the significant and growing impact of these behavior-linked diseases on both the health of Americans and the cost of American health care.
Disparities
Data on preventable hospitalizations illustrate significant disparities in care across racial and ethnic groups. For example, one study found that, controlling for population size, approximately 500,000 more hospitalizations occur in low-income neighborhoods relative to high-income neighborhoods. Similarly, non-Hispanic blacks and Hispanics have significantly higher rates of hospitalization than non-Hispanic whites (Moy et al., 2013). One survey found that hospitalizations for chronic diseases were three to
five times higher for black respondents relative to non-Hispanic white respondents (Russo et al., 2006b). Additional measure development is needed to ensure that disparities in preventable hospitalizations are monitored and addressed in health and care improvement activities.
| Care Match with Patient Goals |
Importance
The IOM report Crossing the Quality Chasm: A New Health System for the 21st Century identifies patient-centered care among its six aims for improving the quality of health care, stating that high-quality health care must be “respectful of and responsive to individual patient preferences, needs, and values” and that patient values should be considered as a factor in all clinical decision making (IOM, 2001). The Committee sought to identify a measure that would express the degree to which health care meets this goal by being aligned with and responsive to patients’ values and needs, but that also would go further to emphasize determination, consideration, and integration of patient and family goals in the care process.
Measuring patient-centeredness accurately and consistently can enable better understanding and new approaches for ensuring that the health care system responds to the needs and values of patients. Routine and consistent integration of patient and family goals and perspectives into care planning and decisions represents a cultural shift in the prevailing patterns of health and health care, and measurement is needed to assess progress and identify best practices. This entails more than just access to health information, decision support, and transparent pricing, which are necessary but not sufficient elements of the care match with patient goals. A variety of measures targeted at patient-centered care have been developed and tested, although significant measure development in this area is still needed. Examples include the Dartmouth CollaboRATE measure, the Patient Enablement Index, and the NCQA Patient-Centered Medical Home standards.
Best Current Measure
The Committee identified patient-clinician communication as the best current measure for care match with patient goals. One of the most widely used tools for assessing patient–centeredness and patient engagement is the CAHPS surveys, the methodological development for which was supported by AHRQ. While the Committee concluded that an ideal measure
for this focus is lacking in the field today, the measure for patient experience included in the CAHPS survey could serve as a proxy in the short term. CAHPS was launched in 1995, and has collected data on patient experience via a variety of instruments. In addition to nationwide annual data collection, the CAHPS survey and methodology are widely used in assessing patient satisfaction for individual institutions, particularly in scoring patient experience using the measure discussed here.
The CAHPS composite measure of patient–clinician communication has been extensively validated, is known to be reliable on the dimensions surveyed, and is in wide use throughout the nation. It incorporates six survey questions about patients’ perspectives on how well their clinicians communicate, listen, and respond to their needs and values (AHRQ, 2012). The CAHPS results include patients with insurance coverage from Medicare, Medicaid, and commercial plans, but they do not include the uninsured population. The 2013 CAHPS Clinician and Group Survey found that 92 percent of people report the highest level of satisfaction with patient–clinician communication (AHRQ, 2014).
A limitation of the CAHPS patient–clinician communication measure is that scores are typically above 90 percent, both for the nation and for individual institutions. This leaves limited room for improvement, and may suggest that new or different measures are needed.
A more ideal measure of the extent to which care matches patients’ goals might take the form of a single carefully constructed measure or composite that would reflect with greater specificity the extent to which the care process effectively identifies patient and family goals, delivers the information necessary for decisions, and works actively and successfully toward attaining those goals. A composite might include such issues as patient–clinician communication, shared decision making, advance care planning, and patient satisfaction. Developing composites for this and other measures where current data are lacking is a priority for the implementation of core measures.
Related Priority Measures
Alternative measures considered by the Committee include use of shared decision making, patient ratings of providers, end-of-life care, and likelihood of recommending. While each of these measures provides important information about the extent to which health and health care align with patient goals, people’s reports of satisfaction with their clinician’s communication encompass a broad range of potential issues and concerns. In addition to the best current measure of patient–clinician communication, the Committee identified two related priority measures: use of shared decision making and end-of-life care. Although additional research and measure
development are needed in this area, patient and clinician participation in shared decision making increases the likelihood that care will align with patient goals and thus, at present, constitutes a reasonable measure of the attainment of this objective. This measure may be useful for stakeholders taking specific actions in the area of shared decision making and meaningful care, such as those involved in the development of decision aids and other resources to empower patients to take an active role in their care. End-of-life care represents a critical area in need of significant development in terms of both care and its measurement, and one in which patient and family views and perspectives play a critical role.
Disparities
The CAHPS composite measure on patient–clinician communication reveals disparities in health outcomes and responses, notably across geographic regions (see Figure 4-14). For example, 90 percent of people in the Western region of the United States report a high level of satisfaction with patient–clinician communication, while that number is 92 percent for all survey respondents (AHRQ, 2014). Note that although these differences may be statistically significant, they may not be clinically significant.
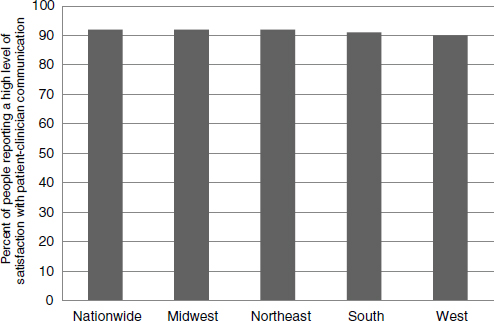
FIGURE 4-14 Quality of patient–clinician communication by region, 2013.
SOURCE: AHRQ, 2014.
| Personal Spending Burden |
Importance
As discussed in Chapter 1, the United States spends more on health care than any other country, even after adjusting for the cost of living, yet the overall health status rankings for Americans are far from the best in the world. This mismatch between cost and quality has adverse impacts not only on people’s health and well-being but also on their economic security. Care that is too expensive limits people’s access to care, delays the receipt of necessary care, and diverts resources from other needed goods and services.
Individual spending burden provides an indication of the financial burden imposed by health care on households and, by extension, the limits that health care may place on other areas of consumer spending. As noted, for example, high spending on health care may limit individuals’ or families’ ability to afford other essential goods and services, or it may limit the discretionary income that would otherwise go toward other sectors of the economy. One study found that among families reporting difficulty paying medical bills, more than half sacrificed such other necessities, as rent or food, to pay for care. Additionally, approximately half reported that they borrowed money to pay medical bills (Cunningham, 2008). Health care costs also contribute significantly to personal bankruptcies in the United States, although the magnitude of this contribution is debated (Gross and Notowidigdo, 2011; Himmelstein et al., 2009). The average level of health care spending provides a sense of the impact of high costs on the economy as a whole, but the distribution of that burden among families reveals how many face hardship as a consequence of high health care costs. Protection from excess financial exposure is a key goal of the health care system.
Best Current Measure
The Committee identified high spending relative to income as the best current measure for personal spending burden. Income devoted to health care—represented in Figure 4-15 as the percentage of people who are uninsured or underinsured (defined as spending more than 10 percent of income on health care, or 5 percent for low-income individuals)—covers a broad range of issues related to affordability and is easily communicated and understood because of its high level of relevance for individuals. The Commonwealth Fund reports that 46 percent of adults spent more than 10 percent of their income on health care (5 percent if poor) or were uninsured in 2012 (The Commonwealth Fund, 2013).
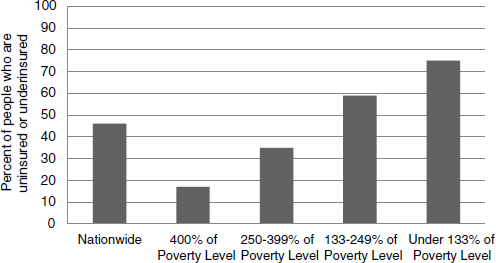
FIGURE 4-15 Percentage of people who are uninsured or underinsured (meaning they have no insurance, or they have insurance and spend more than 10 percent of their income on health care, or 5 percent if they are low-income).
SOURCE: The Commonwealth Fund, 2013.
Data on health care affordability come from a variety of sources and are specified in a range of ways, including per capita spending on health care; rates of uninsured and underinsured; and more complex estimates that break down out-of-pocket spending according to payroll deductions, copays, coinsurance, and other cost sharing. These data have been collected for many years using standardized methods and are reported regularly through government agencies as well as by a variety of health organizations, including The Commonwealth Fund. They serve as a reliable, actionable measure of the extent to which people are able to afford the care they need. The Commonwealth Fund provides biennial estimates of the proportion of Americans who are uninsured and underinsured. In the exceedingly expensive U.S. health care system, individuals lacking insurance are highly likely to incur health care expenditures that are unaffordable in relation to their income. Underinsurance goes a step further to capture the adequacy of insurance among the insured. Because of the increasing prevalence of high-deductible plans with substantial copays, even insured individuals can find care unaffordable relative to their income. The ACA regulations governing the adequacy of insurance both within and outside newly created state and federal marketplaces may affect levels of underinsurance in the United States. Therefore, this measure may need regular updating.
Related Priority Measures
Alternative measures considered by the Committee include out-of-pocket costs, total cost of care and resource use, waste, and percent uninsured. While each of these measures provides important information about a key aspect of affordability, the Committee selected health care–related bankruptcies as a related priority measure. This measure, which captures the downstream effect of spending that exceeds individuals’ ability to pay, may provide additional information for certain stakeholder groups
Disparities
Based on income devoted to health care, 75 percent of working-age adults with income below 133 percent of the federal poverty level have experienced a period of time without health insurance or were underinsured during the previous year (see Figure 4-15). In contrast, 46 percent of all adults nationwide are uninsured or underinsured, spending more than 10 percent of income on health care, or 5 percent if they are low-income (Collins et al., 2013). This measure clearly emphasizes the socioeconomic disparities, among others, that are characteristic of health care spending among U.S. consumers.
| Population Spending Burden |
Importance
In addition to its burden on individuals, health care spending consumes a large portion of the nation’s gross domestic product (GDP), substantially exceeding the relative investments of other economies in health care. Since 1985, health care spending per person has grown at a faster pace, on average, than the economy (CBO, 2013). In 2011, national health expenditures accounted for 17.9 percent of GDP; by 2022, that figure is projected to be 20 percent (CMS, 2012). While health care costs have grown more slowly than projected over the past decade, the magnitude of spending on care remains a significant challenge for the U.S. economy, and it has led to a growing trend of initiatives aimed at curbing costs through performance-based payment, accountable care, and other models that challenge the standard approach of payment based on volume of services. Population-level
spending on health care may crowd out other individual and collective investments, including investments in areas with the potential to have positive impacts on health outcomes, such as public health, social services, education, and community development. Compared with other developed countries, the United States also spends disproportionately little on social services, which may lead to a greater need for medical care and treatment as well as to poorer health overall.
Maintaining sustainability in spending on health care is a complex challenge, the management of which involves a wide range of stakeholders, from pharmaceutical and device manufacturers to hospitals to regulators. Ensuring the financial sustainability of the health care system is a compelling priority for the health system writ large, and achieving meaningful change in the costs and prices of health care will require coordinated efforts from all accountable stakeholders.
Best Current Measure
In identifying the proportion of economic resources spent on health care as the best current measure for population spending burden, the Committee is underscoring the importance of considering the issue not only at the national level (health as a percentage of GDP for the nation) but also at the state and local levels and even at the institutional level. CMS reports that in 2013, national health expenditures accounted for 17.4 percent of GDP, or more than $9,000 per person (CMS, 2014c). The Committee considered the possibility of including a third cost measure for institutional spending burden, which would focus on spending at health care institutions, but concluded that, given the shift in health care toward population-based approaches, a two-component formulation of population versus institutional spending burden would be preferable. Additionally, given the limits of data on population spending below the national level, institutional measures such as total cost of care and resource use could serve as population spending burden measures for health care stakeholders in the short term while, ideally, better measures will be developed that will enable comparison of spending burden across levels and institutions.
Data on health care spending as a share of GDP are available routinely from CMS and are collected and reported using standardized methods. Annual estimates of total health care spending nationwide, called the National Health Expenditure Accounts, date to 1960 (CMS, 2014b). The data provide quick, readily comparable estimates for national spending on health care over time. While national GDP is a common, accepted metric for economic spending and growth, measures also could
be developed to provide additional clarity on the state of population spending burden at various levels. For example, spending on health—as distinct from health care—could provide a broader look at spending outside the care system. Similarly, various breakdowns of spending by category, such as public health, prevention, chronic disease, and end-of-life care, could be useful to stakeholder groups with particular interests in certain spending areas.
Related Priority Measures
Alternative measures considered by the Committee include the rate of spending growth relative to GDP, total cost of care, and spending relative to peer countries. While these measures provide important information about the sustainability of health spending, proportion of GDP devoted to health care provides a simple, accessible estimate for the impact of health care spending on the nation’s economy. In addition to proportion of economic resources spent on health care, the Committee identified three related priority measures for population spending burden: total cost of care, spending growth, and growth in health care spending versus GDP growth. These additional measures represent different focal areas within population spending, and are intended to enhance the usability of the core measure for certain subgroups. For example, the percentage of spending devoted to health care would be of limited meaning to a health care institution. However, total cost of care provides actionable information about the state of spending at a health care institution, as well as potential areas of waste or misallocation of resources. Similarly, growth in spending on health care relative to growth in GDP provides additional context for and detail about performance over time.
Disparities
Proportion of GDP devoted to health care does not break down naturally in terms of disparities, so such data are not reported here, and the Committee does not recommend this as an area for measure development. However, share of GDP devoted to health care provides useful information about relative performance on the overall magnitude of health care spending—and the potential opportunity cost associated with any portion of that spending that is used inefficiently or wasted—relative to other countries (see Figure 4-16), as well as among states or localities that routinely calculate spending on health care.
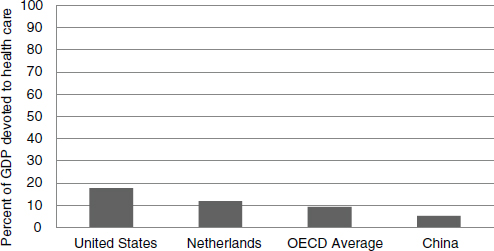
FIGURE 4-16 Health expenditures as a share of the gross domestic product (GDP): United States, the Netherlands (next highest-spending country), OECD countries, and China.
SOURCE: OECD, 2013.
| Individual Engagement |
Importance
People play active roles in their own health and the health of others, and their level of engagement can have important implications for the quality of their health and care, as well as their families, and of others in their communities. This engagement includes choices about diet, exercise, lifestyle, and other behaviors that have well-known implications for the development of chronic disease and other health consequences, as well as the extent to which people are prepared with the necessary knowledge, skills, and tools to play an active, meaningful role in the influence of community factors on their health and health care as well as that of others. Individual engagement means that individuals and families play an active role not only in their care but also in the range of factors that contribute to their health, including environment, community, economy, social well-being, and more. Individuals who are actively engaged are in a state of readiness for health, with the knowledge, skills, and tools to maximize their individual and family well-being.
Improving individual engagement is complex and involves a broad range of stakeholder groups. Addressing this problem presents an opportunity for
improving an array of health outcomes as well as for enhancing people’s engagement in and ownership of their own health and the quality of their interactions with the health system.
Best Current Measure
The Committee identified the health literacy rate as the best current measure for individual engagement. An IOM study found that 90 million people, or nearly half of all American adults, have relatively low health literacy, characterized by difficulty understanding and using health information. These people also tend to have higher rates of hospitalization (IOM, 2004). Data on health literacy are limited and not collected in a routine or standardized way. In 2003, for example, the U.S. Department of Education estimated that 12 percent of adults had proficient health literacy (proficient being the highest performance level on a scale of below basic, basic, intermediate, and proficient), although data on health literacy are not collected routinely through the National Center for Education Statistics (NCES). Additional research is needed to develop high-quality, easily collected measures and data collection systems for health literacy.
Health literacy is a complex target for measurement, and additional measure development is needed to ensure that its key aspects and competencies are captured accurately and meaningfully. Comparability for small groups may be limited because of sampling effects or the nonrepresentative composition of a target population. Survey-based measures also can be expensive to collect when publicly available data are sufficient to meet local needs.
While health literacy looks at one critical component of individual engagement, additional research and measure development are needed to identify and articulate more fully the most critical elements of individual engagement and its associated outcomes. Because individual engagement is an emerging area for health and measurement, significant resources and development are needed to further articulate the concept and to develop high-quality measures.
A composite measure of individual engagement could reflect engagement more broadly, integrating determinants of the extent to which people are active participants in their own care processes and are working to influence the nature of the care they receive and its affordability and improvement, active users of the growing number of mobile tools that facilitate self-diagnosis and condition management, as well as the responsiveness of clinicians and public health leaders to their perspectives. Example elements could include health literacy; involvement in personal, family, and community health; and working actively to improve the health of oneself and others, as well as active involvement in promoting a health-oriented
community culture. Developing composites for this and other measures where current data are lacking is a priority for the implementation of core metrics.
Related Priority Measures
Alternative measures considered by the Committee include self-care, actively trying to lose weight, use of emerging m-health tools (see Chapter 2) that help move care to where the patient is, and family health. The Committee identified involvement in personal, family, and community health as a related priority measure. This measure encompasses additional facets of engagement, such as whether people are actively working to improve their health, the extent to which they are aware of and engaged in improving the health of their families, and their roles in community health.
Disparities
The 2003 Department of Education National Assessment of Adult Literacy found that while 12 percent of U.S. adults have proficient health literacy, this is the case for just 2 percent of black adults (see Figure 4-17). Although a broad-based health literacy survey is not conducted routinely, these differing numbers highlight prominent disparities in the health literacy of the U.S. population. Health literacy is highest among Asian/Pacific Islander adults, 18 percent of whom have proficient health literacy, followed by whites (14 percent), American Indians/Alaska Natives (7 percent), Hispanics (4 percent), multiracial individuals (3 percent), and blacks (2 percent).
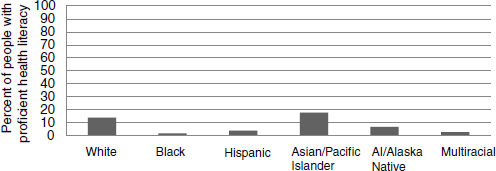
FIGURE 4-17 Disparities in health literacy: Percentage of people with proficient health literacy across demographic groups, 2003.
NOTE: AI = American Indian.
SOURCE: Kutner et al., 2006.
| Community Engagement |
Importance
In addition to engagement in health by individuals, a health-oriented community culture, as reflected in community priorities, investments, and initiatives, is important to improving individual and community health and health care. Across the United States, communities have different levels of resources available and utilized to support people’s efforts to maintain and improve their individual and family health. For example, some communities may offer better access to and availability of certain health facilities and services, such as addiction treatment programs or emergency medical facilities. Similarly, communities vary in their citizens’ involvement in various activities, such as elections or volunteering, as well as in their citizens’ culture and level of social engagement. Community engagement represents the extent to which communities have the resources, capacities, and characteristics that can support efforts to improve health and health care.
Place plays a significant role in health; therefore, engaging the elements and stakeholders of the places where people live, travel, work, and relax is critical to maintaining and improving the nation’s health. Sanitation, nutrition, workplace safety, pollution, and a range of other factors have an important role, and engaging these elements in health improvement efforts is critical. Healthy places, in turn, create healthy people who are better able to participate in civic life, in industry and innovation, and in every other circle of community activity. It has repeatedly been demonstrated that the development of infrastructure, sanitation, and policies focused on public health and the environment leads to gains in health and quality of life (McGinnis and Robinson, 2013).
Community engagement also has significant linkages with other core measure foci, including well-being, healthy communities, and individual engagement. Thus, measuring community engagement provides an opportunity to explore and assess the conditions necessary to achieve improvements in individual and population health outcomes. In some cases, for example, health interventions can take the form of home repairs, air-conditioning, or improvements in transportation. Undertaking these types of interventions presents a challenge, however, as they fall outside the scope of the care system that connects patients with typical health services. Community engagement can fill this gap by enabling coordination of health services with other sectors such as the environment, labor, and infrastructure, as well
as by connecting people with critical environmental, social, and economic resources and interventions.
Improving the nation’s health depends as much on the actions of communities of people as on the progress of the health care system and its institutions. Enabling and encouraging communities to take an active role in improving their health presents a significant opportunity for improving health and health care and brings together a broad range of stakeholder groups.
Best Current Measure
The Committee identified social support as the best current measure for community engagement. Data on social support are collected annually via the CDC’s Behavioral Risk Factor Surveillance System (BRFSS), an ongoing telephone-based health survey system in operation for more than 30 years. The BRFSS has been extensively validated and is considered reliable, and its results are reported regularly by the U.S. government using standardized methods. Social support is defined in the BRFSS as the extent to which people report having the social and emotional support they need (Robbins et al., 2014). Comparability for small groups may be limited because of sampling effects or the nonrepresentative composition of a target population. Survey-based measures also can be expensive to collect when publicly available data are sufficient to meet local needs. Based on analysis of the CDC BRFSS data, it is reported in the County Health Rankings that 19 percent of people experience inadequate social and family support (Catlin et al., 2014).
The Committee considered a range of measures relevant to community engagement, including community readiness, diet, transportation, and social support. While each of these measures provides important information about a key contributor to health, the Committee selected social support as a proxy for the short term, as it provides an indication of the degree of support people feel they have in certain aspects of their health, as well as the extent to which people are actively working toward improved health. Figure 4-18 shows the percentage of U.S. adults reporting inadequate social support nationally and in the best- and worst-performing states.
Significant research and development are needed to articulate this core measure focus more fully, both conceptually and in terms of data and measures. A preferred measure for this focus might take the form of a composite, reflecting community engagement more broadly and integrating elements related to community level of effort in improving health—the existence of community-wide agendas, the use of community benefit funds, opportunities for public input, and growth in resources developed. Various initiatives, such as the Dignity Health Community Need Index, the County
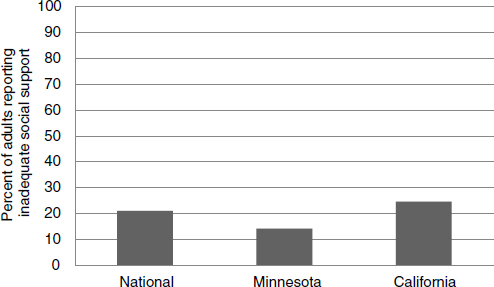
FIGURE 4-18 Percentage of adults reporting inadequate social support: National, and best- and worst-performing states, 2006-2010.
SOURCES: www.healthindicators.gov; The Commonwealth Fund, 2014.
Health Rankings, and the Community Health Assessment and Group Evaluation Tool, represent efforts to better understand and assess a range of elements important to community engagement, although further measure development is needed. A composite measure of community engagement might include the following elements: communities with active health agendas, including cooperative multi-institutional plans for meeting community benefit obligations, and communities that advocate for local health improvement. Development and pilot testing of composite measures in this and other areas is a key priority for the implementation of core measures.
Related Priority Measures
Alternative measures considered by the Committee include health-related community activities, availability of healthy food, green space, walkability, public transportation, and political involvement. In addition to social support, the Committee selected two related priority measures for community engagement: availability of healthy food and walkability. These measures were selected as critical elements that highlight some of the myriad features of communities that promote or indicate a meaningful engagement with health and can be reflective of policies, leaders, and employers that place a high value on promoting and maintaining health.
Disparities
Social support varies significantly for different population subgroups, and these variations can contribute to disparities in health outcomes. For example, one study found that 28 percent of African Americans reported that their friends helped them if needed fairly often, compared with 40 percent of white respondents (Shim et al., 2012). Additional measure development is needed to ensure that disparities in social support are monitored and addressed in health and health care improvement activities.
DEVELOPING, APPLYING, AND IMPROVING THE CORE MEASURES
Although Table 4-2, presented earlier, provides preliminary estimates for national performance on each of the core measures, refinement and elaboration is required for many. As indicated throughout this chapter and discussed more extensively in Chapter 5, fully implementing the core measures will require substantial developmental work to ensure that the measures in use are of the highest quality; are specified and operationalized consistently; reflect a broad range of stakeholder perspectives; and are applicable at the national, state, local, and institutional levels. It will also be necessary to ensure that the associated data are widely collected and readily available both to inform stakeholder actions aimed at health and health care improvement and to enable meaningful comparison of health outcomes across the nation.
That detailed work is beyond this Committee’s capacity and charge, and in fact must engage directly the multiple stakeholders involved. However, input, insights, and recommendations on the approach to this work are offered here and in Chapters 5 and 6.
The first step is to look beyond the available and at the horizon of the possible. For many of the core measure foci, significant research and development are needed to build measures and data streams that are true reflections of the most critical facets of American health. For example, the preventable hospitalizations measure takes a narrow, limited view of evidence-based care, the core measure focus it is intended to represent. It considers only one care setting, hospitals, as well as being narrowly focused on acute care, when evidence should be foundational to care across settings and conditions, including patient self-care. Additionally, the definition and measure specifications for preventable hospitalizations are applied inconsistently throughout the nation. For example, a search for “preventable
admissions” in the National Quality Measure Clearinghouse returns 42 different measures. Likewise, the measure inventory of the Department of Health and Human Services shows 16 different measures for readmissions, many focused on a particular condition or population.
While current capacity for measuring the most critical elements of health has a variety of limitations, data resources available today are significant and constantly growing and improving. From the Committee’s perspective, needed measures can be developed by moving forward with high-quality substitutes and proxies in areas where current measurement resources are limited and by targeting funding and other resources at filling high-priority gaps in data and measurement capacity. Building the measures needed to monitor the nation’s vital signs is likely to require refocusing resources on the standardization and adoption of uniform, interoperable, publicly available, publicly reported measures, as well as targeting measure development to the most critical areas in which new measures and methodologies are needed.
Applying the Available Measures
While the data and measures available today may be imperfect, many valid, standardized, reliable, and well-accepted measures are available that address key aspects of the core measure foci identified by the Committee. Applying the measures available today will be a critical step toward ensuring that the right measures are created and used in the future. Chapter 5 provides additional discussion of some of the most critical issues and implementation steps to be considered, including integration of the core measures with existing programs and requirements and considerations related to continuous updating and improvement of the core measure set. The Committee identified best current measures for each core measure to illustrate how the core measures could be applied in the short term, with the expectation that over the long term, improved measures would be developed, validated, and incorporated into the nation’s vital signs.
Establishing an Ongoing Process
The health and health care field is constantly evolving and, accordingly, the nation’s vital signs cannot be implemented statically. Rather, as new measures are established and vetted, and as priorities for American health shift, the nation’s core measures should reflect these changes. Establishing an ongoing process for this continuous evaluation and updating of the core measures is essential to ensure that focus is maintained on the health outcomes that matter most for the nation, measured as completely, precisely, and accessibly as possible. The considerations for and approach to this
process, with specific attention to programs and stakeholder groups with the significant opportunity to benefit from the core measures, are discussed in detail in Chapter 5. Additionally, the Committee’s recommendations highlight the need for the steward of the core measures to consider and plan for the continuous evaluation and evolution of the core measure set.
Figure 4-19 illustrates how core measures could lead to reduced reporting burden in a particular measurement area. Patient safety measures, for example, are numerous and often represent slight variations of measures targeting the same basic concept. The far left column, “Measure Targets,” provides a rudimentary taxonomy of the kinds of measures that are commonly reported today. In the patient safety realm, for example, there are many measures that target central line-associated bloodstream infection (CLABSI), Methicillin-resistant Staphylococcus aureus (MRSA), or pressure ulcers, among a variety of other key safety concerns and processes. While many of the individual safety measures in use today fall into similar categories, together they have created an uncoordinated assessment system in which a variety of different actors require reporting on safety in a variety of different ways, although the essential goal—monitoring patient safety—is essentially shared across stakeholder groups. The central box, “Safety Measures Currently in Use,” highlights some specific safety measures reported today to illustrate the variety of specifications and measure types used to characterize the safety concept. By reexamining the range of measures in use today through the lens of quality, sensitive outcomes, and system-impact protocols, it is possible to reduce this panoply of measures of patient safety—as with each other measurement area identified—to a patient safety composite, as illustrated in the far right column, that works cooperatively with the full measure set to provide actionable, consistent information about health performance.
Figure 4-19 also illustrates, in a schematic sense, the growing measurement burden, how it might be reduced, and the role that core metrics would play in such a process, using the example of patient safety. Note that this pruning of the number of measures is intended to address the burden in reporting requirements rather than measurement activity at large. Measurement for purposes of monitoring or innovation at the institutional level would be expected to continue at the discretion of those involved. As discussed throughout this report, the Committee emphasizes that core metrics will not replace all other measures; in fact, they will will require continued and standardized measurement of the key components of any composite. For example, all patient safety measures would not be replaced by a single measure—an improbable outcome—but rather, those measures for which reporting is required would be standardized, as illustrated in the “Standardized Measures” column, and those standardized measures would ultimately be compiled into a composite measure for patient safety.
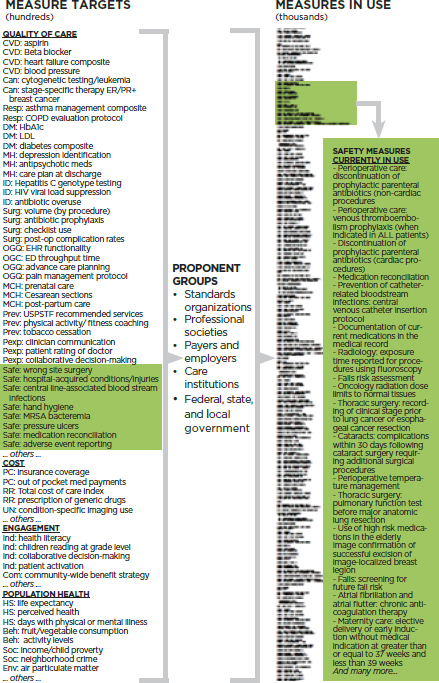
FIGURE 4-19 Schematic illustration of relationship of core measures developed from measures carefully selected out of the thousands in use to be standardized and applied at every level in generating the requisite core measure.* Highlighted are examples of the target issues and measures used in the safety arena.
_______________
* This sentence is an elaboration on that presented in the version originally released in prepublication format.
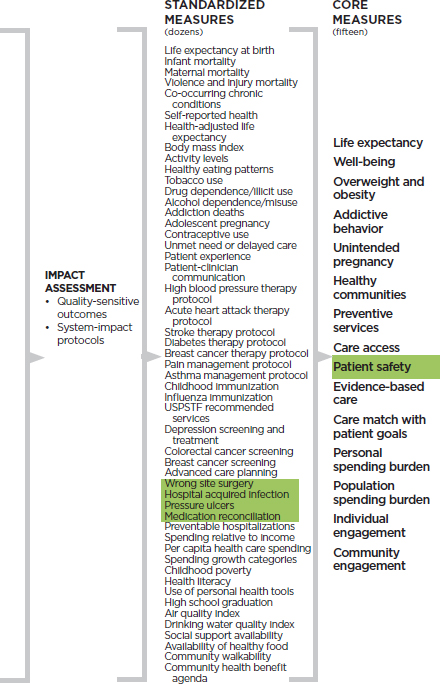
NOTES: Beh: behavior; Can: cancer; Com: community engagement levels; CVD: heart disease and stroke; DM: diabetes mellitus; Env: environmental; HS: health status; ID: infectious disease; Ind: individual; MCH: maternal and child health; MH: mental health; OGQ: other and general quality; PC: personal cost; Pexp: patient experience; Prev: preventive services; Resp: pulmonary disease, including asthma; RR: relative resource use; Safe: safety; Soc: social; Surg: surgery; UN: unnecessary services.
This composite would add value by focusing attention not on individual activities but on the system’s—and the organization’s—overall production function with respect to patient safety. As discussed throughout the report, significant multi-stakeholder development work will be needed to identify, balance, and test the critical elements of such a composite.
ABIM (American Board of Internal Medicine). 2014. Choosing wisely. www.choosingwisely.org (accessed October 9, 2014).
AHRQ (Agency for Healthcare Research and Quality). 2009. Medical Expenditure Panel Survey: Survey background. http://meps.ahrq.gov/mepsweb/about_meps/survey_back.jsp (accessed November 3, 2014).
AHRQ. 2012. CAHPS clinician & group surveys and instructions: Patient experience measures from the CAHPS clinician & group surveys. Document No. 1309. Rockville, MD: AHRQ.
AHRQ. 2014. 2013 CAHPS clinician & group survey database. Rockville, MD: AHRQ.
American Cancer Society. 2014. Cancer facts and figures 2014. Atlanta, GA: American Cancer Society.
Blackwell, D. L., J. W. Lewis, and T. C. Clarke. 2014. Summary health statistics for U.S. adults: National Health Interview Survey, 2012. Atlanta, GA: CDC.
Braveman, P. A., C. Cubbin, S. Egerter, S. Chideya, K. S. Marchi, M. Metzler, and S. Posner. 2005. Socioeconomic status in health research: One size does not fit all. Journal of the American Medical Association 294(22):2879-2888.
Carroll, D. D., E. A. Courtney-Long, A. C. Stevens, M. L. Sloan, C. Lullo, S. N. Visser, M. H. Fox, B. S. Armour, V. A. Campbell, D. R. Brown, and J. M. Dorn. 2014. Vital signs: Disability and physical activity—United States, 2009-2012. Morbidity and Mortality Weekly Report 63(18):407-413.
Catlin, B. A. J., P. Remington, and J. W. Van Dijk. 2014. County health rankings key findings 2014. Madison: University of Wisconsin Population Health Institute.
CBO (Congressional Budget Office). 2013. The 2013 long-term budget outlook. Washington, DC: CBO.
CDC (Centers for Disease Control and Prevention). 2011. Vital signs: Current cigarette smoking among adults aged ≥18 years—United States, 2005-2010. Morbidity and Mortality Weekly Report 60(35):1207-1212. http://www.cdc.gov/MMWr/preview/mmwrhtml/mm6035a5.htm (accessed August 29, 2014).
CDC. 2012a. National, state, and local area vaccination coverage among children aged 19-35 months—United States, 2012. Morbidity and Mortality Weekly Report 62(36):733-740.
CDC. 2012b. Vital signs: Binge drinking prevalence, frequency, and intensity among adults—United States, 2010. Morbidity and Mortality Weekly Report 61(1):14-19.
CDC. 2012c. Behavioral Risk Factor Surveillance System Prevalence and Trends Data for Exercise, 2012. http://www.cdc.gov/physicalactivity/data/facts.html (accessed August 8, 2014).
CDC. 2013a. Early release of selected estimates based on data from the January-June 2013 National Health Interview Survey. http://www.cdc.gov/nchs/data/nhis/earlyrelease/earlyrelease201403.pdf (accessed August 8, 2014).
CDC. 2013b. Health, United States, 2013: Table 68. Atlanta, GA: CDC.
CDC. 2013c. State indicator report on fruit and vegetables, 2013. Atlanta, GA: CDC.
CDC. 2014a. Early release of selected estimates based on data from the National Health Interview Survey, January-June 2014. http://www.cdc.gov/nchs/data/nhis/earlyrelease/earlyrelease201412.pdf (accessed December 8, 2014).
CDC. 2014b. Healthcare-associated infections: Data and statistics. http://www.cdc.gov/HAI/surveillance (accessed August 8, 2014).
CDC. 2014c. National health interview survey. Atlanta, GA: CDC.
CDC. 2014d. National immunization survey. http://www.cdc.gov/nchs/nis.htm (accessed June 11, 2014).
CDC. 2015a. Chronic disease prevention and health promotion. http://www.cdc.gov/chronicdisease (accessed January 13, 2015).
CDC. 2015b. National Center for Health Statistics. http://www.cdc.gov/nchs/nvss.htm (accessed May 3, 2014).
CDC Vital Statistics Cooperative Program. 2010. Mortality—all county micro-data file. Atlanta, GA: CDC.
CMS (Centers for Medicare & Medicaid Services). 2012. National health expenditure projections 2012-2022. Baltimore, MD: CMS.
CMS. 2014a. Hospital-acquired condition reduction program. http://www.cms.gov/Medicare/Medicare-Fee-for-Service-Payment/AcuteInpatientPPS/HAC-Reduction-Program.html (accessed February 13, 2015).
CMS. 2014b. National health expenditure data: Historical. http://www.cms.gov/ResearchStatistics-Data-and-Systems/Statistics-Trends-and-Reports/NationalHealthExpendData/NationalHealthAccountsHistorical.html (accessed July 20, 2014).
CMS. 2014c. NHE fact sheet: Historical NHE, 2013. http://www.cms.gov/Research-StatisticsData-and-Systems/Statistics-Trends-and-Reports/NationalHealthExpendData/NHE-FactSheet.html (accessed January 26, 2015).
Cohodes, S., S. Kleiner, M. F. Lovenheim, and D. Grossman. 2014. The effect of child health insurance access on schooling: Evidence from public insurance expansions. Cambridge, MA: National Bureau of Economic Research.
Collins, S., R. Robertson, T. Garber, and M. M. Doty. 2013. Insuring the future: Current trends in health coverage and the effects of implementing the Affordable Care Act. Washington, DC: The Commonwealth Fund.
The Commonwealth Fund. 2013. 2012 Commonwealth Fund Biennial Health Insurance Survey. Washington, DC: The Commonwealth Fund.
The Commonwealth Fund. 2014. Why not the best? http://www.whynotthebest.org/measures/view/12299#measure=12299&lat=31.44741029142872&long=-104.359130859375&z=6&unit=county&n=5&colors=YlGnBu&overlay=hospital&filters=all&hidemeasures=1 (accessed November 3, 2014).
Cunningham, P. 2008. Trade-offs getting tougher: Problems paying medical bills increase for U.S. families, 2003-2007. Washington, DC: Center for Studying Health System Change.
David, H. P. 2006. Born unwanted, 35 years later: The Prague Study. Reproductive Health Matters 14(27):181-190.
DeSalvo, K. B., N. Bloser, K. Reynolds, J. He, and P. Muntner. 2006. Mortality prediction with a single general self-rated health question. A meta-analysis. Journal of General Internal Medicine 21(3):267-275.
DeSalvo, K. B., T. M. Jones, J. Peabody, J. McDonald, S. Fihn, V. Fan, J. He, and P. Muntner. 2009. Health care expenditure prediction with a single item, self-rated health measure. Medical Care 47(4):440-447.
DOEd (U.S. Department of Education). 2014. Public high school four-year on-time graduation rates and event dropout rates: School years 2010-11 and 2011-12. Washington, DC: DOEd.
Finkelstein, E. A., J. G. Trogdon, J. W. Cohen, and W. Dietz. 2009. Annual medical spending attributable to obesity: Payer-and service-specific estimates. Health Affairs (Millwood) 28(5):w822-w831.
Flegal, K. M., M. D. Carroll, B. K. Kit, and C. L. Ogden. 2012. Prevalence of obesity and trends in the distribution of body mass index among US adults, 1999-2010. Journal of the American Medical Association 307(5):491-497.
Glover, J. W. 1921. United States life tables 1890, 1901, 1919, and 1901-1910. Washington, DC: Government Printing Office.
Gross, T., and M. J. Notowidigdo. 2011. Health insurance and the consumer bankruptcy decision: Evidence from expansions of Medicaid. Journal of Public Economics 95(7-8): 767-778.
Hamilton, B. E., J. A. Martin, and S. J. Ventura. 2013. Births: Preliminary data for 2012. National Vital Statistics Reports 62(3):1-20.
Hamilton, B. E., J. A. Martin, M. J. K. Osterman, and S. C. Curtin. 2014. Births: Preliminary data for 2013. National Vital Statistics Reports 63(2).
Hammond, D., G. T. Fong, P. W. McDonald, R. Cameron, and K. S. Brown. 2003. Impact of the graphic canadian warning labels on adult smoking behaviour. Tobacco Control 12(4):391-395.
HHS (U.S. Department of Health and Human Services). 2014a. The health consequences of smoking—50 years of progress. A report of the Surgeon General. Washington, DC: HHS.
HHS. 2014b. National action plan to prevent health care-associated infections: Road map to elimination. Washington, DC: HHS.
Himmelstein, D. U., D. Thorne, E. Warren, and S. Woolhandler. 2009. Medical bankruptcy in the United States, 2007: Results of a national study. American Journal of Medicine 122(8):741-746.
Idler, E. L., and Y. Benyamini. 1997. Self-rated health and mortality: A review of twenty-seven community studies. Journal of Health and Social Behavior 38(1):21-37.
IOM (Institute of Medicine). 2001. Crossing the quality chasm: A new health system for the 21st century. Washington, DC: National Academy Press.
IOM. 2004. Health literacy: A prescription to end confusion. Washington, DC: The National Academies Press.
IOM. 2012a. Best care at lower cost: The path to continuously learning health care in America. Washington, DC: The National Academies Press.
IOM. 2012b. For the public’s health: Investing in a healthier future. Washington, DC: The National Academies Press.
Kutner, M., E. Greenberg, Y. Jin, and C. Paulsen. 2006. The health literacy of America’s adults: Results from the 2003 National Assessment of Adult Literacy. Washington, DC: DOEd.
Magill, S. S., J. R. Edwards, W. Bamberg, Z. G. Beldavs, G. Dumyati, M. A. Kainer, R. Lynfield, M. Maloney, L. McAllister-Hollod, J. Nadle, S. M. Ray, D. L. Thompson, L. E. Wilson, and S. K. Fridkin. 2014. Multistate point-prevalence survey of health care-associated infections. New England Journal of Medicine 370(13):1198-1208.
Martin, J. A., B. E. Hamilton, and S. J. Ventura. 2013. Births: preliminary data for 2012. National Vital Statistics Reports 62(3):1-20.
McGinnis, J. M., and E. L. Robinson. 2013. Place matters. National Civic Review 102(4):10-13.
McGlynn, E. A., S. M. Asch, J. Adams, J. Keesey, J. Hicks, A. DeCristofaro, and E. A. Kerr. 2003. The quality of health care delivered to adults in the United States. New England Journal of Medicine 348(26):2635-2645.
Mei, Z., L. M. Grummer-Strawn, A. Pietrobelli, A. Goulding, M. I. Goran, and W. H. Dietz. 2002. Validity of body mass index compared with other body-composition screening indexes for the assessment of body fatness in children and adolescents. American Journal of Clinical Nutrition 75(6):978-985.
Mosher, W. D., J. Jones, and J. C. Abma. 2012. Intended and unintended births in the United States: 1982-2010. National Health Statistics Reports (55):1-28.
Mossey, J. M., and E. Shapiro. 1982. Self-rated health: A predictor of mortality among the elderly. American Journal of Public Health 72(8):800-808.
Moy, E., E. Chang, and M. Barrett. 2013. Potentially preventable hospitalizations—United States, 2001-2009. MMWR Surveillance Summaries 62(Suppl. 3):139-143.
Murphy, S. L., J. Xu, and K. D. Kochanek. 2013. Deaths: Final data for 2010. National Vital Statistics Reports 61(4).
The National Campaign to Prevent Teen and Unplanned Pregnancy. 2013. The public costs of teen childbearing: Key data. https://thenationalcampaign.org/sites/default/files/resourceprimary-download/counting-it-up-key-data-2013-update.pdf (accessed July 24, 2014).
NCHS (National Center for Health Statistics). 2013. National Health and Nutrition Examination Survey, 2013-2014: Overview. Atlanta, GA: CDC.
NCHS. 2014. Health, United States, 2013: With special feature on prescription drugs. Atlanta, GA: CDC.
NIDA (National Institute on Drug Abuse). 2008. Drug abuse costs the United States economy hundreds of billions of dollars in increased health care costs, crime, and lost productivity. Bethesda, MD: NIDA.
OECD (Organisation for Economic Co-operation and Development). 2013. Health at a glance 2013. Danvers, MA: OECD Publishing.
OECD. 2014. How does the United States compare? Danvers, MA: OECD Publishing.
Ogden, C. L., M. D. Carroll, B. K. Kit, and K. M. Flegal. 2014. Prevalence of childhood and adult obesity in the United States, 2011-2012. Journal of the American Medical Association 311(8):806-814.
Pfuntner, A., L. M. Weir, and A. Elixhauser. 2012. Overview of hospital stays in the United States, 2010. HCUP statistical brief #144. Rockville, MD: AHRQ.
Reeves, W. C., T. W. Strine, L. A. Pratt, W. Thompson, I. Ahluwalia, S. S. Dhingra, L. R. McKnight-Eily, L. Harrison, D. V. D’Angelo, L. Williams, B. Morrow, D. Gould, and M. A. Safran. 2011. Mental illness surveillance among adults in the United States. Morbidity and Mortality Weekly Report 60(3):1-32.
Robbins C. L., L. B. Zapata, S. L. Farr, C. D. Kroelinger, B. Morrow, I. Ahluwalia, D. V. D’Angelo, D. Barradas, S. Cox, D. Goodman, L. Williams, V. Grigorescu, and W. D. Barfield. 2014. Core state preconception health indicators—pregnancy risk assessment monitoring system and behavioral risk factor surveillance system, 2009. Morbidity and Mortality Weekly Reports Surveillance Summaries 63(ss03):1-62.
Rush, E. C., J. Goedecke, C. Jennings, L. Micklesfield, L. Dugas, E. V. Lambert, and L. D. Plank. 2007. BMI, fat and muscle differences in urban women of five ethnicities from two countries. International Journal of Obesity 31(8):1232-1239.
Russo, C. A., R. M. Andrews, and M. Barrett. 2006a. Racial and ethnic disparities in hospital patient safety events, 2005. HCUP statistical brief #53. Rockville, MD: AHRQ.
Russo, C. A., R. M. Andrews, and R. M. Coffey. 2006b. Racial and ethnic disparities in potentially preventable hospitalizations, 2003. HCUP statistical brief #10. Rockville, MD: AHRQ.
RWJF (Robert Wood Johnson Foundation). 2010. Chronic care: Making the case for ongoing care. Princeton, NJ: RWJF.
Seiden, S. C., and P. Barach. 2006. Wrong-side/wrong-site, wrong-procedure, and wrong-patient adverse events: Are they preventable? Archives of Surgery 141(9):931-939.
Shetterly, S. M., J. Baxter, L. D. Mason, and R. F. Hamman. 1996. Self-rated health among Hispanic vs. non-Hispanic white adults: The San Luis Valley Health and Aging Study. American Journal of Public Health 86(12):1798-1801.
Shim, R. S., J. Ye, P. Baltrus, Y. Fry-Johnson, E. Daniels, and G. Rust. 2012. Racial/ethnic disparities, social support, and depression: Examining a social determinant of mental health. Ethnicity & Disease 22(1):15-20.
Shimada, S. L., M. E. Montez-Rath, S. A. Loveland, S. Zhao, N. R. Kressin, and A. K. Rosen. 2008. Racial disparities in patient safety indicator (PSI) rates in the Veterans Health Administration. In Advances in patient safety: New directions and alternative approaches (Vol. 1: Assessment), edited by K. Henriksen, J. B. Battles, M. A. Keyes, and M. L. Grady. Rockville, MD: AHRQ.
Snyder, T. D. 1993. 120 years of American education: A statistical portrait. Washington, DC: DOEd, Office of Educational Research and Improvement, National Center for Education Statistics.
Stetser, M., and R. Stillwell. 2014. Public high school four-year on-time graduation rates and event dropout rates: School years 2010-11 and 2011-12. NCES 2014-391. http://nces.ed.gov/pubs2014/2014391.pdf (accessed July 24, 2014).
Torio, C. E. A., and R. M. Andrews. 2013. Trends in potentially preventable admissions among adults and children, 2005-2010. HCUP statistical brief #151. Rockville, MD: AHRQ.
USPSTF (U.S. Preventive Services Task Force). 2010. Recommendations. http://www.uspreventiveservicestaskforce.org/recommendations.htm (accessed June 11, 2014).
Ward, B. W., and J. S. Schiller. 2013. Prevalence of multiple chronic conditions among US adults: Estimates from the National Health Interview Survey, 2010. Preventing Chronic Disease 10:120203.
Ward, B. W., J. S. Schiller, G. Freeman, and T. C. Clarke. 2014. Early release of selected estimates based on data from the January-March 2014 National Health Interview Survey. http://www.cdc.gov/nchs/data/nhis/earlyrelease/earlyrelease201409.pdf (accessed April 27, 2014).
WHO (World Health Organization). 1946. Preamble to the constitution of the World Health Organization as adopted by the International Health Conference, New York, 19-22 June, 1946; signed on 22 July 1946 by the representatives of 61 states (official records of the World Health Organization, no. 2, p. 100) and entered into force on 7 April 1948. Geneva: WHO.
Winkleby, M. A., D. E. Jatulis, E. Frank, and S. P. Fortmann. 1992. Socioeconomic status and health: How education, income, and occupation contribute to risk factors for cardiovascular disease. American Journal of Public Health 82(6):816-820.


