National Academies Press: OpenBook

Issues in Risk Assessment (1993)

Chapter: 2.4 Classification of Carcinogens

« Previous: 2.3 Variation in Carcinogen Potency
Suggested Citation:"2.4 Classification of Carcinogens." National Research Council. 1993. Issues in Risk Assessment. Washington, DC: The National Academies Press. doi: 10.17226/2078.
×

nonzero dose level, which precluded the use of the Weibull model to estimate the TD50 (see annex A for a detailed discussion of this issue). The median TD50 based on the fitted lognormal distribution was approximately 29 mg/kg/day, with 10th and 90th percentiles of 0.5 and 896 mg/kg/day, respectively. Although the inter-decile range is limited to a range of potencies of about 2,000-fold, the observed potencies again vary by more than eight orders of magnitude due in large part to the very low TD50 value for TCDD.

Rulis (1986) suggested that this distribution of carcinogenic potency could be used to establish a level of exposure below which regulatory attention would not be required. Such a threshold of regulation would be established on the basis of a lower quantile of the distribution of TD50s, on the assumption that a new untested chemical would be unlikely to be more potent than most known animal carcinogens (Munro, 1990). This concept has also been considered by Zeise et al. (1984).

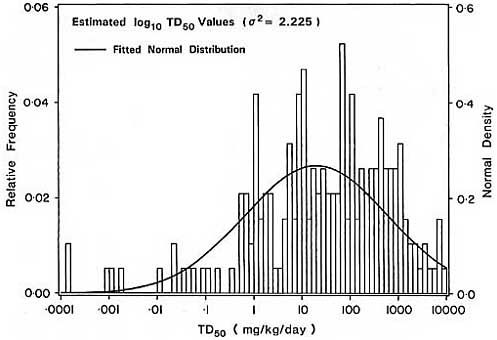
The distribution of TD50s in Figure 1a is subject to overdispersion, since each individual TD50 is subject to experimental error. The distribution of true TD50s may be determined using the shrinkage estimators described in annex B. This technique adjusts for overdispersion by ''shrinking" each estimated TD50 towards the mean TD50 on a logarithmic scale, using a shrinkage factor determined by the relative magnitude of the variation within and between experiments (see annex B for details). Due to the large variation in TD50s noted in different studies, and the comparatively small standard error for individual TD50s, application of the shrinkage estimator in this case reduces the variance of the logarithm (base 10) of the TD50 from 2 = 2.2 to 2 = 1.8 (Figure 1b).

2.4 Classification of Carcinogens

Based on an evaluation of 237 chemical carcinogens tested in the U.S. National Toxicology Program, Rosenkranz & Ennever (1990) showed that carcinogens that are active at multiple sites in more than one species tend to be more potent than carcinogens that affect a single species or a single tissue. McGregor (1992) recently examined the characteristics of chemical carcinogens in different categories used by the International Agency for Research on Cancer to classify the strength of evidence for carcinogenicity. Carcinogens in Group 1 (known human carcinogens) tended to be more potent in rodents than carcinogens in Group 2A (probable

Suggested Citation:"2.4 Classification of Carcinogens." National Research Council. 1993. Issues in Risk Assessment. Washington, DC: The National Academies Press. doi: 10.17226/2078.
×

FIGURE 1b Variation in carcinogenic potency of 191 chemical carcinogens selected from the CPDB.

Suggested Citation:"2.4 Classification of Carcinogens." National Research Council. 1993. Issues in Risk Assessment. Washington, DC: The National Academies Press. doi: 10.17226/2078.
×
Page 119
Suggested Citation:"2.4 Classification of Carcinogens." National Research Council. 1993. Issues in Risk Assessment. Washington, DC: The National Academies Press. doi: 10.17226/2078.
×
Page 120
Next: 3.1 Empirical Correlations »
Issues in Risk Assessment Get This Book
×
Buy Paperback | $65.00
MyNAP members save 10% online.
Login or Register to save!
Download Free PDF

The scientific basis, inference assumptions, regulatory uses, and research needs in risk assessment are considered in this two-part volume.

The first part, Use of Maximum Tolerated Dose in Animal Bioassays for Carcinogenicity, focuses on whether the maximum tolerated dose should continue to be used in carcinogenesis bioassays. The committee considers several options for modifying current bioassay procedures.

The second part, Two-Stage Models of Carcinogenesis, stems from efforts to identify improved means of cancer risk assessment that have resulted in the development of a mathematical dose-response model based on a paradigm for the biologic phenomena thought to be associated with carcinogenesis.

  1. ×

    Welcome to OpenBook!

    You're looking at OpenBook, NAP.edu's online reading room since 1999. Based on feedback from you, our users, we've made some improvements that make it easier than ever to read thousands of publications on our website.

    Do you want to take a quick tour of the OpenBook's features?

    No Thanks Take a Tour »
  2. ×

    Show this book's table of contents, where you can jump to any chapter by name.

    « Back Next »
  3. ×

    ...or use these buttons to go back to the previous chapter or skip to the next one.

    « Back Next »
  4. ×

    Jump up to the previous page or down to the next one. Also, you can type in a page number and press Enter to go directly to that page in the book.

    « Back Next »
  5. ×

    Switch between the Original Pages, where you can read the report as it appeared in print, and Text Pages for the web version, where you can highlight and search the text.

    « Back Next »
  6. ×

    To search the entire text of this book, type in your search term here and press Enter.

    « Back Next »
  7. ×

    Share a link to this book page on your preferred social network or via email.

    « Back Next »
  8. ×

    View our suggested citation for this chapter.

    « Back Next »
  9. ×

    Ready to take your reading offline? Click here to buy this book in print or download it as a free PDF, if available.

    « Back Next »
Stay Connected!