of the limited range of values q1* can assume once the MTD is established.
This behavior is readily illustrated using model-free upper bounds on low dose risk proposed by Krewski et al. (1991a). The current NTP carcinogenesis screening bioassay generally consists of groups of 50 animals at doses of 0, D/4, D/2 and D = MTD. Using the model-free extrapolation (MFX) procedure with this design, the lowest estimate of potency would occur at the highest possible dose not exhibiting a statistically significant increase in tumor incidence. For carcinogens, there would be a statistically significant increase in the tumor incidence at least at the MTD. Hence, the lowest estimate of potency occurs when there are no tumors at the MTD/2. In this case, the MFX would yield an upper confidence limit on the low dose slope of approximately 0.09/(MTD/2) = 0.18/MTD. The maximum estimate of the low dose slope would occur if the upper confidence limit on the incidence were 1.0 at the lowest dose, i.e., 1.0/(MTD/4) = 4/MTD. Using the MFX procedure, this design can only accommodate a 4/0.18 = 22-fold range in carcinogenic potency estimates. This would be reduced to an 11-fold range if the lowest dose (MTD/4) were omitted.
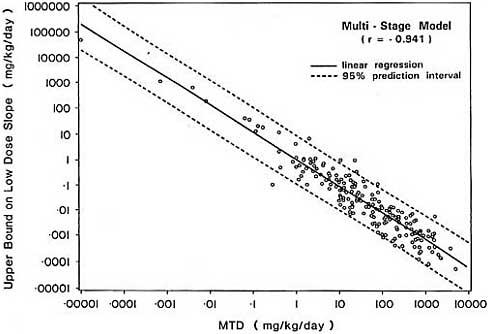
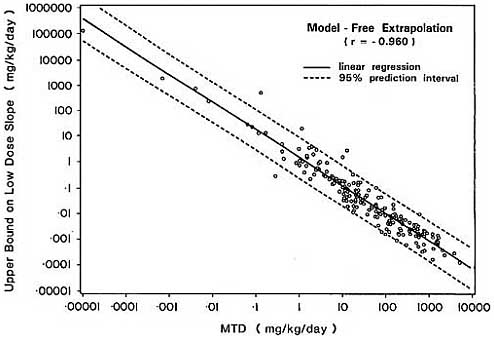
The strong negative association between the MDT and linearized upper bounds on the slope of the dose-response curve in the low dose region is demonstrated empirically in Figure 4 using the 191 carcinogens considered previously in section 3.1. Upper bounds based on both the multistage model and model-free extrapolation are highly correlated with the MDT, with Pearson correlation coefficients of -0.941 and -0.960 respectively.
5.2 Correlation Between q1* and the TD50
The fact that both the TD50 and q1* are correlated with the MTD implies a correlation between the TD50 and q1*. Krewski et al. (1989) provided empirical confirmation of this. An association between the TD50 and linearized estimates of low dose cancer risks has been previously assumed by other investigators. Rulis (1986) used simple linear extrapolation from TD50 values in the CPDB to estimate the 10-6 risk-specific doses (RSDs) for 343 chemical carcinogens. (The RSD is the dose associated with a specified increase in risk.) Similarly, by defining