
malignant cells, measures of the proliferation rates of intermediate cells and the rates of transformation of cells from one-stage to another, and whenever these quantities are dose-related, measures of the response of the parameters to dose. The latter measures are critical in determining the dose-response relationship and consequently assessing risk and estimating potency. Ideally, one would be able to measure the dose-response relationship accurately at doses to which humans are likely to be exposed (which might be much lower than the doses that produced measurable tumor responses in a standard animal bioassay); otherwise, one must assume a functional form for the relationship, which can introduce large uncertainties.
Environmental agents, as well as interindividual genetic differences in their metabolism, can affect tumor incidence through their effects on either mutation rates or the kinetics of cell division and differentiation, or both (Nebert, 1989; 1991a,b; Nebert et al., 1991, 1993 and references reviewed therein). Numerous studies in both mice and humans have demonstrated striking genetic differences in benzo[a]pyrene-induced tumor initiation, in cigarette smoke-induced tumor initiation (and probably tumor promotion), and in dioxin-induced toxicity (and possibly tumor promotion). A mutagenic substance can increase the intermediate-cell population (be an initiator) and can also cause conversion to malignancy (be a complete carcinogen). If only the kinetics of cell division and differentiation are affected by a substance, two general outcomes would be possible: in one, cell division and differentiation would be increased equally, resulting in increased mutation rates related to the increased cell division rate; in the second, the rate of cell division would be increased disproportionately to the rate of differentiation, and the increase would result in greater numbers of cells at risk of mutation.
APPLICATIONS OF THE TWO-STAGE MODEL TO ANIMAL DATA
Applications of the two-stage model have been few, because of limited data availability. Standard two year chronic carcinogenicity bioassays are not designed to provide information on the contribution of cell proliferation to tumor rates, and there are few data on the time-and dose-response effects of agents on cell proliferation. As a result, models that have been developed have generally relied on indirect measures of cell
proliferation, such as increases in organ weights, or on measures of cell proliferation performed in independent experiments with protocols that provide less than ideal data for modeling purposes. Generating adequate data for the characterization of dose-response relationships for cell proliferation rates and of their contribution to tumor rates is a critical need.
The best-known examples of applications of the two-stage model to animal data are those for 2-acetylaminofluorene (2-AAF) in the mouse liver and bladder (Cohen and Ellwein, 1990), for saccharin in the rat bladder (Ellwein and Cohen, 1988), for radon in the rat lung (Moolgavkar et al., 1990b), and for N-nitrosomorpholine (NNM) in the rat liver (Moolgavkar et al., 1990a). In the case of 2-AAF, a genotoxic agent, liver tumor rates are consistent with its effect on the rates of transition between cell stages and have a linear dose-response relationship, as does the rate of DNA adduct formation. In the bladder, a linear rate of DNA adduct formation is observed as well, but the tumor rate is consistent with a nonlinear increase in the rate of cell proliferation at high doses and with an effect of dose on rates of transition between cell stages. Saccharin, a nongenotoxic agent, appears to induce bladder cancer as a result of toxicity-induced regenerative hyperplasia, and its dose-response model is thus based on an effect on the cell growth rate function and not on transition rates. The model that was developed for radon is consistent with a primary effect on the rate of first transition between cell stages, a less-pronounced effect on the rate of second transition, and an increase in the proliferation rate of intermediate cells. Analysis of the data on liver foci development associated with NNM indicates that it is a strong initiator that has a primary effect on the rate of transition to intermediate cells (as detected by foci formation) and that it has a weak promoting effect as well (as determined by its effect on the rate of foci proliferation).
The modeling approaches of Cohen and Ellwein and of Moolgavkar differ. Moolgavkar applies standard statistical methods (e.g., maximum likelihood) that have well-understood statistical properties, to a closed-form solution of the two-stage model. Uncertainty in model parameters and goodness-of-fit of the model to the experimental data can be investigated using standard statistical methods. However, the procedure requires closed-form solutions for the two-stage model, which are only available for a few special cases (although more general cases can be approximated quite closely by the cases for which solutions are available). When a simulation approach is used or a closed-form solution
does not exist, assessing both the model's goodness-of-fit and the uncertainty in parameter estimates is important to understand the applicability of the model for calculating risk. Sensitivity analyses that explore alternative model assumptions and parameter values should be carried out to support such an assessment. Formal statistical techniques should be used whenever possible.
On the other hand, the Cohen and Ellwein approach involves specifying values for each model parameter. A computer simulation is then used to compute realizations of the subsequent tumor response. Parameter values are varied until the realizations conform to the actual data. This procedure can be applied more generally than that of Moolgavkar because a closed-form solution is not required. However, since there are no clear criteria for selecting trial values for the parameters or for determining adequacy of fit, the most appropriate parameters may not be found and results may not be reproducible. Moreover, the method does not readily lend itself to assessing goodness-of-fit and expressing uncertainty in parameter estimates.
Several other applications of the two-stage model have been attempted. Two examples are described here: one for the genotoxic agent benzo[a]pyrene (B[a]P) (Clement Associates, 1988) and one for the nongenotoxic agent chlordane (Thorslund and Charnley, 1988). Both applications involve an approximation to the two-stage model that gives good results only when the probability of a tumor is not too near unity (Moolgavkar et al., 1988). The mathematical expressions defining this approximate model are much less complicated than those required for the exact model; however, the approximation will be poor in some circumstances.
These examples are presented only to illustrate particular points and do not represent complete risk analyses. The committee believes that a complete risk analysis based on a two-stage model should include statistical confidence-intervals for model parameters and estimates of excess risk, which would permit determination of the ranges of risk that are consistent with the data and the particular form of the two-stage model being employed.
-
Benzo[a]pyrene. In an inhalation study, respiratory tract tumors were induced in hamsters exposed daily to a B[a]P/sodium chloride aerosol throughout their lives. These occurred in the nasal cavity, larynx, and trachea (Thyssen et al., 1981). Doses and tumor rates are
-
shown in Table 1. B[a]P is assumed to increase the rates of transition between cell stages and (in the absence of information to the contrary) the B[a]P-induced rates of transition between normal and intermediate and between intermediate and cancerous cells are assumed to be equally likely. It is further assumed that these transition rates are linear functions of dose (which is likely at low doses) and that the growth rates of normal and preneoplastic cells are independent of exposure. Under these assumptions, the probability of tumor development at time t as a result of exposure to level x of B[a]P (or any other genotoxic agent for which the above assumptions are applicable) is:
where M is the background tumor rate parameter, S is the exposure-dependent transition rate between cell stages, G is the exposure-independent growth rate of intermediate cells, and t is the time (or age) at which risk is evaluated. In this case, the level x at the target tissue is assumed to be directly proportional to the administered dose.
The bioassay data in Table 1 can be used to estimate the exposure-induced relative transition rates as well as a background (spontaneous)
TABLE 1 Benzo[a]pyrene Bioassay Data: Observed and Predicted Tumor Rates
|
B[a]P Dose mg/m3 of Air |
Average Survival Time, Weeks |
Number of Hamsters with Respiratory Tract Tumors |
|
|
Observed |
Predicted |
||
|
0 |
96.4 |
0/27 (0%) |
0.73 (3%) |
|
2.2 |
95.2 |
0/27 (0%) |
1.88 (7%) |
|
9.5 |
96.4 |
9/26 (35%) |
9.06 (35%) |
|
46.5 |
59.5 |
13/25 (52%) |
12.59 (50%) |
transition rate, using Equation 8. Fitting the equation to the data by the method of maximum likelihood and using the average survival time as the length of observation yields the following equation for determining the cancer risk for each dose level:
As Table 1 indicates, the number of tumors predicted by this equation is very similar to that observed. However, because none of the animals at the lowest dose developed tumors, the data are also consistent with a threshold-type dose-response.
If survival had not been affected by exposure, Equation 8 could have been reduced to the simple quadratic form:
Equation 10 has the mathematical form of EPA's multistage model, but it is further constrained by the limitation to the first and second powers of x, and it has only two free parameters to determine the three coefficients in the exponent.
If 96.4 weeks is used as the average survival time for the control (unexposed) group, the following time-independent lifetime-risk relationship is obtained with the simplified form of the equation:
With this simplified form and an assumption that at low doses the product of the linear term of the equation and the dose is a close approximation of the estimated cancer risk, the linear term may be expressed as
To extrapolate that potency value to a human cancer risk estimate for
lung cancer and B[a]P, the experimental exposure periods (4.5 hours/day, 7 days/week, for 10 weeks, then 3 hours/day thereafter) can be converted to an average 24 hour exposure period to yield a human cancer potency value of
That value can be compared with the cancer potency value of 1.7 (mg/m3)-1 calculated using the linearized multistage modeling procedure by EPA (1980) based on the same bioassay data. This approximately order-of-magnitude difference is due, at least in part, to the use of the 95% upper confidence limit by EPA instead of the maximum likelihood estimate.
-
Chlordane. The termiticide chlordane produces liver tumors in CD-1 mice (IRDC, 1973), promotes the incidence of liver tumors initiated by dimethylnitrosamine in B6C3F1 mice (Williams and Numoto, 1984), and is only a weak mutagen (Cavender et al., 1986). As a result, its tumorigenicity has been attributed to its tumor-promoting, not-initiating, ability. A nongenotoxic mechanism of action may be proposed that involves hepatocellular mitogenesis, on the basis of observation of proliferative activity in the livers of exposed animals (IRDC, 1973). In the context of the two-stage model, chlordane's tumorigenicity could be proposed to result from its ability to increase the birth rate of intermediate cells while having no direct effect on the rates of transition between cell stages. The probability that a tumor will develop by time t after constant exposure to chlordane at dose x under those assumptions can be expressed as
where M = M0M1 and, again, the approximate form of the two-stage model has been applied. Using this model, the growth rate of intermediate cells, G(x), may be expressed in the form
where G(0) is the normal intermediate-cell growth rate, G(8) is the upper bound on the chlordane-induced intermediate-cell growth rate, and R(x) is the fraction of the maximal increase in the intermediate-cell growth rate that is induced by a constant exposure to chlordane at dose x.
The functional form chosen for R(x) was that of a bounded log-logistic function on the basis of the following logic: at low doses, the function is bounded by the background number of intermediate cells; at high doses, it is reasonable to assume that proliferation, and therefore the number of intermediate cells, reaches a plateau, because it cannot increase indefinitely. That logic has not been examined carefully or validated because of the difficulty inherent in identifying intermediate cells and their kinetics. The log-logistic form assumed for the growth-rate function is
where chlordane is assumed to elicit its proliferative effect as a result of binding at a cellular receptor of some kind, I is proportional to its binding constant, and S is the average number of receptors in (or on) the affected cells.
TABLE 2 Chlordane Bioassay Data: Observed and Predicted Tumor Rates
|
Dose, ppm |
Number of Mice with Liver Tumors |
|||
|
Male |
Female |
|||
|
Observed |
Predicted |
Observed |
Predicted |
|
|
0 |
3/33 (9%) |
3.0 (9%) |
0/45 (0%) |
2.5 (6%) |
|
5 |
5/55 (9%) |
5.8 (11%) |
0/61 (0%) |
3.9 (6%) |
|
25 |
41/52 (79%) |
41.0 (79%) |
32/50 (64%) |
30.4 (61%) |
|
50 |
32/39 (82%) |
32.0 (82%) |
26/37 (70%) |
23.8 (64%) |
|
Source: Thorslund and Charnley, 1988 |
||||
Equation 14 can be fitted to the bioassay data for chlordane shown in Table 2 by using the log-logistic form of the growth-rate function described above and making a number of assumptions regarding the needed parameter estimates (see Table 3):
TABLE 3 Parameter Estimates for Chlordane Dose-Response Model
|
Parameter |
Estimate |
|
G(0) |
0.06314 |
|
M (males) |
2.8622 × 10⁻⁶ |
|
M (females) |
1.722 × 10⁻⁶ |
|
G(8) |
0.11527 |
|
I |
-9.524 |
|
S |
4.0 |
|
Source: Thorslund and Charnley, 1988. |
|
-
Use human age-specific liver cancer death rates to estimate G(0).
-
Use the background rate of spontaneous liver tumors in CD-1 mice to estimate M in male mice and the maximum-likelihood method and total tumor response to estimate M in female mice.
-
Fix S at 4 (based on analogy to other logistic responses).
-
Estimate G(8) and I by equating the observed tumor rates at the two highest chlordane doses to the parametric form of the model and solving the resulting two nonlinear equations with two unknowns.
The predicted tumor rates are quite similar to the observed rates (Table 2) using Equation 16 and the parameter estimates specified in Table 3. The human cancer dose-response model developed on the basis of mouse data for chlordane yields the estimates of cancer risk shown in Table 4. These predictions are at least 3 orders of magnitude less than those obtained using the EPA's linearized multistage procedure, also shown.
To further explore the utility of two-stage models in risk assessment, the committee has conducted additional calculations involving the chlordane example. In the chlordane analysis conducted by Thorslund and Charnley, it was assumed that the two-stage model is appropriate for chlordane. It was further assumed that chlordane increases the rate of division of intermediate cells, but otherwise does not affect tumor rates. The latter is a critical assumption, because, even if the two-stage framework is appropriate for chlordane, the weak dose-response relationship
TABLE 4 Estimates of Chlordane's Human Cancer Risk
|
Dose ppm |
Lifetime Cancer Risk |
|
|
Tumor Promotion Model |
Linearized Multistage Model |
|
|
1 |
1.6 × 10⁻⁵ |
4.8 × 10⁻² |
|
0.1 |
1.2 × 10⁻⁹ |
4.9 × 10⁻³ |
|
0.01 |
8.8 × 10⁻¹⁴ |
4.9 × 10⁻⁴ |
|
Source: Thorslund and Charnley, 1988 |
||
of chlordane could be considerably different from that predicted by the model if chlordane also affects some other step in the carcinogenesis process (e.g., if chlordane also had some effect on the rate of transition from normal to intermediate cells).
Even if all those assumptions are correct, the critical assumption regarding how chlordane affects the growth rate of intermediate cells still requires validation. Having no data for determining that growth rate, Thorslund and Charnley assumed that it had a particular mathematical form, expressed as G(x), where x is the dose of chlordane. To explore the sensitivity of the risk assessment results to this assumption, the committee experimented with other functional forms to determine whether other forms might also describe the data but yield different risk assessment results. One functional form considered by the committee, which varies only slightly from that of Thorslund and Charnley but that also describes the data was
That expression was substituted for the formula for cell-proliferation rate assumed by Thorslund and Charnley, which was
All other parameter values used by Thorslund and Charnley were retained (M = 2.8622 × 10⁻⁶, t = 78 weeks).
Table 5 shows that the fit of Equation 17 to the chlordane data on male mice is comparable with that of the model used by Thorslund and Charnley. However, as Table 6 indicates, the predictions of the two models differ sharply at doses below the experimental range, which is generally the range of interest for environmental regulation. The risk estimates calculated with the committee's exploratory model are higher than those obtained with the model of Thorslund and Charnley by a factor of about 39 for a chlordane dose of 1 ppm, about 24,000 for a dose of 0.1 ppm, and about 23,000,000 for a dose of 0.01 ppm. Those large differences are due solely to differences in the assumed cell-proliferation rate G(x). Thus, distinguishing between these risk estimates would require distinguishing between the underlying cell-proliferation rates determined by the two alternative expressions for G(x).
TABLE 5 Chlordane Data: Fit of Alternative Approximate Two-Stage Models
|
Dose, ppm |
Number Male Mice with Liver Tumors |
||
|
Observed |
Predicted |
||
|
Thorslund and Charnley Modela |
Alternative Modelb |
||
|
0 |
3/33 (9%) |
3.0 (9%) |
3.0 (9%) |
|
5 |
5/55 (9%) |
5.5 (9%) |
5.6 (10%) |
|
25 |
41/52 (79%) |
41.0 (79%) |
41.0 (79%) |
|
50 |
32/39 (82%) |
32.0 (82%) |
32.1 (82%) |
|
abased on Expression (18) for G(x). bbased on Expression (17) for G(x). |
|||
Table 6 compares the values of the cell-proliferation rates from the
Thorslund and Charnley model with those from the alternative model at both the experimental doses and the lower doses for which additional risk was estimated. The predictions of cell-proliferation rates agree closely both at the experimental doses and at lower doses. Extremely small differences in cell-proliferation rate can result in large differences in additional risk. At doses of 0.1 and 0.01 ppm, the two cell-proliferation rates differ only in the sixth decimal place, whereas the resulting extra risks differ by factors of about 4 and 7 orders of magnitude, respectively. Thus, tiny changes in the cell-proliferation rate can make enormous differences in the resulting risk estimates. Given the variation that is normal in biologic systems, it is highly unlikely that such small differences in cell-proliferation rate could ever be accurately distinguished. An additional source of uncertainty could be introduced by assuming that as a weak mutagen, chlordane could have an effect on the transition rates in addition to the cell growth rates. This assumption could alter the risk estimates even more.
TABLE 6 Low Dose Cancer Risk Estimates for Chlordane Derived from Two-Stage Modelsa
In the committee's discussions of these results, it was suggested that they might be due to the use of the approximation to the two-stage model
and that the exact form of the model might not exhibit such instabilities. To explore that issue, the exact form of the two-stage model was fitted to the chlordane data on male rats. As in the application of the approximate model, chlordane was assumed to affect the division and death of intermediate cells. The following specific parameter values were used in the fitting:
As before, x is the dose of chlordane. The two specific forms of G(x) (Expressions 17 and 18) applied to the approximate solution were also applied here in connection with the exact solution. The resulting exact solutions are virtually indistinguishable from the corresponding approximate solutions. Table 7 shows that both exact models fit the data on male mice almost exactly, just as the approximate models do. Table 8
TABLE 7 Chlordane Data: Fit of Alternative Exact Two-Stage Models
|
Dose, ppm |
Number Male Mice with Liver Tumors |
||
|
Observed |
Predicted |
||
|
Expression 18 |
Expression 17 |
||
|
0 |
3/33 (9%) |
3.0 (9%) |
3.0 (9%) |
|
5 |
5/55 (9%) |
5.5 (10%) |
5.7 (10%) |
|
25 |
41/52 (79%) |
41.2 (79%) |
41.2 (79%) |
|
50 |
32/39 (82%) |
32.1 (82%) |
32.1 (82%) |
shows virtually the same risks at low doses for the exact models as shown in Table 6 for the approximate models.
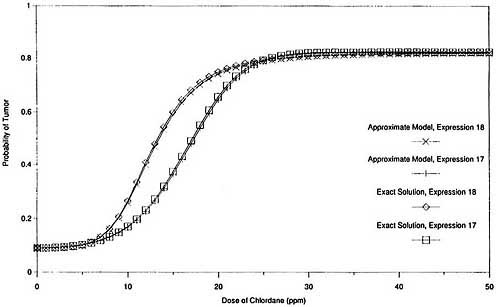
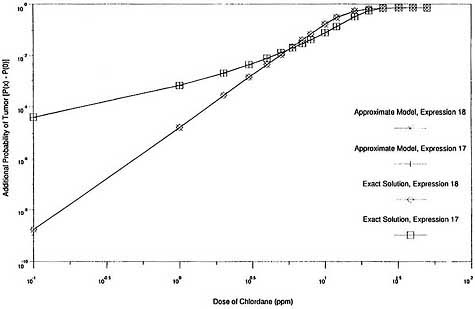
The two exact and two approximate dose-responses are depicted
TABLE 8 Low Dose Cancer Risk Estimates for Chlordane Derived from Exact Two-Stage Models
|
Dose, ppm |
Additional Risks |
|
|
Expression 18 for G(x) |
Expression 17 for G(x) |
|
|
1.0 |
1.7 × 10⁻⁵ |
6.4 × 10⁻⁴ |
|
0.1 |
1.7 × 10⁻⁹ |
4.0 × 10⁻⁵ |
|
0.01 |
1.7 × 10⁻¹³ |
3.8 × 10⁻⁶ |
graphically in Figures 2 and 3. Figure 2 shows that the exact expression for the probability of response, P(x), agrees closely with the approximate solution throughout the complete range of exposures when both are based on the same expression for G(x). It also shows that the two expressions for G(x) provide comparable response probabilities at the experimental exposure levels (0 ppm, 5 ppm, 25 ppm, and 50 ppm) and at all exposure levels below 5 ppm. Figure 3, which is the same as Figure 2 except that log scales are used and the vertical axis is the additional probability of response induced by exposure [P(x) - P(0)], shows that the exact solution for additional probability also agrees closely with the corresponding approximate solution over a wide exposure range, including very low exposures. It also shows that the two expressions for G(x) provide similar results for additional risk at high exposures but very different values at low exposures.
Thus, the exact models produce results in this case that are virtually indistinguishable from those produced by the approximate models that use the same cell-proliferation rate function G(x). The two expressions for G(x) provide very similar response probabilities at the experimental exposure levels (and therefore are indistinguishable based on the experimental data) but predict divergent estimates of additional risk at low exposures. Consequently, there is virtually no difference between the exact and approximate two-stage solutions in this case, and the exact model is subject to the same instabilities as the approximate model.
This type of instability is likely to be the rule, rather than the exception. A general model for the probability of cancer arising from a dose x can be written as
where ß1,…,ßk are parameters that are unaffected by dose and G(x) is the parameter that is affected by dose. In the chlordane example, G(x) represented cell-proliferation rate, although for the purposes of the current argument it could be any biologic parameter that is affected by dose. At low doses, the probability is approximately
Thus, the dose-response relationship will behave at low doses like a linear function of G(x). That implies that the dose-response relationship for cancer at low doses will mimic that of the parameter that dose affects. The Red Book (NRC, 1983) showed that different dose-response curves for P(x) could be obtained that fit data in the observable range but yield results for incremental risk (above background) that differ by many orders of magnitude in the low dose range. The same arguments apply to G(x) and therefore, through Equation 20 relating P(x) to G(x), to P(x) again.
Those considerations suggest steps that are critical in using a two-stage model (or any other biologically based model) for low dose extrapolation. Identifying the biologic steps that lead to cancer and determining which ones are affected by the chemical insult are the first steps in the process. Another is the specification of the dose-response relationship for the parameter G(x) (cell-proliferation rate, mutation rate, etc.) or parameters that are affected by the chemical insult. Regardless of how detailed and reliable the model is otherwise, if it does not specify a mathematical form for G(x), the quantitative predictions of the model at low doses are essentially arbitrary. More precisely, given a specific two-stage model that fits a given set of dose-response data adequately, the function G can be adjusted so that the adjusted model describes the data equally well but corresponds to estimates of additional cancer risk over the background risk that differ from estimates based on the original


