
3
Data from Major Studies of Premature Mortality
Understanding the determinants of premature mortality has important implications for public health policy. Research over the last 20 years has shown that preventable factors—factors amenable to change—could account for 40 percent or more of premature deaths (McGinnis and Foege, 1993; Mokdad et al., 2004; Schroeder, 2007). However, new research studies can add to this body of work to reflect more recent mortality and risk factor data. Providing further impetus for examining current studies in this area are recent international comparisons showing that the United States compares poorly with other developed nations in longevity and years of life lost (YLL). Presenters described current data and analyses of the determinants of premature mortality.
UPDATING MCGINNIS’ ACTUAL CAUSES OF DEATH
At the 2013 workshop, Michael McGinnis presented analyses of the determinants of premature mortality, comparing the contribution of known preventable factors from 1990, 2000, and 2010. He applied the same methodology to derive estimates in each of those years using available mortality data and, as previously, used a rounding rule to avoid false precision. He underscored that the updated assessments were provisional pending further work. Table 3-1 shows the comparison of these preventable factors at the three timepoints.
TABLE 3-1 Rounded Estimates of Preventable Factors Causing U.S. Premature Mortality in 1990, 2000, and 2010
| Cause | 1990 Number of Deaths | 2000 Number of Deaths | 2010 Number of Deaths |
| Tobacco | 375,000 | 375,000 | (350,000) |
| Diet/activity patterns | 300,000 | 350,000 | (400,000) |
| Alcohol | 90,000 | 80,000 | (70,000) |
| Microbial agents | 90,000 | 80,000 | (80,000) |
| Medical errors | NA | 70,000 | (70,000) |
| Toxic agents | 60,000 | 60,000 | (60,000) |
| Firearms | 35,000 | 30,000 | 30,000+ |
| Sexual behavior | 30,000 | 20,000 | (15,000) |
| Motor vehicles | 25,000 | 25,000 | (20,000) |
| Illicit use of drugs | 20,000 | 15,000 | (20,000) |
| Total of premature mortality | 1,095,000 | 1,105,000 | (1,115,000) |
| All causes of mortality | 2,150,000 | 2,400,000 | 2,470,000 |
NOTES: Provisional estimates are shown in parentheses. Medical errors were not cal-culated in 1990.
SOURCE: McGinnis (2013).
McGinnis explained that his most recent analyses of tobacco and alcohol were computed from the model, rather than using the Centers for Disease Control and Prevention (CDC) estimates as was done for the 1990 figures. In addition, the number of deaths due to medical errors was not originally available in 1990 but was estimated using the report To Err Is Human (Institute of Medicine, 2000). He added that data from 2010 continue to require analysis and further adjustment to refine the estimates.
McGinnis explained that Table 3-1 shows that the number of deaths from tobacco is decreasing, but the contribution of diet and exercise patterns to early and preventable deaths has increased over the past 20 years, erasing gains from reductions in other factors like tobacco and alcohol. He pointed out that deaths attributed to sexual behavior decreased as deaths from HIV decreased. Table 3-2 compares the estimated percentages of deaths attributed to preventable causes between 1990 and 2010. These data show that as of 2010, approximately 48 percent of all early deaths are due to preventable factors, as was the case with his earlier findings. McGinnis
TABLE 3-2 Adjusted Percentages of Proximate Preventable Factors Causing Premature Mortality in 1990 and 2010
| Cause | 1990 % of Total Deaths | 2010 % of Total Deaths |
| Tobacco | 17 | 15 |
| Diet/activity patterns | 14 | 18 |
| Alcohol | 4 | 3 |
| Microbial agents | 4 | 2 |
| Medical errors | N/A | 3 |
| Toxic agents | 3 | 2.5 |
| Firearms | 2 | 1.5 |
| Sexual behavior | 2 | 1 |
| Motor vehicles | 1 | 1 |
| Illicit use of drugs | 1 | 1 |
| Total | 48 | 48 |
| All causes | 100.0 | 100.0 |
NOTE: Medical errors were not calculated in 1990.
SOURCE: McGinnis (2013).
concluded this update by noting that better assessments of socioeconomic factors, including social engagement, are important for future analyses.
FINDINGS FROM INTERNATIONAL COMPARISONS
Several presentations at the 2013 workshop and the follow-up meeting in 2014 addressed comparisons between the United States and other countries on causes of premature mortality and associated risk factors.
Explaining Divergent Levels of Longevity in High-Income Countries
Samuel Preston presented the major findings from the National Research Council (NRC) study on Explaining Divergent Levels of Longevity in High-Income Countries (National Research Council, 2011), which focused on identifying trends in longevity and sought to understand why the trends differ between the United States and other countries for
individuals above age 50. (See also the discussion about this study in Chapters 1 and 2.) This study examined seven risk factors for shorter lifespans across 10 countries, including the United States. Of the seven factors—health care system, inequality, social integration and social interaction, smoking, obesity, physical activity, and hormone replacement therapy—smoking and obesity emerged as the most important factors explaining the differences in longevity. As shown in Figure 3-1, the United States had the lowest average life expectancy at age 50 in 2006 of all the comparison countries. Japan had the highest life expectancy on average, and particularly so for women.
Smoking explains a high proportion of the differences in longevity between the United States and other countries, according to Preston. Between 1945 and 1985, the United States consumed the most tobacco
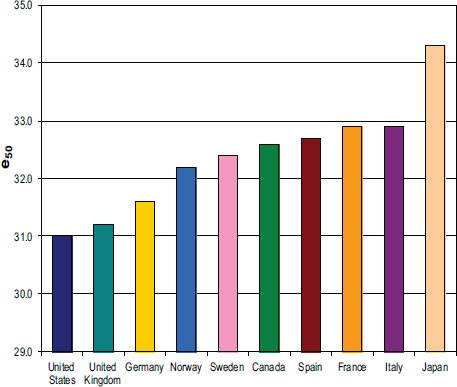
FIGURE 3-1 Average life expectancy in 2006 at age 50 in the United States and com-parison countries.
NOTE: e50 is life expectancy at age 50.
SOURCE: Preston (2013).
per capita in the Western world, replaced in more recent decades by Japan. Prevalence of smoking was also high in the United States, but the patterns were quite different for males and females. The difference between U.S. men and women widened for 40 years until the mid-1980s when it began to contract. Since that time, the sex difference in mortality has contracted substantially because smoking prevalence peaked for women born during World War II. The heavy smoking history in the United States manifests itself in lung cancer mortality. Denmark and the Netherlands also have high lung cancer mortality. Canada has high rates of lung cancer mortality, but less of a shortfall in overall life expectancy than the United States.
Trends in the number of U.S. deaths over age 50 due to smoking indicate that between 1955 and 1980, attributable deaths for men increased from 9 percent to 24 percent, then remained steady until 2003. For women, only 1 percent of deaths over age 50 were attributable to smoking in 1955. This rose to 7 percent in 1980, and, by 2003, the percentage increased substantially to 23 percent. Canada has a similar pattern and percentages; however, many other developed nations, including France, Italy, and Spain, have a much lower percentage of deaths due to smoking, in part because women did not smoke in these countries until much more recently, did not smoke very heavily, and are not dying from smoking-related causes, according to Preston.
Overall, Preston reported that smoking explains approximately 80 percent of the difference in longevity for women at age 50 between the United States and the nine other nations. Further, U.S. women lose an estimated 2.33 years of life due to smoking compared to a mean of 1.07 across all other countries. U.S. men lose more years of life due to smoking than do women, but the difference between the United States and other countries for men is not as great. Smoking explains about 41 percent of the difference in longevity for U.S. men compared to men in other countries.
The United States compares unfavorably to other nations in the prevalence of obesity as well, particularly at the highest and most dangerous levels of obesity, and for women more than men. According to Preston, “Our conclusion on obesity was that it is important. Even if you took the lower set of risks, it looks like about a fifth of the difference in life expectancy between the United States and these other nine countries would be attributable to obesity. If you took the PSC [Prospective Studies Collaboration] estimates, it is more in the neighborhood of 40 percent.” Moreover, he added that existing biases in the data, as described in Chapter 2, tend to result in underestimating the effect of obesity on mortality.
U.S. Health in International Perspective Study
Jessica Ho shared findings from U.S. Health in International Perspective: Shorter Lives, Poorer Health (National Research Council and Institute of Medicine, 2013). This study focused on mortality under age 50, comparing the United States to 16 other high-income countries on life expectancy at birth, probability of survival to age 50, age-specific death rates, age-standardized mortality rates for specific causes, and YLL from particular causes under 50. (See also Chapters 1 and 2 for discussion of this study.) Overall, as of 2007, the United States ranks last among 17 countries for men at 75.6 years and second to last for women at 80.8 years in life expectancy at birth. The highest ranking Swiss males could expect to live 3.7 years longer than American males. The highest ranking Japanese women could expect to live 5.2 years longer than American women. According to Ho, “on average, the people in the other countries could expect to live over two years longer than Americans.”
Between 1997 and 2007, life expectancy in the United States increased by 1.5 years, but the rate of increase is much slower than in other countries. Even freezing life expectancy of other countries at their current levels, it would take the United States 20 to 40 years to catch up to the world leaders in life expectancy at the current rate, according to Ho. At each age, U.S. death rates rank at or near the bottom of this list of countries for both men and women until age 75, after which it moves toward the top of the rankings.
As Ho explained, this study examined how different age groups contribute to the shortfall in life expectancy between the United States and other countries. In total, based on 2007 data, mortality under age 50 explains 67 percent of the shortfall for men and 41 percent of the shortfall for women. Infant mortality accounts for just over 12 percent of the total shortfall for males and 10 percent of the shortfall for females. Mortality at younger ages is a particular issue for U.S. men. For example, these data show that the 20–24 age group for males contributes 9.1 percent toward the shortfall, compared with 2.9 percent for females in this same age group. For nearly all comparison countries, more than half of the difference in life expectancy compared to the United States is due to mortality under age 50 for men, because U.S. men have higher mortality rates at younger ages. For women, mortality before age 50 accounts for 20 percent or more of the difference in life expectancy between the United States and other countries.
According to Ho, the United States is losing more years of life below age 50 than are other countries, with men faring worse than women. American men lose 1.36 years of life below 50 compared to less than 1 year for the next nearest country. American women also rank last in YLL, losing 0.8 years before age 50. For both men and women, English-speaking countries cluster near the bottom in YLL. As shown in Figure 3-2, homicides account for the biggest proportion (19 percent) of the difference in YLL for men between the United States and other countries, the majority of which are due to firearms. According to Ho, over 70 percent of all homicides under age 50 in the United States are due to firearms, compared with an average of 26 percent among comparison countries.
Transport fatalities account for 18 percent of the difference in YLL for men, most of which are motor vehicle accidents. Ho explained that although the United States had lower fatality rates per kilometer driven than other countries until 2004, Americans have more fatalities because they have much more exposure to this risk, driving many more total miles per year than people in other countries. Nontransport injuries explain 16 percent of the difference in YLL for men, the majority of which are accidental drug overdoses due primarily to prescription drugs like opioid painkillers, which have overtaken heroin and cocaine in causing overdose deaths.
Homicide explains a much smaller proportion of the differences in YLL for women at 7 percent, with similar percentages to men for transport and nontransport injuries (see Figure 3-2), Ho stated. Accidental drug overdoses constitute a greater proportion of nontransport injuries among women, however. Cardiovascular disease makes very similar contributions for men and women, accounting for about 8 to 9 percent of U.S. excess YLL below age 50. For women, other noncommunicable diseases and perinatal conditions account for 20 and 19 percent, respectively, of differences in YLL between the United States and other countries.
Global Burden of Disease Study
Christopher Murray shared the latest data from the Global Burden of Disease (GBD) Study at both the 2013 workshop and the follow-up meeting held in 2014.
In 2013, Murray presented data on the leading causes of death in the United States for 1990 through 2010. Using age-standardized rates, deaths attributed to Alzheimer’s disease, chronic kidney disease, and drug-use disorders increased during this period, while deaths from cirrhosis were stable.
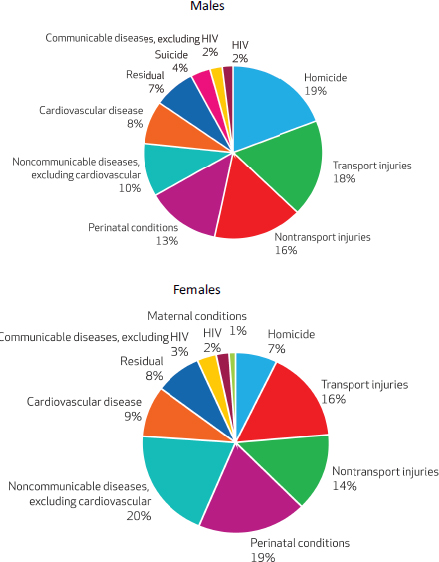
FIGURE 3-2 Cause-specific contribution to the U.S. disadvantage in years of life lost below age 50, 2006–2008.
SOURCE: Ho (2013). Copyrighted and published by Project HOPE/Health Affairs as Ho (2013). Mortality under age 50 accounts for much of the fact that U.S. life expectancy lags that of other high-income countries. Health Affairs 32(3), 459–467. The published article is archived and available online at http://www.healthaffairs.org.
A different picture emerges when examining YLL. Ischemic heart disease, lung cancer, and road injury top the list of causes of death that result in the highest YLL, even though age-standardized rates of these causes have decreased in recent decades. Suicide and interpersonal violence are also among the top 10 causes associated with YLL in the United States.
Trends in life expectancy across countries in the OECD reveal the greatest improvements for males in South Korea and for females in Turkey. The United States had some of the smallest increases. Across countries, cardiovascular disease is the leading cause of death. Cancer is an important factor in particular countries, such as Belgium. Other countries have seen decreases in factors such as road transport injuries.
The conditions associated with the most disability adjusted life years (DALY) are entirely different from those associated with YLL in the United States. Depression, lower back pain, and other musculoskeletal conditions rank highest because of their prevalence and because they generally do not cause premature mortality. Murray noted that although the United States fares poorly against other nations in terms of the age-standardized YLL burden, it ranks near the top on DALY. More research is needed to understand these phenomena, he stated.
Risk Factors for Premature Mortality
The top risk factors for premature mortality are diet, high blood pressure, obesity, and tobacco use, he reported. Tobacco remains the second leading risk factor, despite the 37 percent decrease over two decades in age-standardized rates in current smoking prevalence.
Murray noted that analyses of GBD data generally involve comparing a single risk factor to the counterfactual. In some cases, clusters of risk factors are analyzed. However, these analyses have not included correction for double-counting. As a result, conditions such as ischemic heart disease and cancer may both be making claims on deaths related to poor diet, smoking, high blood pressure, obesity, low physical activity, and high fasting plasma glucose. Murray stated, “If you rescaled them to ‘avoid double-counting,’ you would have a huge effect on the number. [There] has been an enormous controversy, at least in the comparative risk field, about the desirability of doing that.”
Murray discussed U.S. deaths attributable to poor diet, a cluster of 14 risk factors comprised of low fruit, nuts, and seeds; high sodium; low vegetables; high processed meat; and other elements. Diet accounts for
14 percent of overall premature mortality and disability, or over 650,000 deaths in 2010. Tobacco accounts for 12 percent of premature mortality and disability, obesity just under 12 percent, followed by high blood pressure. Obesity (high body mass index [BMI]) has risen to be the third leading cause of YLL to early death in the United States in 2010, up from fourth place in 1990.1
At the 2013 meeting, Murray reported that the combined behavioral risk factors of diet, physical activity, alcohol and drugs, tobacco, and high BMI accounted for 50 percent of early deaths in the United States in 2010. A significant portion of those deaths were due to heart disease. However, behavioral risks accounted for only 35 percent of DALY in the United States when disabilities were added to the analysis, according to Murray.
At the 2014 meeting, Murray presented updated analyses of premature mortality attributed to risk factors. He described the portions of various causes of early deaths in the United States in 2013 explained by all risk factors combined. Eighty-three percent of cardiovascular disease and 72 percent of chronic respiratory disease can be explained by behavioral, environmental, and metabolic risk factors, he noted, but only 38 percent of cancer deaths can be explained by these same types of factors. Injuries have been a rising source of YLL in the United States over the past two decades. Overall, approximately 50 percent of premature U.S. deaths can be accounted for by one of the quantified risks.
Behavioral risks top metabolic and environmental risk factors in terms of explaining premature mortality in the United States, Murray explained, noting that about 35 percent of U.S. premature mortality is related to behavioral risks. Metabolic risks account for 29 percent and environmental risks account for 7 percent of early deaths.2 Behavioral risk factors account for more early deaths among men than among women. High BMI, high blood pressure, and smoking account for the greatest percentages of YLL in the United States, followed by air pollution, alcohol, cholesterol, drug
_____________
1 The varying estimates of obesity-related deaths presented at the two workshops underscore the difficulty of making precise attributions of the mortality impact for certain risk factors and changes in impact over time (see, e.g., Mark, 2005; Greenberg, 2013; Masters et al., 2013).
2 The figures included in this workshop summary represent the latest figures provided by Murray and his colleagues after the workshop. During the workshop, Murray indicated that 42 percent of premature mortality was attributable to behavioral risk factors, 24 percent attributable to metabolic risk factors, and 14 percent attributable to environmental risk factors.
use, high fasting plasma glucose, intimate partner violence, low glomular filtration rate, and poor diet.
Disability Adjusted Life Years
Theo Vos presented analyses of risk factors associated with DALY at the meeting in 2014. The top causes of years lived with disability (YLD), such as low back pain, have low mortality rates. He and Murray explained that health care expenditures are more highly correlated with the causes of YLD than with YLL. For example, musculoskeletal disorders account for 15 percent of health care spending in the United States.
Murray noted risks for YLD are less well known than for YLL. Such risks include neurological disorders, mental health disorders, and musculoskeletal conditions. By contrast, far more is known about the determinants of cardiovascular disease and cancer, he explained.
VARIATION WITHIN THE UNITED STATES
Geographic and Socioeconomic/Race/Ethnicity Disparities in the Causes of Premature Death
Haidong Wang presented findings from two studies of the geographic disparities in life expectancy in the United States based on work he published in July 2013 and ongoing work on the socioeconomic status (SES) determinants of life expectancy at the county level (Wang et al., 2013). (See also Chapter 2.) He noted that while life expectancy and healthy life expectancy for both men and women in the United States increased between 1990 and 2010, other developed nations have outperformed this nation on these measures during the same time period. Understanding the patterns at the U.S. county level can help to shed light on why the United States is lagging behind other nations despite the fact that the United States spends more than any other country on health care, he argued.
Life expectancy at birth varies widely across the United States. For men, life expectancy in the highest counties is 82 years, higher than the top countries, including Japanese and Swiss men, and the lowest slightly less than 65, lower than men in Bangladesh in the year 2010. Wang explained that counties that currently rank highly have seen significant and steady improvement in life expectancy, while those that lag behind have barely changed over the past 25-year period. For women, life expectancy ranged
from below 73 years to 85 years in 2010, the most recent year for which they provided estimates; however, 42 percent of the counties in the United States stayed the same or declined in female life expectancy. In fact, while 72 counties had significant decreases in life expectancy for women, only one U.S. county had a significant decrease for men.
Wang also showed that heterogeneity in life expectancy between counties is increasing for both males and females. For women, inequalities have grown steadily, while inequalities for men have occurred in several phases. During the period 2002 to 2010, the number of counties with significant decreases in both sexes life expectancy declined. Great variation between males and females is also observed within counties as well. Wang explained, “In the worst-performing counties, the difference between the life expectancy of men and women could be over 11 to 13 years, and in the best-performing counties, the difference is only around two to four years.” Overall, men’s average life expectancy is lower than women’s but improving at a faster rate.
The lowest life expectancies across time are seen in the South, the Mississippi basin, West Virginia, Kentucky, and counties with large Native American populations. Some of the regions with the lowest life expectancies including Kentucky and West Virginia are also the places where smoking prevalence is highest in the United States, Wang pointed out. Some of the lowest life expectancies are found where proportions of Native American populations are highest.
Wang suggested four possible explanations for the disparities in life expectancy he observed: domestic and international migration; SES factors like education and poverty; lack of access to or poor quality of health care; and behavioral, environmental, or metabolic risk factors. He and his colleagues are conducting analyses to determine the relationship between mortality at the county level and socioeconomic factors, including gross domestic product (GDP), education, percentage of the population that is African American, and percentage of the population that is Hispanic, Asian, or Native American. Since 1985, the areas of the country with the lowest life expectancies generally have been those areas with lower levels of education; however, the proportion of the adult population with at least a high school diploma has increased significantly. During the same time period, the proportion of the population that is Asian, Hispanic, or Native American has increased.
Using a within and between estimator model, Wang and his colleagues examined differences between counties and variation within counties.
Counties with historically higher income levels and counties with lower proportions of minority populations tend to have higher life expectancies. Within counties, when migration to a county increases, life expectancy at birth also increases. Preston suggested that Wang could consider disaggregating Native Americans from the group with the Hispanic and Asian populations because the mortality rates and patterns between the groups are quite different. Somewhat counterintuitively, Wang noted, when a county gains new income or wealth, life expectancies decrease. Follow-up analyses support the theory that new income may be spent on more risky behavior, including drinking and smoking. Preston added other research has supported this theory as well, and automobile accidents may increase as a result of increased income, which tends to increase the amount of driving that people do. He suggested the impacts of smoking as a result of new income would likely not explain increased mortality rates because the detrimental effects of smoking are more often long term. Longer-term changes in mean levels of income at the county level, however, are protective, Wang stated.
At the 2014 meeting, Wang presented new analyses aimed at determining patterns of risk factors that would explain disparities in longevity and mortality rates at the county level. He and his colleagues examined outliers, those counties whose life expectancies decreased despite improving per capita income and vice versa. Analyses were done separately for men and women considering a wide range of risk factors.
Examining a range of risk factors, Wang shared results that indicate that over the period 1996 to 2012, 40 percent of the counties have seen significant decrease in smoking prevalence for men, compared to only 16 percent for women (see Figure 3-3). Analyses of the prevalence of obesity in 2011 also show that women have fared worse than men at the county level (see Figure 3-4). During this time period, no counties saw a significant decrease in the prevalence of obesity, Wang pointed out. Murray and Mark Cullen also noted that patterns among the Hispanic population add complexity to interpreting the results because this population has relatively high rates of obesity and often has less than a high school education, but appears to have lower mortality rates than other populations.
Subsequent discussion focused on the impact of migration patterns within the United States on life expectancy. John Haaga suggested that migration of young and/or healthy individuals away from unhealthy communities might explain why certain counties have stagnated or decreased in longevity. In his view, such migration patterns could be an underlying
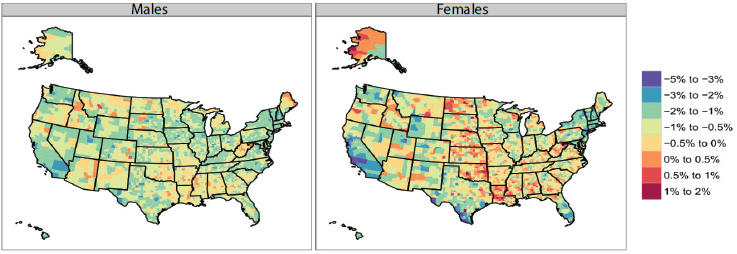
FIGURE 3-3 Annualized rate of change in U.S. smoking prevalence, by county, 1996-2012.
SOURCE: Institute for Health Metrics and Evaluation (2014).
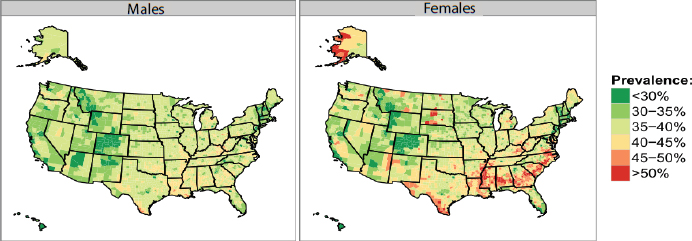
FIGURE 3-4 Obesity prevalence in U.S. counties, 2011.
SOURCE: Institute for Health Metrics and Evaluation (2014).
explanation for patterns in risk factor and health distributions. However, Murray said his analyses of Internal Revenue Service tax return data at the county level indicate that there is a net migration from healthy communities to unhealthy communities, although exceptions exist. Ali Mokdad also described recent research that found that being from an area with higher risk factors earlier in life was an important risk factor in explaining mortality rates. Cullen and Haaga affirmed these findings in their own work. Haaga stated, “If you were born in the ‘stroke belt’ and grew up there, you carry your stroke risk with you wherever you go.” Mokdad indicated that migration patterns only account for a small portion of patterns in risk factors. For example, historical, economic, and social patterns are also helpful to consider in understanding trends in smoking prevalence at the county level, he and Wang suggested. Finally, Haaga noted that county-level data offer a picture of heterogeneity across regions that would not be captured at the state level.
Sex, Race, and Geographic Differences in Mortality
Mark Cullen examined the factors that predict survival to age 70 for men and women, and for white and black populations. Using county-level data, the 22 predictors he examined had high explanatory power for predicting survival to age 70; however, the patterns were quite distinct between white males, white females, black males, and black females. The indicator of medical care was an important positive predictor for all four populations. Having a managerial or professional occupation was also a positive predictor. Although low education was a stronger negative for whites than for blacks, the strongest negative predictors were poverty and living singly. However, he said, the prevalence of immigrants is also a huge factor because immigrants, particularly those from Mexico, tend to have low educational levels but high survival rates. When prevalence of immigrants is removed from the analysis, education and income are eliminated as significant predictors of survival to age 70.
Considering behavioral data from the Behavioral Risk Factor Surveillance System for the white population did not add a great deal of explanatory power to the model, he said. Cullen and his colleagues also worked to determine the factors that explain the racial differences in survival to 70 using county-level data, and concluded that most of the differences between races can be explained by differences in upstream determinants such as socioeconomic factors.
Cullen highlighted key differences in the life expectancy patterns of men and women, using both U.S. and international data. He stated, “I think there is an extraordinary potential value in recognizing that the population who is losing the most life….is men.” These differences are socially driven, he argued. Women tend to have higher survival rates than men, but these differences narrow as household income increases. In models considering gender differences and predictive factors in the United States, high school graduation, income, poverty, and obesity are significant, but smoking adds little predictive power to the model. According to Cullen, “upstream determinants are probably pretty strong predictors of such things as smoking, dietary factors, activity, and the like.”
Similar patterns can be observed between countries and within other countries. Cullen indicated that there is a strong positive linear relationship between GDP per capita and the ratio of male-to-female life expectancy. In other words, more gender disparity in life expectancy is associated with lower GDP. The higher the GDP, the more women’s and men’s life expectancies are the same; however, Cullen has not identified any instances worldwide where men’s life expectancy across a population matches or exceeds women’s life expectancy. This pattern is maintained within other countries as well.
At the state level within the United States, the relationship between the ratio of men’s and women’s survival to age 70 and the log of percentage of high school graduation is “stunningly linear,” according to Cullen, and only slightly less so for log low income per capita. Women benefit from increased rates of high school graduation and higher income, but these factors have a greater impact on men’s survival to 70. Cullen concluded that future health interventions should take into account the findings that show that “women are clearly more resistant to taking up the bad habits that cause chronic disease, and to the extent that they do take them up, appear less likely to die from them.”
Subsequent discussion focused on the differences between men and women. Cullen indicated that more research is needed to identify underlying and/or currently unmeasured social or biological factors that explain these different outcomes. Other studies are also identifying gender differences in mortality, he pointed out. For example, a recent study examining disease prevalence found that men and women appeared similar with regard to disease severity for conditions such as coronary disease, chronic obstructive pulmonary disease, or cirrhosis, but had different mortality outcomes (Case and Paxson, 2005). The convergence of lifestyles between men and women has been to the benefit of men, Cullen summarized.
Cullen noted that his analyses did not consider risk-taking behavior, injuries, or other causes of death. Although others have seen changes in the patterns of cohort smoking as a potential reason for the closing of the gap between men and women, Cullen’s cross-sectional analyses do not support smoking as a significant explanatory variable, after taking socioeconomic status into account. Cullen suggested research on the determinants of premature mortality consider the “upstream/downstream” issues, but also indicated his findings do not diminish the importance of the behavioral determinants of premature mortality, which, as he noted, “at the individual level [are] probably everything.”
Cullen’s ongoing longitudinal work following the incidence rates of diabetes, hypertension, and heart disease and other conditions among different manufacturing workforces in 24 states showed remarkably different incidence patterns among groups who seemed similar on factors, such as education, obesity, and smoking. He explained these differences prompted his work on identifying underlying factors through an ecological approach. He suggested that behavior is quite heterogeneous and may also be representative of other upstream determinants, such as early life experiences and environments. Nevertheless, he argued that it is important to understand the direct effects of behavior.
McGinnis and Murray both provided recent analyses of the behavioral determinants of premature mortality, indicating that the risk factors amenable to change account for between 35 and 50 percent of early deaths in the United States. Other presenters helped to place these findings in context, both from an international perspective and by demonstrating how patterns of risk and mortality vary across the United States by region, age group, sex, and socioeconomic factors.
At the 2014 meeting, individual participants summarized additional key points from each presentation as follows:
- Behavioral risks account for a smaller proportion of DALY than of various measures of premature mortality, including YLL, but this finding appears likely to change with further study (Vos, Murray).
- Risks vary by geographic area and gender within the United States, with behavior as a more important determinant in some places
-
than in others, particularly with regard to tobacco use and obesity (Mokdad, Wang, Murray, Vos).
- Risky behavior is an important determinant of premature death, particularly for men over time (Cullen, Crimmins).
- These behaviors may have their roots in upstream social causes, and these linkages are in need of further study (Cullen).
This page intentionally left blank.


