
2
Data Sources and Methodology in the Study of Premature Mortality
Certain behaviors, exposures, and predispositions place people at risk for early death or poor health outcomes. The impetus for the workshops was to better understand the risk factors most amenable to prevention and health policy efforts, primarily behavioral risk factors. The definition of “early” can vary. Michael McGinnis’ initial work focused on deaths prior to age 75, but later work has focused on deaths before age 80. The World Health Organization’s Global Burden of Disease compares years of life lost against a reference age of 86, or the highest average lifespan of a country with a population over 5 million. Other studies have focused on survival to age 70. The implications of these definitions, sources of data, and other methodological considerations are the focus of this chapter.
REVIEW OF THE METHODOLOGY FOR THE 1993 ESTIMATES OF THE ACTUAL CAUSES OF MORTALITY
As described in Chapter 1, McGinnis and Foege (1993) and later Schroeder (2007) published work on the causes of premature mortality. At the 2013 workshop, McGinnis revisited this work, stating that the five domain determinants—genetic predisposition, social circumstances, environmental exposures, behavioral choices, and health care shortfalls—“represent, from my perspective at least, essentially the domains that work independently and collectively to shape our health prospects.” The relative
contribution of these domains naturally varies with changing circumstances, he noted. Data used to produce these estimates come from various sources, including research published in the Journal of the American Medical Association1 and by the Centers for Disease Control and Prevention,2 with genetic predisposition estimated from the residual. McGinnis stressed that these estimates are not only very approximate but also are quite dynamic and in need of updating and further study. Although risk factors are most often studied in isolation, tracking these factors and their interactions in a societal context might yield a better understanding about the real sources of problems. McGinnis indicated a need “to move our sense of what the vital statistics for the nation are away from the autopsy table and into society, as a whole, so that we have a much better means and reason for tracking the real sources of problems and opportunities that confront Americans.”
The following sections describe various approaches to measuring premature mortality and associated risk factors presented at the workshops.
APPROACHES TO MEASURING PREMATURE MORTALITY AND RISK FACTORS
Samuel Preston, University of Pennsylvania, described two basic approaches to identifying deaths attributable to a particular type of behavior. The first is categorical based on the use of cause-of-death assignments. For causes such as homicide or alcohol poisoning, the proximate cause-of-death attribution is straightforward and easy to interpret. In these cases, researchers can compare the differences in mortality between countries by particular causes. The second approach involves causes that are multifactorial, such as cardiovascular disease. These multifactorial causes of death become increasingly important the older the population. For these causes, cause-of-death data often do not help to identify behavioral risk factors. Therefore, researchers use risk factor exposure data to combine a set of relative risks associated with a given behavior, such as smoking, with the population distribution of that behavior, in order to estimate the percentage of deaths that would be averted if everyone were a nonsmoker. This “what-if” approach to identifying amount of risk is also called the counterfactual or cause-deleted approach.
_____________
1 See U.S. Burden of Disease Collaborators (2013).
2 See http://www.cdc.gov/nchs/fastats/alcohol.htm [November 2013].
During his presentation in 2014, Theo Vos, Institute for Health Metrics and Evaluation, shared his views on these two approaches. A benefit of the categorical approach is that a single underlying cause of death is assigned. All causes total 100 percent and proportions are easily assigned. This approach avoids a criticism of disease-specific estimations where numbers of deaths attributed to the disease of interest are often overly inclusive. However, the disadvantage of the categorical approach is that it is not always easy to assign an underlying cause of death. Variations in medical coding practices pose an additional methodological challenge to making estimates comparable over time and between geographies, according to Vos. Similar challenges of ascertainment of cause of death apply in a counterfactual approach to estimating causes of death, he argued.
Researchers have used these two broad approaches to understand and compare the risks of premature mortality. However, they have also conceptualized and measured premature mortality in various ways within these approaches. Presenters described these approaches, as summarized below.
Categorical Approaches
The assigned cause of death is key information used in the categorical approach to measuring premature mortality. Robert Anderson, National Center for Health Statistics (NCHS), described the vital statistics data available to researchers, the data’s applications and limitations, and his suggestions for improvement. The responsibility for death registration in the United States lies with the states. In some cases, cities such as New York City have their own systems. Funeral directors generally provide demographic and personal information, and physicians, medical examiners, and coroners provide the cause-of-death information. These records from various states are compiled into the National Vital Statistics System, which then generates national statistics. In return for the records, the states receive standards, training, and some funding.
A standard death certificate was provided to states in 2003. By 2010, a subset of 36 states or other areas was using it, which has implications for comparability and completeness of the national data, Anderson noted. One item on the standard form relates to whether the death was tobacco related. The physician who certifies the death can enter “yes,” “no,” “probably,” or “unknown.” As the number of adopting states increased, so did the numbers of tobacco-related deaths. Although the form is now better at detecting tobacco-related deaths, it probably still underestimates these deaths because
nearly 50 percent of the time, respondents check “unknown.” In some cases, this is because the certifying physician does not know, but in other cases there may be insurance-related ramifications from checking “yes” that may make some physicians reluctant to provide this information on the death certificate.
Anderson indicated that data from death certificates tend to underestimate obesity-related deaths, primarily because physicians do not see that condition as the proximal cause. Education, consisting of highest degree attained, is currently the only indicator of socioeconomic status available in the vital statistics system. Education was previously measured in years, so comparability between versions of the certificate is an issue. Occupation/industry was provided until 1999 when it was dropped as a reporting requirement from the items collected by NCHS. Data on income are not available. The National Vital Statistics System contains accurate and reliable counts of deaths due to firearms, drugs, and alcohol. The system does not capture alcohol-related motor vehicle fatalities.
Electronic health and death records and the potential for linkages between them and other sources of data have the potential to increase the timeliness, amount, and quality of data on the risk factors for premature mortality, Anderson said. Currently, only a portion of the states and jurisdictions using the standard form are registering them electronically. In many cases, the funeral director uses an electronic system but the certifying physician does not. As use of electronic systems increases, however, Anderson argued that the potential exists that certifying physicians could have access to a decedent’s medical history through the electronic medical record that could enable improved information about cause of death. It may also be possible to populate certain fields on the death certificate with information from electronic health records, reducing the burden on respondents. These possibilities are being examined in an NCHS pilot study in Utah.
The National Death Index3 and the National Longitudinal Mortality Study4 also afford opportunities for linkage with other datasets like the Current Population Survey. Indian Health Service (IHS) records and the Census Bureau are also potential sources of data on the American Indian population. Anderson stated that “the reporting of American Indian race is very poor on the death certificate. It is about 30 percent underreported. So our death rates are way, way too low based on vital records data.” Linkages between mortality data and both IHS and census data are being created
_____________
3 See http://www.cdc.gov/nchs/ndi.htm for more information [November 2014].
4 See https://www.census.gov/did/www/nlms/ for more information [November 2014].
to improve the assessment of American Indian mortality, according to Anderson.
Counterfactual/Cause-Deleted Approaches
Presenters described various ways to conceptualize premature mortality using counterfactual methodology: years of life lost (YLL), life expectancy/ longevity, health loss, years lived with disability (YLD), and disability adjusted life years (DALY). One of the largest efforts using these methods is the World Health Organization’s Global Burden of Disease (GBD) Study, which applies this methodology to collaborative efforts to systematically understand the risks associated with premature death and health loss around the world.
Years of Life Lost
Christopher Murray, University of Washington, and Vos described YLL as a method of conceptualizing premature mortality.5 The reference life table chosen for GBD 2010 and beyond defines the ideal life expectancy at each age. The life table is based on the lowest mortality rates at each age observed in any country with a population over 5 million. The life expectancy at birth in this standard life table is 86 years. Vos noted that at any age, even above 100 years, some YLL accrue. This standard life expectancy was updated from a previous standard with life expectancy at birth of 80 for men and 82.5 for women.
Murray explained the counterfactuals examined using the GBD. For certain factors, like smoking or intimate partner violence, zero exposure is the ideal. However, for other factors, like blood pressure or body mass index (BMI), Murray and his colleagues identified the theoretical minimum risk distribution using population-based means. For example, they assumed a mean systolic blood pressure of 115 mmHg and a BMI of 21 kg/m2. Overall, for each risk factor, GBD researchers defined these “theoretical minimum risk exposure distributions” and used them in subsequent counterfactual analyses to determine the YLL attributable to each risk factor.
Jessica Ho, Duke University, described the use of cause-deleted methods as applied by the Panel on Understanding Cross-National Differences
_____________
5 Further information on YLL can be found at http://www.who.int/whosis/whostat2006YearsOfLifeLost.pdf [November 2013].
(National Research Council and Institute of Medicine, 2013). According to Ho, this approach allows researchers to estimate the contribution of specific causes of death to the U.S. disadvantage in YLL relative to comparison countries. Each analysis is performed separately by sex and for each country. The contribution of a specific cause (e.g., cardiovascular disease) to the U.S. disadvantage in YLL is based on the difference between the death rate for all causes and the counterfactual death rate without cardiovascular disease. This approach assumes that there are no interactions between causes, an assumption that is more applicable to causes at younger ages, according to Ho. An older person who dies of a particular cause, such as heart attack, may have died of another related cause (e.g., stroke) had they lived.
Other participants discussed some of the implications of using this approach to measure premature mortality. Steven Martin, Urban Institute, indicated that for people under age 50, YLL produces large numbers, which can make certain types of causes look like a greater proportion of the total relative to the overall number of deaths from that cause. In other words, the proportions of premature mortality attributed to different risk categories look different at different ages and limit the coherence of the overall picture. Preston noted that this is a disadvantage to considering premature mortality separately below and above age 50 as the two NRC studies had done. According to Preston, a key implication of the NRC report on divergent trends in longevity is the need to factor in the role of premature mortality before age 50 in the United States in any future analyses. He added that the present workshop offered a step toward blending the view of the two age groups.
Life Expectancy/Longevity
A similar method of conceptualizing premature mortality is longevity, or “the upside-down version of death,” according to Preston. Vos defined life expectancy as a “measure synthesizing mortality rates in a population by age into what a hypothetical birth cohort would live to on average if the same mortality rates would continue indefinitely into the future.” Health expectancy is a related concept, calculated as life expectancy minus the prevalence of all types of disability weighted by severity, as illustrated in Figure 2-1. Figure 2-1 also shows how DALY, described in a later section, relate to both life expectancy and health expectancy.
Haidong Wang, University of Washington, has also examined life expectancy in his work on geographic differences in life expectancy across
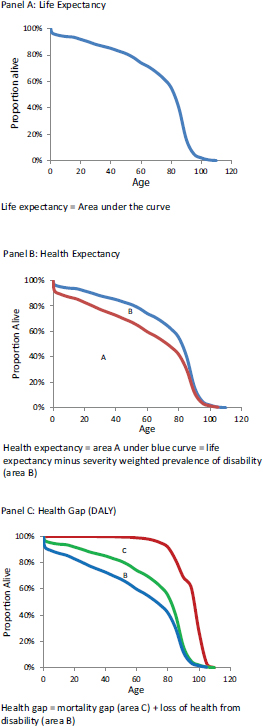
FIGURE 2-1 Life expectancy, health expectancy, and health gap.
SOURCE: Vos (2014).
the United States. He noted, “Life expectancy is . . . a good indicator because it summarizes all the age-specific mortality rates we observed in a given year. It is also not that good because it is a summary index, where we were not able to look at the age-specific change.”
Health Loss
Murray defined health loss as measured in DALY as the comparison of a population in a particular period against an ideal life expectancy in full health. Vos added that the focus is on health loss due to factors such as diseases and injuries and, therefore, does not include loss of general welfare outside the domain of health. DALY combine health loss due to death and due to nonfatal causes. Amount of health loss varies based on age (i.e., newborn, young adult, elderly), and data are examined by age, sex, geography, and timepoint. The GBD also enables researchers to compare health loss from a particular disability to health lost from death at any age.
Years Lived with Disability and Disability Adjusted Life Years
YLD are calculated by multiplying the prevalence of a given clinical health state by the health state weights estimated from public responses in various country surveys and an open-access Internet survey. These surveys present pairings of conditions with anchoring vignettes to respondents and ask them to indicate which of the pair they consider “the healthier.” Currently, the weights are calculated based on data from 60,000 respondents and more than 600,000 pair-wise comparisons. DALY are the simple addition of YLL and YLD.
Murray and others noted that the proportions of various risk factors associated with DALY are different than those associated with premature mortality. In particular, behavioral risk factors account for a smaller proportion of DALY than YLL. Murray explained that some of the differences are due to shifting from counting deaths to measuring years of life lost. Adding disability to that picture adds a number of conditions such as mental disorders, substance abuse, and musculoskeletal disorders, which are major causes of disabilities rather than deaths.
Vos described DALY in more detail. Currently, 220 health states have disability weights between zero and one assigned, where zero is optimal health and one is death. He noted that the same health state can be used for a number of diseases that lead to the same type of disability, such as hear-
ing loss. Eileen Crimmins, University of Southern California, said DALY present conceptual challenges and indicated her preference for YLD because this metric is easier for others to understand and is expressed in whole years. However, Vos noted YLD alone draw no distinction between disability and death, both of which are important for health policy decision making. Vos indicated that the DALY metric allows GBD researchers to be “comprehensive in the amount of health loss that we measure.”
Discussions among members of the workshop panel addressed the impact of using a unisex reference life table for the counterfactual analyses. According to Vos, the reference life tables for men and women in the earlier GBD version showed women having a life expectancy 2.5 years longer than men. However, Murray stated, “it is pretty hard to sustain the argument that in an optimized environment, there is much of a difference between men and women in potential life expectancy.” After controlling for risk taking by men in terms of exposing themselves to injuries and substance abuse, the difference is almost gone, according to Murray. The risks become increasingly equalized, others suggested.
METHODOLOGY USED IN MAJOR STUDIES OF PREMATURE MORTALITY
NRC Panel on Understanding Divergent Trends in Longevity in High-Income Countries
The NRC Panel on Understanding Divergent Trends in Longevity in High-Income Countries was charged with identifying trends in longevity and seeking to understand why the trends differ between the United States and other countries for individuals above age 50 (National Research Council, 2011). According to Preston, cochair of the study panel, “the U.S. started to fall short of other countries for men in the 1950s, for women in the 1980s,” adding that “at this point, the shortfall is very, very considerable.”
Preston described the methods used by the panel to determine why the United States had high mortality rates relative to nine other countries.6 The panel primarily used the counterfactual approach, which he described as “estimates of relative risk associated with a particular risk factor combined with a comparative distribution of exposures across populations.” Preston
_____________
6 Australia, Canada, Denmark, France, Italy, Japan, the Netherlands, Spain, and United Kingdom.
noted that this approach can involve either comparing U.S. exposure to a risk factor to zero exposure or to another country’s actual exposure. The NRC panel used the first option. In total, the NRC panel examined the following risks: health care system inequality, social integration and social interaction, smoking, obesity, physical activity, and hormone replacement therapy. However, Preston focused his workshop remarks primarily on the two most significant factors, smoking and obesity, and noted the limitations in focusing on physical activity.
Smoking
The NRC Panel on Understanding Divergent Trends in Longevity in High-Income Countries used lung cancer mortality as an indicator of smoking. According to Preston, 90 percent of male deaths and 85 percent of female deaths from lung cancer are attributable to smoking. Data on lung cancer deaths are readily available across countries over time and are well diagnosed and coded, whereas detailed and comparable data on smoking history (cigarettes smoked, years smoked, years since quit, age started smoking, etc.) over individuals’ lifetimes are generally not available. “You have available to you in lung cancer mortality an index that comprehends all of those different features of smoking,” Preston stated. Others have used a similar approach with virtually identical results (e.g., Peto et al., 1994), according to Preston.
The NRC study used the model to estimate deaths from smoking in 20 countries from 1950 to 2006, using data from the Human Mortality Database and the World Health Organization Mortality Database consisting of 10 billion person years of exposure and 300 million deaths. The model included death rates due to lung cancer and death from all other causes in 5-year age intervals by sex. This approach assumes that the lung cancer death rates in the absence of smoking are the same as those for nonsmokers in the American Cancer Society longitudinal study.
Obesity
Obesity is another single risk factor that has received a great deal of attention, although the populations of people who smoke and who are obese are largely independent of one another. The NRC study defined obesity as a BMI of 30 or above. Although there is significant controversy about the risk associated with BMIs between 30 and 35, a BMI over 35 is very dangerous, according to Preston. The United States compares unfavorably
to other nations in obesity, particularly at the higher BMIs. Preston cited several studies used to estimate the relative risk of premature mortality due to obesity (e.g., Mehta and Chang, 2009; Prospective Studies Collaborative, 2009). The NRC panel applied the same methodological approach to these data as those used in the Global Burden of Disease Study.
Preston noted that the findings about relative risk of premature death due to obesity vary based on the source of the data. The datasets are often biased toward underestimating the effect of obesity on mortality. One of the more significant biases occurs because people who are sick lose weight and move out of the high-risk BMI category, reducing the relative risk of those in the high BMI group. Based on his recent work, Preston said he believes that estimates showing higher risks due to obesity are more likely to be accurate. Despite the uncertainty of the risk estimate, obesity remains an important risk factor implicated in explaining a sizeable amount of the differences in life expectancy between the United States and other countries, he said.
Physical Activity
Preston noted the existing epidemiology on physical activity is inconclusive in part because of the challenges of accurately measuring how much people do. At the time of the NRC study, no reliable datasets were available to estimate the impact of physical activity on premature mortality. However, overall, the U.S. population appears to be highly variable with more almost completely sedentary individuals as well as more highly active adults than in other countries.
NRC/IOM Panel on Understanding Cross-National Differences
Ho described the data sources and approaches used in the NRC/IOM Panel on Understanding Cross-National Differences. This study made use of three primary datasets: the Human Mortality Database, World Health Organization (WHO) Mortality Database, and data from Statistics Canada. The panel used the Human Mortality Database for all-cause death rates and other life table information by age, sex, and country. The WHO database provided international data for 16 of the countries on cause of death by age and sex, and Statistics Canada provided similar but the most up-to-date data for Canada.
Ho described the two primary methods used in the Cross-National Differences study. The first, age decomposition, focused on the contribution of specific age groups to the gap in life expectancy at birth between
the United States and other countries. The study sought to identify how much of the gap in life expectancy was attributable to mortality differences below age 50 and how much was attributable to differences above age 50. The second method they applied was the use of cause-deleted life tables.
Global Burden of Disease
Christopher Murray described the risk factors included in the GBD. Overall, the GBD examines risk-outcome pairs, risks that are associated with a particular cause of death or disability.7 The GBD 2013 annual update covered 188 countries between 1990 and 2013, 323 diseases and injuries, 1,134 sequelae, and 72 risk factors. Relative risks vary from country to country based on differences in the underlying causes, according to Murray, which helps to explain the GBD approach. The most recent risks examined by the GBD emerged from the debate of a 28-member internal scientific council about which risk pairings are most important for health policy, have sufficient data to estimate exposure at the country level, and have sufficient evidence for “convincing or probable evidence”8 of causality and generalizability. The risks are identified through meta-analyses of published research on the topic, taking into account the certainty of the data. The GBD researchers identify effect sizes to estimate exposure, synthesize the data, and examine trends over time by age and sex. Murray and his colleagues also work to correct selection and other known systematic biases. “A classic example is if you think about the bias in self-reported exposure, weights and heights is an example. We don’t actually use self-report. We only use measured weights and heights. But that would be an example of a systematic bias that we would try to correct for,” stated Murray. Social risk factors, such as income, education inequality, or employment, were not included because they did not meet the criteria for inclusion at the specific risk-outcome pairing level, and they are often measured in variable ways across studies. These social risk factors are more often associated with all-cause mortality and disability rather than specific causes, explained Murray.
_____________
7 For more detailed information about the data sources and methods of the Global Burden of Disease Study, see http://www.healthdata.org/gbd and http://www.who.int/topics/global_burden_of_disease/en/ [December 2014].
8 Based on the World Cancer Research Funds’ criteria for what risk factors it included, the GBD used their criteria for convincing or probable evidence, which means evidence from trials or consistent evidence from cohort studies.
The most recent work on the GBD builds on previously published 2010 analyses (e.g., U.S. Burden of Disease Collaborators, 2013). This recent work will update the time series through 2013. The GBD includes over 1,080 collaborators from 106 countries, all of whom are governed by an extensive protocol that specifies methodology to be used and the inclusion of new diseases or risk-outcome pairs. This extensive standardization helps to maintain the quality of the data and analyses over time as individual investigators change. Geographic sensors and satellite imagery are also being added to generate exposure estimates. Overall, “the goal is for somebody to be able to trace each source of data through to the final result,” Murray explained.
Among the changes that affected the most recent GBD work are changes to international medical coding, new research, and expansion of subnational data collection. The International Classification of Diseases (ICD) used around the world shifted from ICD-9 to ICD-10, affecting certain ill-defined categories, such as injury, heart failure, and sepsis. Although WHO adopted the ICD-10 in 1990, the United States began using it to classify mortality data in the United States beginning in 1999 with implementation for clinical purposes occurring more recently (Centers for Disease Control and Prevention, 2014). Some problems with poorly defined codes have been addressed through estimation techniques. New analysis of epidemiological studies has also produced changes in risk estimates around Alzheimer’s disease. New work is beginning in selected countries, including China, Mexico, and the United Kingdom, to conduct assessments at the subnational level. Future work will include other countries as well, aided by improvements in computational power. Finally, between the 2013 and 2014 workshops on premature mortality, Murray and his colleagues examined change in life expectancy by groups of causes and shared findings from other member countries of the OECD.
For analyses conducted for the 2014 meeting, Murray and his colleagues examined all behavioral risk factors combined at their theoretical minimums. This analysis was designed to address the question, “what would the premature mortality in the U.S. look like if everybody was thin, nobody smoked . . . nobody used excess alcohol, had optimized their diet, were physically active, et cetera,” Murray explained. These theoretical minimums are the subject of debate as the science around them advances and what is seen as biologically possible changes, according to Murray. Crimmins noted that separating the aging process from the behavioral risk factors is a challenge for conditions like cardiovascular disease.
Three new risk factors included in the present GBD work are the effect of intimate partner violence on HIV, a new metabolic risk factor called low glomular filtration rates,9 and unsafe sexual practice. In addition, Murray and his colleagues made a change to the risk contribution of water and sanitation, which has the greatest impact on results from developing countries.
Considering the current set of risk factors, including the recent changes, they created a hierarchical model of risks shown in Box 2-1. They developed this model to estimate the joint distribution of behavioral, metabolic, environmental, and occupational risk factors. This work was prompted by discussion at the 2013 workshop. In addition, the modeling was an effort to address the overlap between these domains of risk that a typical ad hoc approach examining single risk factors at a time does not.
At the first level of the model, Murray explained that they estimated the joint distribution of all risk factors. The second level of the model addressed the joint distributions of all behavioral, all environmental and occupational together, and all metabolic risk factors. Statistical analyses at this level addressed the pathways of risk to outcome, including correlations between individuals and corrections to the pathway estimates based on the mediation of different risks through each other. This involves quantifying how much of one risk factor is mediated through another. For example, obesity is a risk factor that is mediated through other factors like blood pressure, cholesterol, and metabolic glucose levels. In this case, Murray explained, BMI, unadjusted, has a relative risk of 1.27, but correcting for cholesterol yields a relative risk of 1.24. Similar methods were applied to diet. Murray and his colleagues used empirical data for their estimates of these pathways whenever possible (e.g., Global Burden of Metabolic Risk Factors for Chronic Diseases Collaboration (BMI Mediated Effects), 2014).
The third level of this model estimates how much of the variance in years of life lost can be explained by 12 groupings of risk factors, followed by the fourth level, which includes each of 70 different risk factors. Murray stated, “We want to actually complete a Venn Diagram [illustrating the amount of overlap between behavioral, metabolic, environmental, and occupational risk factors] because a tremendous amount of metabolic risks are actually explained by the behavioral risks [with] less overlap on the environmental and occupational risks.”
_____________
9 Low glomular filtration rates have been linked to gout, heart disease, kidney disease, and stroke.
BOX 2-1
Hierarchical Models of Risk in the Global Burden of Disease Study
- Level 1: All risk factors joint TMRED adjusted for mediation of behavioral risks through metabolic risks.
- Level 2: Behavioral, environmental/occupational, and metabolic risks clusters.
- Level 3: 12 clusters of risk factors: Dietary risks, tobacco, air pollution, physical inactivity and low physical activity, other environmental risks, water and sanitation, occupational risks, unsafe sex, alcohol and drug use, child and maternal undernutrition, sexual abuse and violence, and physiological risks.
- Level 4: Full detail with all 70 risk factors (e.g., 15 components of diet).
NOTE: For each risk factor examined in the GBD project, the distribution of exposure was compared with an alternative (counterfactual) distribution termed TMRED, the theoretical-minimum-risk exposure distribution (see Lim et al., 2012).
SOURCE: Murray (2014).
Geographic Disparity and Life Expectancy in the United States
Haidong Wang described a study examining geographic disparities in life expectancies across the United States. He noted that although the country has seen improvement in life expectancy and healthy life expectancy for both men and women during the period 1990 to 2010, it has dropped significantly in international rankings of these measures. Wang noted understanding variation in life expectancy at birth within the United States itself is an important step in addition to understanding why it compares unfavorably with other developed nations. His study focused on U.S. disparities by county.
Wang used vital registration data and population estimates from the National Center for Health Statistics and the Census Bureau. Data from the more than 3,100 U.S. counties were grouped into 2,356 county clusters, which helped address statistical issues associated with small numbers of deaths in some areas. The study used time pooling, structured relationships
among socioeconomic covariates, and regression techniques to estimate county-level age-specific mortality rates.
Wang described additional and ongoing research that focuses on understanding the reasons for geographic heterogeneity in health and premature mortality. In particular, research has examined the impact of socioeconomic factors on these outcomes, as well as the ways in which outcomes vary by ethnicity and gender across the country. Current work focuses on determining the impact of a range of behavioral, metabolic, and physical and mental health risk factors on county variation. Wang and colleagues use risk factor data collected at various timepoints to identify risk factor trends by county and gender. The relative infrequency of vital events, small sample sizes at the county level, and cause-of-death coding errors all pose challenges to this research, according to Wang. Discussion centered on the extent to which examining these trends over time provides insight about potential underlying causes, historical patterns, and the extent to which exposures early in life affect later risk and mortality.
Sex, Race, and Geographic Differences in Mortality
Mark Cullen, Stanford University, described methodology and measures used to estimate survival to age 70 by county. Cullen and his colleagues selected survival to age 70 because “disparities are more apparent before the age of 70, and . . . when you look at economic disparities in the aging population, they begin to diminish.” The more than 3,000 counties in the United States were grouped to form 950 units to address data problems, including very small counties. Within each unit, data for whites and blacks were disaggregated and other ethnicities excluded. Overall, 22 predictor variables were examined, including 10 personal socioeconomic status (SES) factors and 12 environmental factors.10 Census data served as the major source for these factors. Cullen said the Behavioral Risk Factor Surveillance System of the Centers for Disease Control and Prevention was only a useful source of data for counties with a primarily white population.
_____________
10 Personal SES factors included low educational attainment, high educational attainment, high occupational attainment, income, poverty, wealth (property), homeownership, wealth (property) distribution, immigrant status, and living without a partner. Environmental factors included between race disparity in wealth, urban county, part urban, in the South, population growth rate, proportion of county that is black, black population in surrounding area, availability of fast food, quality of acute hospital care, cold climate, warm climate, and air pollution.
ISSUES IN THE MEASUREMENT OF PREMATURE MORTALITY AND RISK FACTORS
Individual participants at both workshops identified issues to consider regarding the measurement of premature mortality and associated risk factors, including (1) taking into account the interactions, factors, and clusters of risk; (2) acknowledging the dynamic nature of risk factor distributions; (3) taking into account the independence of risks; (4) determining whose behavior is being measured; (5) considering the impact of adherence to medication and health care; (6) framing analyses by birth cohort versus age linked; and (7) addressing coding inconsistencies. These issues are highlighted below.
Interactions, Factors, and Clusters of Risk
“Ultimately, the most important issue is clearly not the contribution of any one domain on our health prospects, but the way these domains intersect to affect each other and to affect the impact on individuals and society,” stated McGinnis. This means that health research and policy must address not only genetic and biomedical determinants of health, but also the behavioral, the social, and the environmental determinants, he argued, due in part to the fact that the biomedical aspects of health are inextricably intertwined with the other domain determinants.
Preston shared findings from a study that examined the underlying factors that lead to variation in population mortality (Tencza, Stokes, and Preston, 2014). This work used correlations among causes of death and revealed among other findings that behavioral factors are particularly important causes of early death among males. This factor analysis yielded three coherent behavioral factors, especially for males: smoking/obesity, drugs, and injury. In these analyses, the causes of death associated with smoking were found to be highly correlated with and in many cases not readily distinguished from causes of death associated with obesity (e.g., cerebrovascular disease and ischemic heart disease), yielding a single behavioral factor. The correlations of cause of death within those categories can help to elucidate the underlying factors behind causes of early death, Preston and others noted. Analyses also indicate that these clusters are not highly correlated with per capita income or poverty. Ho suggested that some of the intercorrelations might vary by age. For example, risky behaviors appear to cluster together more at younger ages. Miron Straf, NRC Divi-
sion of Behavioral and Social Sciences and Education (DBASSE), suggested examining various combinations of risk factors to determine how they might differ between the United States and other countries and help to explain underlying causes behind the proximal risk factors.
Dynamic Nature of Risk Factor Distributions
Participants discussed a number of other issues that affect the measurement of premature mortality. John Haaga, National Institute on Aging, noted that risk factor distributions are dynamic rather than constant, citing the decline in deaths from heart disease and stroke occurring at a faster rate than the decline in associated risk factors. Murray said these relationships can be due to treatment but also to factors and relationships that have yet to be identified. For example, research may continue to reveal a greater relationship between infectious diseases and chronic diseases, he explained.
Further, changing risk exposures in childhood may not yet have revealed their impact in a population. Murray added that he and his colleagues are developing 25-year forecasts of premature mortality and disability, with a focus on removing all possible risk factors, and then separately modeling various scenarios or trends with each risk, and examining potential trends for various conditions. Haaga and Crimmins noted that work to determine the nature of risk factors associated with trends in Alzheimer’s disease is also focused on identifying underlying and modifiable risks that affect outcomes.
Independence of Risks
Another methodological issue in the measurement of joint distribution of risks is that the modeling assumes independence of the individual risks out of necessity. The models do not take into account the correlations between various risk factors; however, the models do include steps to avoid double-counting. Despite these methodological limitations, Preston shared his views that the assumptions of the model and statistical methodology employed were common in the literature and very defensible. Majid Ezzati, Imperial College, indicated that certain conditions, such as cirrhosis, are not subject to multiple interrelated risk factors, eliminating concerns around independence. For cardiovascular causes of death, joint distributions of risk attributable to behaviors such as smoking, diet, and physical activity at times explain a large proportion of the difference between populations with
high versus low cardiovascular disease rates. Ezzati reached the conclusion that when this happens, the techniques Murray was employing were robust. Murray and Ezzati indicated adding risk factors to the models’ approaches explaining up to 100 percent of the occurrence of a given cause of death, with the marginal error becoming smaller and smaller.
Determining Whose Behavior Is Being Measured
Participants considered key behavioral risk factors for causes of premature death; however in some cases, determining whose behavior constitutes a risk is an issue. For example, for causes of death, such as homicide, medical errors, and auto fatalities, other people’s behaviors besides the decedent’s are responsible for the risk. Robert Hauser, DBASSE, suggested the group be specific when referring to behavioral risk factors.
Impact of Adherence to Medication and Health Care
Another behavioral risk factor receiving recent attention, according to Richard Suzman, is adherence to medication regimens. This behavior is not currently quantified or included in any GBD models. However, Murray and others noted that measuring this would be challenging for several reasons. First, identifying people who are receiving treatment but not reaching treatment goals could either reveal a nonadherence issue or an inappropriate prescription. Alternatively, Crimmins said even those with an appropriate prescription and adherence could result in varying distributions, much of which would be based on behaviors including education and quality of communication by health care providers. Several participants indicated there may be health outcomes that appear to be explained by metabolic factors, but which in fact are explained to a greater extent than previously thought by behaviors.
Cullen indicated that health care itself is an important factor to examine, and that a number of natural experiments exist to help determine the impact of access and quality on life expectancy. He and others stated this is a major policy question that may help explain previously unattributed portions of outcomes. However, Crimmins cautioned that misattribution is a significant potential problem because “we don’t know whether it’s really education or it’s early childhood physicians or a whole set of things. Everything changes together over time.”
Birth Cohort Versus Age Linked
Haaga noted recent NRC studies showed the age group at which Americans’ mortality rates compare favorably to those of other developed nations has been rising over time. Currently, that age is 75. However, he argued an alternative way to frame this issue is to indicate the birth cohort before which Americans compared favorably, after which they increasingly compare unfavorably. This may be more explanatory than indicating an age at which Americans “suddenly start to look good.” Ho shared research indicating U.S. mortality rates by birth cohort going back as far as 1850 compare favorably between the ages of 65 and 80; however, the most recent cohorts fare far worse at young ages with the exception of those born at the end of and shortly after World War II, which may be indicative of conditions in Europe at the time.
Coding Inconsistencies
Murray highlighted two important issues in working with cause-of-death data: (1) variation in the use of ICD codes across countries, and (2) the use of codes for certain health care encounters that do not constitute a cause of death but end up being assigned as such. Murray and colleagues address these coding challenges using various probabilistic and statistical techniques. Issues with coding have the potential to have a significant impact on analyses. Wang noted that within the United States, inconsistent coding across states or counties can be a particular problem. He shared data indicating that correcting the cause-of-death assignment is necessary in 15 to 32 percent of cases depending upon the state.
Various sources of data and approaches to studying premature mortality exist. Presenters described the ways in which premature mortality has been conceptualized, and the data sources that they have used to gather data on causes of death and risk factors. They also described the methodology used in major studies of this topic, highlighting the implications of their approaches, as well as key methodological issues to be addressed in future efforts. Ultimately, understanding these approaches is critical for making sense of the results of the major studies presented in Chapter 3.


