
5
Question Design and Survey Implementation
The design of the questionnaire and the manner in which the Nonprofit Research and Development (R&D) Survey is implemented by the National Center for Science and Engineering Statistics (NCSES) of the National Science Foundation (NSF) are important. As discussed in the next session of the workshop, they can affect response rate and ultimately the usability of the data that NCSES collects. As Donald Dillman, Washington State University and workshop steering committee member shared, the science of survey design has been advancing rapidly, yielding evidence-based approaches that can inform the survey planning stage. In addition to considering issues around measurement, participants also discussed the potential outputs of the survey, including the data needed for the National Patterns of R&D Resources (National Science Foundation, n.d.-a), as well as other potential ways to expand the use of the data by stakeholders.
DESIGNING QUESTIONS FOR THE NSF NONPROFIT R&D SURVEY
The workshop featured several presentations addressing questionnaire design for the NSF Nonprofit R&D Survey. The first of these presentations featured a series of experiments focused on how instructions, clarifications and question structure affect survey responses. The second presentation focused on initial results from NSF’s ongoing exploratory interviews with nonprofit organizations. As reported at the end of this
chapter, participants then engaged in a discussion around a proposed approach to screening nonprofit organizations for inclusion in the survey population.
Understanding How Instructions and Clarifications Affect Survey Responses
The discussions held during this workshop have made clear that there are complex concepts involved in what the NSF Nonprofit R&D Survey should measure. Much discussion took place about which organizations should be included in the population of nonprofits and eligible for sampling on the survey. An equally important concept has been the definition of R&D, and which of the innovations that are taking place within nonprofits should be considered R&D for the purposes of this survey. NSF has been challenged to clarify its position on these concepts. This section of Chapter 5 addresses the next step—once NSF clarifies the definition of R&D, how can it most effectively explain to potential respondents what they should report? As a benchmark, Box 5-1 shows how these concepts were communicated to respondents on NSF’s 1996–1997 Survey of Nonprofit R&D (National Science Foundation, n.d.-c). The definitions were placed at the beginning of the questionnaire, and respondents were asked to follow these guidelines in answering the survey questions.
The instructions, definitions, interventions, and examples that questionnaires and interviewers provide, and the placement of such items within a questionnaire, can have an important effect on how respondents answer the questions they are asked, explained Cleo Redline of the National Center for Education Statistics. Redline presented an overview of research in the area of providing definitions and clarification to respondents, including specific work that she has conducted in this area. (Conrad et al., 2006; Conrad, Schober, and Coiner, 2007; Couper, 2008; Redline, 2013; Schober and Conrad, 1997)
Redline pointed to previous research, which shows that allowing interviewers to provide definitions can improve respondents’ understanding of researchers’ intentions. However, she noted, several factors affect the use of these definitions:
- First, respondents have a tendency to anticipate the end of a question, making them more likely to interrupt any clarifying information that is provided at the end. This suggests that providing clarification at the beginning of a question to minimize interruptions will yield higher quality data; however, research on this phenomenon has been mixed (Houtkoop-Steenstra, 2002; Oksenberg, Cannell, and Kalton, 1991; Van der Zouwen and Dijkstra, 2002).
BOX 5-1
Definitions Provided on 1996–1997 Survey of Nonprofit R&D
General Instructions
About this survey
1. Definition of Research and Development
Research is systematic study directed toward fuller knowledge or understanding of the subject studied. Research is classified as either basic or applied, according to the objectives of the investigator.
Development is systematic use of the knowledge or understanding gained from research, directed toward the production of useful materials, devices, systems, or methods, including design and development of prototypes and processes.
Research and development includes the development and use of scientific knowledge through fundamental research in the laboratory, in the field, or through experiments; clinical investigations; clinical trials; epidemiological, engineering, and demographic studies; and controlled pilot projects. Included in this definition is the preparation for publication of books and papers describing the results of the specific research and development, if carried out as an integral part of that research and development. Also included is the administration of research and development. Traineeships, if they are mainly directed to R&D, are also included.
2. Science and Engineering
For this survey, science and engineering (S&E) includes
- Medical or Health-Related Sciences, including Biochemistry, Genetics, Physiology, Cell Biology/Molecular Biology, Pharmacology/Toxicology, Epidemiology, Health Care Sciences and Services, Reproduction, Growth and Development, Oncology/Pathology/Hematology, Immunology, Microbiology/ Virology, Biomedical Engineering and Instrumentation, Neuroscience, Clinical Medicine, and other medical or health sciences.
- Natural and Social Sciences, including Agricultural Sciences, Biological Sciences (non-medical), Computer Sciences, Environmental Sciences, Mathematical Sciences, Physical Sciences, Psychology, and Social Sciences.
- Engineering, including Aeronautical and Astronautical, Chemical, Civil, Electrical, Mechanical, Metallurgical and Materials, and other engineering fields.
Science and engineering do not include law, business administration/management science, humanities, history (except research in history and philosophy of science and technology), the arts, or education (except educational psychology).
SOURCE: National Science Foundation/National Center for Science and Engineering Statistics Survey of Research and Development Funding and Performance by Nonprofit Organizations, 1996–1997. Available: http://www.nsf.gov/statistics/questionnaires.cfm#14 [February 2015].
- Second, eye movement research indicates that respondents spend more time looking at the beginning of a question than at the end, but there has been little to no research on whether the phenomenon of skipping over clarification provided at the end of a question occurs when the information is visual rather than auditory (Graesser et al., 2006).
- Third, when a definition or clarification is long and complex, a respondent’s working memory is taxed in ways that lead to forgetting key elements or ignoring the definition altogether. A preferable approach is asking a series of questions rather than asking one question with a lengthy clarification. “Decomposition is one strategy in which the subcategories of a behavioral frequency report are requested in these individual questions, and decomposing a general category into a set of subcategories is also a technique for conveying a definition and for promoting clarity,” stated Redline (Belli et al., 2000; Conrad and Couper, 2004; Conrad and Schober, 2000; Dykema and Schaeffer, 2000; Fowler, 1995; Schaeffer and Presser, 2003; Tourangeau, Rips, and Rasinski, 2000).
Redline further explored the concept of decomposition. She described a web survey experiment that she conducted to examine whether decomposing categories into subcategories and presenting the subcategories as instructions would affect how respondents interpreted the general category. She also tested whether placing the instructions before the question was better than placing them after the question, and whether transforming the instruction into a series of questions yielded answers more consistent with the research objectives than asking one question with instructions.
To test her hypotheses, Redline developed eight questions patterned after particular questions from federal surveys, such as number of residents in the household or the number of shoes that respondents owned. The categories within these general questions were then decomposed.
In this example, Redline asked a survey respondent how many shoes he or she owned. The intention was to exclude certain common types of shoes from this total. She added instructions to the questionnaire to exclude explicitly certain ineligible types of footwear—such as boots, sneakers, athletic shoes, and bedroom slippers—that people might own and report in error. In other words, people were likely to own these types of shoes, and unless instructed otherwise, would likely report these as part of the total.
Redline tested three main conditions:
- no instruction;
- single instruction to exclude certain types of shoes, with the instruction occurring either before or after the question;
- a series of questions, each asking specifically about a different type of shoe that would be excluded from the total.
An embedded factorial design allowed for testing the effects of placing the instructions at the beginning and at the end of the question. The conditions and questions are shown in Box 5-2. These experiments were included as part of an existing national survey. The cumulative response rate was 38.8 percent.
Redline hypothesized that the mean number of shoes for the control condition (no instructions) would be higher than the mean for the instruction condition, which would in turn be higher than the mean for the multiple-question condition. Results across seven of the eight questions, including number of shoes owned, followed this predicted pattern. An examination of the average percent reduction in numbers reported across questions indicates a 20 percent reduction between no instructions and instructions, and a 33 percent reduction between no instructions and multiple questions.
Redline next focused on the comparisons she made within the instructions condition. She compared the effects of the placement of the instructions, hypothesizing that respondents would report higher numbers when the instructions were placed after the question than when placed before. She identified a significant main effect for position in support of her hypothesis.
Redline explained that she used the follow-up questions she created to determine respondent consistency with researcher intentions: that is, whether respondents excluded the subcategories that they were asked to exclude in the previous questions. Scores of “0” in each subcategory were consistent with following the instructions provided. Results indicated that respondents reported consistent information about the number of shoes they own approximately half of the time with instructions. The position of the instructions had no effect on these findings.
Respondents took more time to answer the multiple-question format than the instructions condition, which took significantly more time than the no-instructions condition. In addition, across all eight questions, respondents took significantly more time to respond when instructions were placed before the question than when they were placed after the question.
Redline identified three main conclusions from her work:
- Respondents provided lower responses in the presence of instructions designed to lower their answers, suggesting that if a survey’s definitions differ from respondents’ definitions, then surveys do need to clarify that difference.
- The position of instructions matters, that is, respondents seemed to adhere to instructions more often when they appeared before a question than when they appeared after the question.
- Asking multiple questions is more effective than providing clarifying instructions. (In Redline’s view, this structure forces respondents to pay even more attention to the subcategories, it requires
BOX 5-2
Redline Decomposition Test: Conditions and Questions
Condition: No Instructions
The next question is about your footwear.
How many pairs of shoes do you own?
Number of pairs of shoes:_____
Condition: Instructions After Question
The next question is about your footwear.
How many pairs of shoes do you own?
For the purposes of this question, do not include boots, sneakers, athletic shoes, or bedroom slippers. Include sandals, other casual shoes, and dress shoes. If you do not own a pair of shoes (as we have defined them), enter “0.”
Number of pairs of shoes:_______
Condition: Instructions Before Question
The next question is about your footwear.
How many pairs of shoes do you own?
For the purposes of this question, do not include boots, sneakers, athletic shoes, or bedroom slippers. Include sandals, other casual shoes, and dress shoes. If you do not own a pair of shoes (as we have defined them), enter “0.”
Number of pairs of shoes:_______
them to keep less information in memory, and they do not need to do any mental arithmetic with the information when it is broken down into subcategories.)
Redline added that the measurement errors seem to vary depending on the conditions. With instructions, the errors occur depending on whether respondents actually read the instructions, but in the multiple-question format, errors vary because the potential increased ability of respondents to recall the information needed. The multiple-question format also took more time, which is an important tradeoff to consider, Redline suggested. Future work could help to determine whether similar
“Multiple Questions”
The next question is about your footwear.
How many pairs of shoes do you own?
Number of pairs of shoes:_________
When you reported the pairs of shoes that you own, how many pairs of boots, sneakers, athletic shoes, or bedroom slippers, if any, were included?
Number of pairs of shoes:_______
When you reported the pairs of shoes that you own, how many pairs of sandals, other casual shoes, or dress shoes, if any were included?
Number of pairs of shoes:_________
“Follow Up Questions”
|
Number of pairs: |
________ |
|
When you reported the shoes that you own, how many were |
|
|
Boots? |
________ |
|
Sneakers or athletic shoes? |
________ |
|
Bedroom slippers? |
________ |
|
Sandals? |
________ |
|
Other casual shoes? |
________ |
|
Dress shoes? |
________ |
SOURCE: Adapted from Redline (2013).
results occur with commonly counted categories as well as commonly omitted categories.
Workshop Discussion on Question Design
Salamon sought clarification on Redline’s presentation concerning whether the effects of instructions, clarifications, and using multiple questions are equal with both exclusions and inclusions. “Is it likely that the effects are stronger when you are starting with a concept that you don’t understand. . . . It may be that the use of prompts…is even more powerful in that situation than for the data that you presented,” he said. Redline indicated the process of understanding what a concept means may be different from measuring a count of a known concept, like number of shoes owned. However, she added that the question about inclusions and exclusions remains unanswered in the research. Salamon shared research that indicates that the more prompts a respondent receives, the more positive answers he or she will ultimately give.
Paul David suggested that, based on his experience, allowing respondents to go back to previous questions might allow them to recalibrate their understanding about the purpose of the survey and to provide better information. Redline indicated she prevented this in her work simply because she was attempting to control the number of variables in her experiment.
Additional discussion centered on whether reading through a questionnaire might prompt individuals to drop out of the survey because it looks long and complex. However, Redline indicated that individuals often do not read through the questionnaire even when instructed to do so.
Results from Exploratory Interviews with Nonprofits
Ronda Britt, NCSES, shared the results of the first wave of exploratory interviews that NSF and their contractor, ICF International, are conducting with research-performing nonprofit organizations. Overall, 20 exploratory interviews are planned in different locations around the United States. To date, four of those interviews have been completed. “By research-performing, I mean they have to have done something that we would consider research, even if they didn’t call it research,” Britt explained.
The selected 20 nonprofit organizations will be of various sizes and focus on a range of topics, including social sciences and the humanities, policy, education and economic research organizations, and others that may not regularly use the terms R&D. In June and July 2014, staff plans
to visit four major cities—Atlanta, Boston, San Antonio, and Seattle. Britt explained San Antonio has several major research centers that would likely be selected in a comprehensive sample of R&D performers. In addition, the four cities are from geographically diverse areas of the country. Robyn Stone cautioned that emphasizing research institutes would not be representative of the nonprofit sector, in part because many of them resemble for-profit organizations in many ways. She strongly suggested that NSF also capture nonprofits “that do service delivery and are mission driven.”
The interviews in San Antonio were completed just prior to the workshop. There were four interviews conducted with two large research institutes and two smaller organizations with limited research activities. One planned exploratory interview with a smaller organization was canceled. Britt focused the remainder of her remarks on these recent interviews, which addressed the nine major topics shown in Box 5-3.
Britt reported that each organization that staff visited had a different operating model. Furthermore, they each used different language to describe their activities, employees, and project terminology. Even the
BOX 5-3
Preliminary Interview Topics from the National Science Foundation Exploratory Interviews
- Defining research and development (R&D)—how organization describes its activities, other terms for R&D, examples of projects
- Funding R&D activities outside the organization—types of recipients and projects
- R&D activities within the organization—funding sources and types of projects
- Joint projects with other organizations
- Recordkeeping on R&D activities:
- Can the R&D projects be tracked separately from other spending?
- Do they know how many employees are involved in R&D projects?
- Can R&D be tracked by funding source and/or field?
- Would national data on R&D within nonprofit organizatoins be useful to them?
- Who are peer organizations, and what information would be helpful to know about them?
- Who should the survey be sent to and how (email/web or mail)?
- How likely are you to respond to a survey from NSF?
SOURCE: Britt (2014).
two large research institutes differed from one another in these ways. All four organizations expressed interest in participating in a survey to measure R&D in the nonprofit sector and agreed to be interviewed to help in its development. However, one individual from a smaller organization admitted that he would probably not complete the NSF survey if he received it because his time was limited and the topic was not particularly salient to his work.
The exploratory interviews shed light on the types of research activities and projects in which the organizations were involved. Examples included functional magnetic resonance imaging consciousness research and other brain research; genetics research; longitudinal family studies; vaccine development; and fuel and emissions technology. One of the smaller organizations was engaged in evaluating the outcomes of a curriculum targeting the problem of youth obesity and diabetes. It included photographing lunch trays before and after meals to determine what children were actually eating. This work has been “published in peer-reviewed journals, so there was definitely research going on there,” explained Britt.
Box 5-4 brings together the various terms for R&D that nonprofit organizations reported using, both in this workshop and during the exploratory interviews that NSF has conducted. During the exploratory interviews, some interviewees were unsure whether their research activities would be included in a survey of R&D, if they considered their work only research or only development. The terms “research, development, testing, and evaluation” appeared to be used more in a U.S. Department of Defense context, and it includes more elements than NSF is interested in for the present survey, according to Britt.
The majority of activities that the four organizations reported were funded through grants and contracts from the U.S. government or from industry. A much smaller proportion of the work was funded internally. One organization funded small research awards to university researchers using endowment income, with the number of grants awarded based on the performance of the endowment fund. This particular organization “prided themselves on identifying the ‘up-and-coming’ principal investigators at a university that would not be getting mainstream funding, because they’re kind of on the edge of this translational neuroscience. That was their mission…to put some seed funding out there to help these projects get started,” Britt shared. Two of the organizations interviewed routinely conduct joint projects with universities or other nonprofit organizations doing similar work, using subcontracts and funding moving in both directions between the entities.
Three of the organizations operated fiscally on a calendar year, while the fourth organization was on a federal fiscal year. One of the four
BOX 5-4
Terms Used by Nonprofits to Describe Research and Development Activities
During the exploratory interviews conducted by the National Science Foundation:
Translational neuroscience
Basic research
Research OR development—not R&D
Science
Feed and bleed—drug testing on animals
RDT&E—research, development, testing, and evaluation
Problem solving
Curriculum development
Evaluation
During this workshop:
Research
Data-driven design
Program evaluation
Data mining
Evidence-based data
Experimenting
Citizen science
Testing
Translational research
Evidence-based practices
organizations indicated that it could easily separate the spending on R&D from all other activities, including salaries. Another organization indicated that it would likely report its entire operating expenses as R&D, despite other activities not considered pure R&D because “it would just be hard for them to break out the R&D. And, because their mission was research, they felt justified in including all of the operating budget as research,” Britt reported. The smaller organizations indicated that they could determine the proportion of funds spent on R&D if asked even though they did not track these activities because their total amount of such activities was small. All of the organizations could report their total expenditures by the source of the funding; however, separating research from total expenditures would be more difficult. In addition, interviewees said that they could likely assign their work to a scientific field, but also indicated that the traditional fields that might be well suited to a university department were not always appropriate. Britt suggested that an open-ended category could allow nonprofit organizations to identify the
fields themselves. All four organizations were able to provide the number of personnel involved in research and with what projects they were associated. However, providing this information in terms of full-time equivalent was more challenging.
Michael Larsen asked whether administrative and overhead costs, such as utility costs, would be captured by the NSF survey, given that these costs are necessary for conducting research. Britt clarified that they asked nonprofit organizations for research and related indirect costs. She added that including these costs is consistent with their other surveys. Michael Crosby noted that it could be useful to also capture the name of the agency with which the organization negotiated its indirect rate. He also asked for clarification about whether NSF was capturing external philanthropy as a source of funding in addition to contracts, grants, and internal funding. Britt indicated that NSF was interested in understanding the variability and which organizations had extensive records. She added that the interviewers do ask about external philanthropic funding, but it was not a predominant source of funding for the four organizations interviewed in San Antonio.
The four nonprofits all indicated that they would find data on the nonprofit sector helpful to them. They most often identified universities or university departments that were engaged in similar work as their peers, and only a few could identify small numbers of nonprofits doing similar work. When asked what other types of data would be helpful to them, one interviewee indicated that presenting the data by tax-exempt status and field of research would be helpful. This individual wanted to learn whether other nonprofit organizations faced similar restrictions on annual funding of research. Identifying other nonprofits doing work in the same field would help the organization make budgetary decisions and determine whether they were duplicating any efforts. Others indicated that data on revenue and number of employees to identify similar-sized organizations would be helpful, as would knowing recovered indirect cost allocation, although this information is unlikely to be made publicly available, Britt noted. The interviews indicated that organizations would be interested in knowing the geographic location of peer organizations because location can impact costs, salary ranges for research personnel, and other “side-business” incomes. Crosby also indicated that his nonprofit organization publishes a list of peer organizations, adding it is a source that NSF may consider using to identify other research-performing nonprofits.
Another purpose of the exploratory interviews was to explore finding the correct respondents for the NSF nonprofit survey. Of the three interviewees who indicated that they were likely to complete the survey if they received it, all indicated that they would review it and filter it to
the correct respondent. Britt added, “In all cases I believe we were talking to the person that would end up filling the survey out. And these people were generally either the president, . . . CEO, or a vice president for research, depending on the size of the organization.” Most preferred to receive an initial mailing rather than only receiving an email because the email was likely to get lost or be filtered out as “spam.” Receiving an envelope addressed from the National Science Foundation would serve as a visual cue and elevate the survey’s importance, Britt conveyed. The three organizations on calendar year fiscal years would need to receive the survey in late spring or early summer after their books have been closed for the previous year. This timing is consistent with the planning for upcoming pilot study, according to Britt.
Britt concluded her remarks with some additional timetable information. She indicated that the next exploratory interviews in Atlanta, Boston, and Seattle would be completed by the end of July 2014. The information gathered in the exploratory interviews will be presented in a report and then used to draft a questionnaire. The process of conducting cognitive testing, drafting the questionnaire, and obtaining clearance from the Office of Management and Budget must be completed before pilot testing can begin in summer 2015.
Discussion of Potential Approaches to Screening
Carol House, NRC, led a discussion about a proposed approach to screening potential respondents to the NSF Nonprofit R&D Survey. She began by presenting the instructions included with the 1997 nonprofit survey, adding that “they’re very complex instructions, and then they ask the respondent to use that definition when answering the remainder of the questionnaire.” As shown above in Box 5-1, these instructions define research, development, and science and engineering. The two survey questions that follow these instructions are presented in Box 5-5. House suggested that this approach “from everything we’ve heard, is set up to screen organizations out, particularly those organizations with activities in the kind of gray area of R&D that we have discussed in this workshop. It is unlikely that these organizations will see themselves in these definitions.”
A different approach would involving asking multiple questions rather than a single question, and may be a preferable approach to consider, stated House. This approach was suggested by Larsen and Salamon during discussions at this workshop, and it is consistent with Redline’s findings about decomposition, she added. Shown in Box 5-6, House presented a strawman version of such a multiple-question approach to screening for R&D. She generally used the format and terms that Britt
BOX 5-5
Screening Questions on the 1996 National Science Foundation Survey of Nonprofit Research and Development
1. Your Organization
Is your organization a nonprofit organization? (By nonprofit, we mean an organization classified as 501(c) by the Internal Revenue Service, filing a 990 or a 990-PF tax return form.)
___ Yes ___ No
2. Research Performance
In 1996, did your organization conduct any research or development in the science, engineering, or technology fields? Science, engineering, and technology fields include
| Social Sciences | Psychology | Medical and Health Sciences |
| Biological Sciences | Engineering | Physical Sciences |
| Environmental Sciences | Mathematical Sciences | Computer Sciences |
| Agricultural Sciences | ||
| ___ Yes (Continue with 2a) ___ No (Skip to Q.# 3) | ||
2a. Approximately how much research or development in the science, engineering, or technology fields did your organization conduct in fiscal year 1996? (Consider total costs, including both direct and indirect costs in both internally and externally funded research or development.)
| ___ Less than $50,000 | ___ $50,000-$249,999 | ___ $250,000- $999,999 |
| ___ $1,000,000-$4,999,999 | ___ $5,000,000-$24,999,999 | ___ $25 million or more |
SOURCE: NSF/NCSES Survey of Research and Development Funding and Performance by Nonprofit Organizations, 1996–1997. Available: http://www.nsf.gov/statistics/questionnaires.cfm#14 [February 2015]. The entire questionnaire can be found at this same link.
identified through the exploratory interviews along with other potential terms.
House explained her rationale for including several of the screening questions. First, she included the screening item about “developing new approaches to social service delivery and evaluating their outcomes” because this language arose from her conversations with individuals from several nonprofits prior to the workshop. House emphasized that identifying and using the terms to which various nonprofits might respond, as those shown in Box 5-4, and including these phrases in a multi-question
BOX 5-6
Strawman Proposal for Multiple-Question Screener
Has the staff at <nonprofit name> done any of the following?
- Conducted work that might lead to a patent?
- Produced findings that are published in academic journals or presented at conferences?
- Developed new approaches to social service delivery and formally evaluated the results?
- Created new solutions that can be generalized to other situations?
- Conducted work to discover previously unknown facts, structures, or relationships?
- Conducted work to extend the understanding of facts, relationships, or principles in ways that could be useful to others?
- Conducted research and development in the area of medical or health-related sciences, such as biochemistry, genetics, reproduction, and clinical medicine?
- Conducted research and development in the area of natural sciences, such as agricultural science, environmental science, and physical sciences?
- Conducted research and development in the area of social science, such as psychology and social science?
- Conducted research and development in the area of engineering, such as chemical, civil, metallurgical, and other engineering fields?
Using a web-based instrument, the key terms (research, development, medical or health-related sciences, natural sciences, social science, engineering) can be hot-linked to a definition.
SOURCE: House (2014).
approach to screening, may provide a way of screening organizations with less traditional forms of R&D in rather than out. Such an approach might still require including some of the previously used questions as “catch-all,” House added. House also suggested that a web-based survey could include hotlinks that provide definitions for key terms.
After being screened in, organizations could be asked to think about the activities they identified in the screening process, stating that the activities would subsequently be referred to as R&D activities. House stressed that this approach and the specific screening components to include, remain untested, but could be productive for the group to consider and for NSF to experiment with.
IMPLEMENTATION OF THE NSF NONPROFIT R&D SURVEY
Several presentations at the workshop addressed methods for implementing the survey, considering the unique nature of the nonprofit sector. Together, these presentations focused on concrete steps that NSF can take, particularly during the planning stage, to obtain a response rate that minimizes selection bias and other errors and makes the most efficient use of limited resources.
Guidance from a Successful 1999 Survey of Nonprofits
Jeffrey Berry, professor of political science at Tufts University, presented his experiences successfully conducting a large-scale random sample survey of 501(c)(3) Form 990 filers using data files prepared by the National Center for Charitable Statistics at the Urban Institute. This work led to the publication of two books: A Voice for Nonprofits (Berry, 2003b), providing information gathered from the survey, and Surveying Nonprofits: A Methods Handbook (Berry, 2003a), a methodology handbook specific to conducting surveys of nonprofits using Form 990. Berry noted that the methodology handbook focuses primarily on the mechanics of conducting this type of survey rather than on methodological theory.
Berry explained the purpose of his 1999 survey of the nonprofit sector: “We heard from an advisory panel of nonprofit leaders . . . that a 501(c) (3) designation inhibited their ability to represent their clients before government. The organizations were mostly social service providers, and their clients were people who are poor or disadvantaged, marginal, had health care problems, and so on. The reason for the constraint is that section 501(c)(3) of the tax law says that public charities can lobby, but they cannot do it substantially, and the IRS refuses to define exactly what substantial means.” In addition, other filing options regarding lobbying under the law are contradictory and confusing, noted Berry. Ultimately, the nonprofit leaders came to believe that they could not lobby at all. Berry’s survey focused on understanding the impact of these beliefs and found that ignorance of the laws and the ambiguity of the laws about representing clients before the government had a profound effect to the detriment of individuals who do not typically organize themselves and have little or no discretionary income.
During the planning phase of the survey, Berry and his colleagues identified previous survey research focused on the nonprofit sector and determined that low overall response rate was a significant limitation. For example, one study of 5,000 nonprofits had only a 17 percent response rate, raising concern about selection bias. Thus, Berry focused specific attention on improving response rate for the survey he planned, using methods published by Donald Dillman as the Total Design Method (Dillman, 1978).
BOX 5-7
Schedule of Mailings—1999 Survey of Nonprofits Conducted by Jeffrey Berry
- Week One: Initial mailing of survey
- Week Two: Postcard reminder
- Week Four: Replacement surveys for bad addresses
- Week Five: Second mailing to all nonrespondents
- Week Nine: Third mailing by certified mail to all nonrespondents
SOURCE: Berry (2014).
Berry said sampling issues were an initial challenge in planning the survey. They sampled four different sets of organizations, oversampling three of them, and ultimately achieved a response rate of 64 percent, which is “about as good as you’re going to get, I think, in the nonprofit world,” according to Berry. This response rate was primarily attributable to three factors, which he identified as persistence, “grunt work,” and hiring sufficient labor needed to do this work.
Berry stated the survey was mailed to respondents, noting that a greater number of feasible options, including web surveys, exist today. Box 5-7 shows how the initial mailing and three follow-up mailings were scheduled to increase response rate. Berry noted that 12 percent of the total overall sample, and 22 to 23 percent of the sample that had not responded to one of the three previous mailings, responded after receiving certified mail. “So, you can do things that juice up the return rate; you just have to make a commitment to doing that,” Berry stated. He added additional techniques have been developed to accomplish this goal since 1999, as well. Other subsequent surveys he has conducted have also made use of email prompts.
In addition to persistent follow-up with respondents, Berry indicated that substantial work is needed to gather accurate contact information for respondents. Because the data files contained records that were 2 years old, staff had to locate updated addresses, phone numbers, and, in some cases, names for the organizations themselves. This required extensive phone calls to validate the information and to avoid having a sample with many invalid addresses. When the survey was fielded, of the thousands of organizations, only 150 were returned because of bad addresses, indicating that Berry and his colleagues had achieved a high degree of validation prior to implementing the survey. Berry also stressed, “You don’t want to mail just to ‘Executive Director.’ You want the name of that person.”
The effort to obtain the name of the desired respondent, email address, and other valid contact information requires work and can be expensive; however, it is necessary to achieve a high response rate.
Strategies for Improving Survey Response Rates
Berry described his 1999 survey of nonprofits, which he implemented following Dillman’s Total Design Method (Dillman, 1978). Because much has changed in the world of survey research since his method was first developed, Dillman, Regents Professor of Sociology at Washington State University, updated his method based on his ongoing experiences and research, along with his own perceptions and strategies for the NSF Nonprofit R&D Survey. Many of these ideas are available in a 2014 book (Dillman, Smyth, and Christian, 2014).
Dillman said that designing a survey of the nonprofit sector presents some unique challenges. He identified five issues that may affect how the survey is designed and implemented:
- First, nonprofits are so heterogeneous in terms of size and other factors that the survey may need to be designed from the outset with a range of survey approaches.
- Second, the design should take into account the knowledge that some organizations will clearly understand the meaning of R&D while others will find these ideas unclear or irrelevant.
- Third, nonprofits will differ with regard to their preferred response mode. For example, most organizations may be able to respond via the Internet, but others will be reluctant to use that mode. This variation will require specific attention.
- Fourth, convincing some organizations to respond to the survey will require a significant effort.
- Finally, respondents will vary across various organizations. Some nonprofits will have a single best respondent; however, in others multiple respondents may need to be involved.
All of these issues require forethought and planning at the design phase of the survey, he asserted.
Dillman next presented eight specific ideas to maximize the response rate of the NSF Nonprofit R&D Survey (see Box 5-8) and elaborated on each. First, as Berry described, effort should be devoted to obtaining valid contact information, which should include the name of a specific person to whom the survey should be sent, and also verifying the existence of the organization. Sometimes multiple contacts, such as an initial mailing with follow-ups, can end up with different people in larger organizations;
BOX 5-8
Dillman’s Ideas to Maximize Response on the Survey of Nonprofits
- Make an initial contact with organizations, especially larger ones, to find out the name and contact information for the person to whom request should be sent.
- Obtain contact information for telephone, email, and postal delivery.
- Use multiple contacts by different modes in predetermined sequence to encourage contacts.
- Consider getting statement(s) of support from leaders in the nonprofit sector for possible use in communications.
- Use initial postal contact with request to respond by web followed by email to “make responding easier for you.”
- Do not offer a choice of response mode unless you make it easy to respond by either mode. Doing so lowers response rates.
- Do not rely only on email contact. Mail needs to be used to legitimize the study (some nonprofits will not know who the National Science Foundation is; email only surveys get much lower response than when other contact modes are used to amplify effectiveness of email contacts).
- Use a postal mode response option—effective when no web response has been achieved, but not vice versa.
SOURCE: Dillman (2014).
therefore, making an initial investment in identifying the right person to receive the survey each time is very critical, according to Dillman. Second, he emphasized that NSF should obtain multiple ways of contacting respondents, including telephone, email, and postal address. These contacts then form the basis for an effective implementation system, his third idea. These multiple contact modes should be used in a predetermined sequence in which each contact works in synergistic fashion with the others. Fourth, Dillman suggested that getting a statement of support from leaders in the nonprofit sector for NSF to use in its communications with potential respondents may be helpful in encouraging response. Although this technique is not uniformly effective, it can be helpful if it is integrated well with the other procedures.
Fifth, Dillman suggested using an initial postal contact with request to respond by web, followed by an email to make responding easier for the respondent. “And so, I’m really suggesting doing everything possible, perhaps early on, to be able to get both the email and the mail addresses,” stated Dillman. A number of reasons exist for making postal contact
first, along with email augmentation, suggested Dillman, adding more background for this recommendation. He referred to a recent study that he conducted about the extent to which graduate students were writing interdisciplinary dissertations in 2013. They anticipated a low response rate from the population they were sampling. Using only an email contact would have been possible because they had an email contact for each person in the sample. However, using email only to get a web response was likely to yield a 20 to 25 percent response rate based on experience with other surveys of students conducted by the Social and Economic Sciences Research Center at Washington State University. Using mail-only contact to get a web response would likely have resulted in a response rate of 35 percent, and using mail only to get a paper response was likely to result in a response rate in the 35 to 45 percent range. Instead, Dillman said, he and his colleagues “designed a system to push responses to the web by withholding a ‘paper-response’ option until later but also followed it up with mail while trying to build synergy across the postal and email contacts.”
Dillman enumerated the steps they implemented. On the first day, they mailed a postal request to respond over the Internet, while sending a $2 token incentive. Dillman clarified that such an incentive would not be appropriate for an organization. Three days later, they used email augmentation, and again sent another email on Day 8. On Day 16, researchers sent a postal follow-up with a mail questionnaire, using this in anticipation of coverage problems with email alone. For example, some students might not have had access to email because of off-campus fieldwork. Finally, on Day 21, they sent a final email augmentation.
Figure 5-1 shows that the effects of each of these elements on response rate. Dillman indicated the connectivity of the techniques rapidly increased response rates. The response to the initial contact was low, but the first email augmentation resulted in an additional 21 points within 10 hours. Within 5 days, they had achieved 40 points. Once the paper surveys were mailed, although these responses were somewhat delayed, the web response also increased simultaneously. Ultimately half of the additional responses to the mailing were on the web. The final response rate was 77 percent using these methods.
Dillman summarized these effects, stating, “Postal contact had [the] incentive, [and] email had [the] message, ‘Here’s a link to make responding easier.’” Pairing these methods increases the likelihood of one of the others being opened and read, while making an initial contact over the telephone also increases the anticipation that something important is coming, he said. Further, the use of multiple contacts improves coverage in case one of the contacts is wrong. Connectivity improved the speed of the responses as well. The effects of this synergistic approach are also being seen with the American Community Survey, Dillman noted.
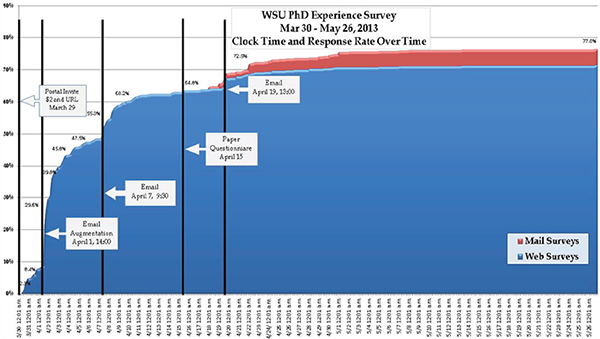
FIGURE 5-1 Email augmentation pushing response rates up.
SOURCE: Millar (2013, Fig. 1).
Dillman’s sixth idea is to offer a choice of response mode only if the survey is made easy for respondents to respond by either modes. Response rate is lower when these conditions are not met. However, it can still be effective to emphasize one method over another until later in the process as a means of improving responses, he said. As his seventh idea, Dillman noted it is inadvisable to rely only on email contact because mailings play an important role in legitimizing the study. Finally, he explained in his eighth idea that postal mailings can boost web responses, but the converse does not appear to be the case (Messer and Dillman, 2011; Millar and Dillman, 2011).
The NSF Nonprofit R&D Survey is likely to encounter nonrespondents when the organization does not undertake R&D or is unclear about the meaning of that term, Dillman suggested. One approach to addressing this type of nonresponse could be placing a follow-up telephone call that includes the screener items, so that if the organization was deemed eligible, then additional contact by email and mail could be made.
The science of survey development and implementation has advanced a great deal in Dillman’s view. Research supports the use of multiple contacts and multiple response modes, and the need to demonstrate that responding is both easy and important to do. Dillman reiterated this point by providing a draft implementation sequence (see Box 5-9) for what
BOX 5-9
Dillman’s Survey Implementation Sequence Example to Maximize Survey Response
- An initial contact by telephone to obtain contact information.
- An initial postal letter that explains and legitimizes request for research and development information.
- A quick email follow-up to make it easier for person to respond.
- Another postal letter requesting a response.
- Another email augmentation.
- Telephone calls for nonresponse follow-up.
- Additional email and/or postal contacts.
SOURCE: Dillman (2014).
he recommends to be a mixed-mode, multiple-contact survey. Current approaches are increasingly tailored with different contact modes and response modes for different populations and situations. He stressed that applying methods from similar surveys with the business sector to the nonprofit sector may not be effective. The result of these rapid advances is that it is not always possible or desirable to apply methods from the past to current and future studies.
Additional Considerations for Implementing the NSF Nonprofit R&D Survey
Ron Fecso also addressed the design of the questionnaire and approaches to data collection. As Berry and Dillman suggested, Fecso stressed the importance of collecting useful data to enhance the sample frame at the outset, and he also recommended that NSF focus on obtaining a good response rate. Fecso said that obtaining good response from the big R&D-producing nonprofit organizations was particularly important, and that NSF should use screening tools to improve the efficiency of implementation.
Fecso noted that ultimately the data collected are “going to plug some holes in a bigger dataset where the data are collected in a way that’s already defined.” He additionally stressed the importance of limiting the number of questions on the survey and eliminating any unnecessary items. Fecso said if an item is important, then there needs to be a sample size that is sufficient to analyze that item at the appropriate level. If the sample size will not support the appropriate analysis of a particular item,
he said, then this should be an important consideration in whether the item should be retained or discarded. Ensuring that the questionnaire is no longer than necessary can increase the chances that a respondent will respond. Fecso indicated that effective screener items, tailored depending on how likely the organization is to be an R&D performer, can also help boost response rate. Tailoring can also be used to make the questionnaires more personal, suggested Fecso. For example, knowledge of what an organization does might be useful in developing tailored web questionnaires and more personal initial and follow-up contacts.
Workshop Discussion on Implementing the Survey
Salamon observed that the presentations pointed to two different approaches to the NSF Nonprofit R&D Survey—the methodology-driven strategy and the substance-driven strategy. In his view, the substance-driven strategy starts with the premise that the goal of the survey is to understand R&D in the nonprofit sector; however, the methodology-driven strategy focuses more on understanding R&D in certain parts of the nonprofit sector. In the latter approach, the results may be easier to defend methodologically, but this involves tradeoffs. Ultimately, Salamon indicated that this is a policy decision that NSF will need to make. “Are we attempting to find R&D in its multiple forms in the nonprofit sector, or are we trying to come up with a number that is kind of a shrunken concept of what R&D really constitutes but that will allow us to do it with much greater validity?” he asked. He added that he realized that pursuing a substance-driven approach would be more difficult and would require more observations.
Irwin Feller agreed generally with the characterization that Salamon conveyed but said that there are ways to integrate the two strategies. In particular, he said, the screening approach presented by House is a way to develop a user-based definition of R&D and to understand how nonprofits conceptualize these activities. Starting with an inclusive definition, applying the procedures outlined by Berry and Dillman, and adhering to the appropriate methodological constraints could be a way of blending the two strategies, Feller proposed. In his view, referring to the previous 1997 survey is of little value because it serves as a poor baseline. Instead, he argued that “we just start fresh, go forward, and I think the real approach is to encompass the multitude of diversity of activities that we heard from the nonprofit organizations who presented at the workshop.”
Phillip Kott commented that the substance-driven approach is challenged by the need for a larger sample size, while the methodology-driven approach may be flawed if it is overly reliant on estimating sampling needs based on the 1996–1997 survey. In Kott’s view, “the problem
is bias, that we may be missing a lot in those small groups that we don’t want to miss. . . The problem with the way sampling works is you need the same sample size no matter what you’re estimating for. . . and we just don’t have that money.”
David framed the choice as between two desirable goals: producing a set of numbers that can facilitate international comparisons and exploring the quantitative importance of various forms of research in the nonprofit segment of the service sector. In the former approach, efforts are devoted to eliciting responses from the types of organizations likely to produce 80 to 90 percent of the R&D, using a stratified sampling approach to emphasize those organizations. In the alternative, one would seek responses from the various types of organizations that identified themselves as R&D producers based on preliminary screening questions and devote resources to obtain responses from them with the ultimate purpose of capturing the diversity of the sector. David suggested an approach that targets the larger producers of research activity but then devotes a portion of the resources “essentially to keeping the survey wide open to provide an informatively detailed picture of the diversity of research, research style, and methods. This mixed approach requires careful preliminary attention to the characterization of the activities that are to be described as research or R&D.”
Larsen noted three discussion points across the workshop were intersecting. First, the varied interests in the data would require a narrow concept of measurement to produce data applicable to the System of National Accounts, along with a broader concept to capture what research is in the nonprofit sector. Second, sampling design and stratification are necessary for efficiency, allowing for analysis of subgroups. Third, reaching these selected organizations requires planning for multiple contacts.
Stone stated her view that if it were not possible to develop a sampling approach that captures the full nonprofit sector, then the survey ought to be characterized differently and focused on large research institutes. Susan Raymond noted that philanthropies concerned with the health of civil society and the health of the nonprofit sector might be able to supplement the survey through a public-private partnership, if resources are the sole barrier to capturing the full nonprofit sector.
Determining how to obtain a good response rate among people who receive many surveys was a second issue. Catherine Mickle shared her views as a potential respondent to the NSF nonprofit survey. By clearly laying out the factors that would influence her decision to respond to a survey, she provided a blueprint that NSF may follow as they strive for high response. Mickle commented that she receives many surveys about a range of topics, all of which represent competing priorities unrelated to her daily mission. Because of the number and the demands on time, Mickle makes decisions about which surveys to complete. She indicated
she filters out surveys that are very time-consuming with little apparent value in their use; from unknown organizations; veiled press inquiries; likely to encourage solicitation; and from consulting firms that are not working on behalf of a known organization. In contrast, Mickle stated she completes surveys if: they are required or seem to be mandatory; they look official or are from a government entity; someone in the leadership of her organization has a connection to those carrying out the survey; her organization sees the survey as valuable with regard to input or output or to the sector at large; her organization perceives that it has unique perspectives or data to offer; responding would help to strengthen a relationship that might be important in the future; or there is an exchange element, such as receiving the results of the survey in exchange for data.
POTENTIAL OUTPUTS FROM THE SURVEY
The workshop looked at the required outputs from the NSF Nonprofit R&D Survey and considered which additional outputs may be valuable to NSF or to the broader nonprofit community. A summary of that discussion follows.
Outputs Required for NSF Products
Mark Boroush, senior analyst in the R&D Statistics Program at NCSES, presented details about the products that NSF is mandated to produce. NSF annually releases National Patterns of R&D Resources, across sectors (National Science Foundation, n.d.-a). The nonprofit sector is part of its mandate, and this survey would be used to estimate the sector ’s contribution to R&D. In the years without such a survey, NSF has modeled the contribution from the “other nonprofit” sector.
Boroush noted that these estimates generate great interest among those involved with national policy, particularly with regard to the United States’ overall level of R&D performance (expenditures) and the ratio of this performance to gross domestic product as compared to other countries. NCSES also dissects R&D by the character of work (i.e., basic research, applied research, or development). Boroush stated, “There’s a dialogue right now whether the level of our support for basic research, particularly that provided by the federal government, is enough to keep our innovative edge going or whether in fact we’re falling behind what’s going on in other countries.” These policy implications provide an indication of the importance of gathering data on R&D across all sectors. Boroush presented data on total R&D performance across the major sectors in 2011, the most recent year for which NCES has final numbers. These data are presented in Table 5-1. In 2011, the United States performed
TABLE 5-1 U.S. 2011 Research and Development Expenditures (in millions)
| Performing Sector | Funding Source | ||||||
| Total | Business | Federal Gov. | Universities & Colleges | Nonfederal Gov. | Other Nonprofits | Performing Sector Percentage of Total | |
| R&D | 428,626 | 267,306 | 129,256 | 12,965 | 3,993 | 15,106 | 100.0 |
| Business | 294,093 | 262,784 | 31,309 | * | * | * | 68.7 |
| Federal Government | 53,493 | * | 53,493 | * | * | * | 12.5 |
| Federal Intramural | 35,775 | * | 35,775 | * | * | * | 8.4 |
| FFRDCs | 17,718 | * | 17,718 | * | * | * | 4.1 |
| FFRDCs, Industry Administered | 6,956 | * | 6,956 | * | * | * | 1.6 |
| FFRDCs, U&C Administered | 5,246 | * | 5,246 | * | * | * | 1.2 |
| FFRDCs, Nonprofit Administered | 5,516 | * | 5,516 | * | * | * | 1.3 |
| Nonfederal Government | 462 | * | 187 | * | 275 | * | 0.1 |
| U&Cs | 62,457 | 3,189 | 37,714 | 12,965 | 3,718 | 4,872 | 14.6 |
| Other Nonprofit Organizations | 18,120 | 1,333 | 6,553 | * | * | 10,234 | 4.2 |
| Source of Funds of Total (%) | 100.0 | 62.4 | 30.1 | 3.0 | 0.9 | 3.5 | –— |
NOTE: * = small to negligible amount; FFRDCs = federally funded research data centers, R&D = research and development, and U&Cs = universities and colleges.
SOURCE: Boroush (2014). Data from National Science Foundation, National Center for Science and Engineering Statistics, National Patterns of R&D Resources (annual series). Available: http://www.nsf.gov/statistics/natlpatterns/ [February 2015].
approximately $429 billion of R&D. The estimate for “other nonprofit” (nonacademic and nongovernment) R&D performance was $18 billion, or approximately 4 percent of total R&D performed in the nation. In 1997, the “other nonprofit” sector performed approximately $6 billion in R&D before adjusting for inflation, indicating a significant increase in estimated activity. Federally funded research and development centers (FFRDCs), such as Lawrence Livermore and the Pacific Northwest Laboratory, are also estimated to perform about $18 billion. He added that these numbers do not take into account the contributions of volunteer labor.1
Ideally the estimates of R&D in one sector are compatible with the estimates gathered from other sectors, enabling the numbers to be added together. For example, the estimates from the business sector, which are reported on a calendar-year basis, require no adjustment. However, the federal R&D estimates do require adjustment because they use a federal calendar year. Estimates from higher education require other adjustments. Overall the purpose is to “be adding apples to apples and making things as consistent as they can,” explained Boroush. The end product of this addition is the U.S. total R&D in performance by the major performing sectors, published annually in National Patterns of R&D Resources, including information briefs and statistical tables. These estimates are also a key component of the Science and Engineering Indicators published every two years.
Boroush reiterated that the 1996–1997 survey was the last time that empirical data were gathered to measure R&D in the “other nonprofit” sector, and that since that time they have modeled “elasticity relationships” to look at proportional changes in the numbers to estimate R&D in the “other nonprofit” sector. Because of this, he stated, “This definitely represents a hole, I guess, in the dataset that we’ve got, and it’s something that we need to fill and have needed to fill for some time.” Currently, NCSES estimates “other nonprofit” R&D performance resources by adding together estimates of funding for “other nonprofit” R&D from the three primary sources of those funds, as shown in Table 5-2. The first source of funding for nonprofit R&D is from the federal government. NCSES has current, annual data on the amount of federal R&D dollars going to nonprofits through its annual Federal Funds survey. The table shows an estimated $6.56 billion in R&D performance in the “other nonprofit” sector funding by this source. A second source of funding is from the business/industry sector. As noted in the 2013 National Research Council report, “NCSES assumes that the annual growth in funding from industry to nonprofit organizations changes in constant proportion to
______________
1Organizations reporting on these surveys are unlikely to convert and report the value of volunteer labor as an R&D expenditure.
TABLE 5-2 Estimating Research and Development (R&D) Performance by Other Nonprofit Organizations (billions of dollars)
| Source of Estimate | Estimated Total Other Nonprofit R&D | (A) Federal Funding for Other Nonprofit R&D | (B) Business Funding for Other Nonprofit R&D | (C) Nonprofit Funding of R&D in Other Nonprofits |
| Total = (A) + (B) + (C) | Annual Survey of Federal Funds for R&D | Estimateda | Estimatedb | |
| 1997 | 6.62 | 3.01 | 0.81 | 2.80 |
| 2000 | 9.73 | 4.51 | 1.02 | 4.20 |
| 2005 | 14.45 | 6.55 | 1.11 | 6.80 |
| 2010 | 18.40 | 7.09 | 1.27 | 10.04 |
| 2011 | 18.12 | 6.56 | 1.33 | 10.23 |
aBased on elasticity ratios from the 1996–1997 Survey of R&D Funding and Performance by Nonprofit Organizations. Current-year business funding of R&D in other nonprofits based on current-year business funding of R&D in other businesses.
bBased on elasticity ratios from the 1996–1997 Survey of R&D Funding and Performance by Nonprofit Organizations. Current-year nonprofit funding of R&D in other nonprofits based on current-year nonprofit funding of R&D in academic institutions.
SOURCE: Boroush (2014). Data from National Science Foundation, National Center for Science and Engineering Statistics, National Patterns of R&D Resources (annual series). Available: http://www.nsf.gov/statistics/natlpatterns/ [February 2015].
the annual growth in industry-to-industry funding” (National Research Council, 2013, p. 51). NCSES conducts an annual survey of R&D within the business sector and estimates the funds transferred to the “other nonprofit” sector based primarily on what was learned during the 1996–1997 survey, Boroush noted. In 2011, NCSES estimated this funding to be $1.33 billion. The third source of “other nonprofit” funding is derived in a similar fashion, using the observed relationships between academic institutions’ funding of other nonprofit R&D in 1996–1997. The 2011 estimate for this component was $10.23 billion. The total estimated R&D performance for 2011 is the sum of those three estimates, $18.12 billion.
Boroush commented, “What we’re looking for out of this survey, one of the things we’ve not been able to do is to track the up and down of the economy and corresponding up and down changes in funding trends in the nonprofit sector, because we’re relying on statistical relationships that date back to the late 1990s.” Further, changes in the nonprofit sector, such as increased use of evidence-based program management or shifts in the extent to which philanthropy versus fees or government funding
are playing roles in driving certain activities or R&D spending, cannot be tracked through current methodologies. Finally, according to Boroush, NCSES also needs to identify effective ways to estimate the R&D that is happening in the “other nonprofit” sector between surveys, because the new nonprofit R&D survey is unlikely to occur annually.
Boroush concluded his remarks, wrapping up a summary of the key data needs for the National Patterns of R&D Resources. “Clearly the primary need in all this is for a complete and comprehensive new round of numbers that provide total U.S. domestic R&D performance by the other nonprofit sector, and by source of funding,” said Boroush. First and foremost, he stressed, data are needed about who is performing R&D in the nonprofit sector and how much they are performing. Second, NCSES needs clarity on what comprises R&D in the nonprofit sector, including determining how the OECD’s Frascati definitions will be implemented and what portions of this R&D are relevant for including in the U.S. total R&D estimates. Third, Boroush pointed to two breakouts needed of the total R&D performance in nonprofits. First, NCSES needs to know the sources of the R&D funding and how much funding is coming from each source: from the nonprofits themselves, from the federal government, and from the business sector. Boroush said that NCSES also needs to know what other sources may be providing significant levels of funding, such as nonfederal government or international sources. The second breakout is to understand the character of work performed—whether basic research, applied research, or development.
Boroush said he would prefer data from a new survey of “other nonprofit” R&D each year, which would supply the information described above. However because of resource constraints, he thought it unlikely that the survey could be conducted regularly on an annual basis. Thus, NCSES would like to improve the way that it estimates R&D in the nonprofit sector for the years in which it will not be conducting the survey.
Other Potential Outputs
Feller initiated a discussion of the ways in which the data from the NSF Nonprofit R&D Survey could be used beyond the National Patterns of R&D Resources. He asked the participants to assume that definitions of R&D in the nonprofit sector were clarified and that the challenges of population, sample frame, questionnaire design, implementation strategy, and statistical rigor had all been addressed. If these challenges were overcome, then participants could consider how these data could be useful to the varied stakeholders with differing interests and needs. These needs are not mutually exclusive, Feller added. However, he pointed
out, nonprofits are more likely to respond when they perceive a mutually beneficial exchange and they can benefit from the data being collected.
House referred to comments that several participants had made over the course of the workshop. The standard tables that NSF publishes in the National Patterns of R&D Resources release display the nonprofit sector broken into subsectors based on how NSF collects the data: other nonprofits, universities and colleges, university and college FFRDCs, and nonprofit FFRDCs. Many attending this workshop, she noted, consider all of these components as part of the broader nonprofit sector. A useful additional product would be for NSF to produce some additional but similar tables that combine these components together, she suggested. Thus there would be estimates of R&D performance and funding for the entire sector. In her view, this appears to be a simple, no-cost product that could be very valuable to stakeholders.
David suggested that the NSF nonprofit survey could serve as “just an opening, which would make possible the organization of a much larger and much more comprehensive survey of the not-for-profit sector.” He added that NCSES is a small part of NSF, and other agencies, such as the U.S. Department of Commerce, the Labor Department, and environmental agencies, all gather data. He suggested an exploratory aspect of the NSF nonprofit survey could serve as a catalyst toward a partnership of resources and expertise among various agencies to properly survey the nonprofit sector. Such a survey could be designed to capture not only their R&D activities but also the ways in which the sector contributes to the welfare of the American people. David also noted that the techniques that NSF is developing to learn about R&D in the nonprofit sector will have implications relevant to measuring the activities of the service sector beyond the nonprofit arena, increasing their overall impact.
Salamon expressed his interest in expanding the scope of the NSF nonprofit survey by exploring ways to marshal external funding for NSF to enable expanding the pool of organizations surveyed, or by conducting a broader survey with a research team outside of NSF following parallel methods so that the data could be used together for NSF’s purposes, as well the purposes of other stakeholders. He stated that a broader survey would “begin to create a baseline of information on who’s using evidence-based decision making and track that over time,” adding that he saw this as “an enormous trend, and an area of enormous interest in the philanthropic arena.” David suggested that the National Academies could also potentially play an important and independent role in planning such an effort, identifying sponsors of the work, and bringing together a range of experts. Foundations are another potential resource that might be “mobilized” for examining the possibilities that exist across the statistical agencies of the government to focus on the nonprofit sector, he noted. Thus, he
agreed that NSF is not the only agency that could address broader goals. Kott added that the Urban Institute and other groups outside government might be able to play important roles in such efforts.
Feller asked the participants from the nonprofit organizations to share their views on the survey and future uses of the data, emphasizing a need for re-conceptualizing definitions of the sector and their activities. Maria Cristalli indicated that she would value gaining more understanding of the types of activities such as those shared by the nonprofit organizations at the workshop because little information currently exists. Enormous changes in the way nonprofits are funded are driving a need for a body of knowledge of how the work is done across the nonprofit sector she observed, and this information could facilitate knowledge sharing and demonstrate the positive impact that the sector can have collectively.
Cristalli’s comments echoed suggestions that Britt received during the exploratory interviews (discussed earlier in this chapter). Those respondents said that they would be interested in
- seeing the data presented by tax exempt status and field of research;
- learning whether other nonprofit organizations faced similar restrictions on annual funding of research;
- identifying other nonprofits doing work in the same field, and those of the same size, to determine whether they were duplicating any efforts;
- learning about recovered indirect cost allocation; and
- knowing the geographic location of peer organizations.
Cristalli expressed her view that the NSF Nonprofit R&D Survey will require engagement with survey recipients and clear communication about how the survey will help the sector move forward.
Stone shared her views as a former survey researcher outside of the nonprofit sector and as a current leader within the nonprofit sector. She noted NSF and the nonprofit sector currently have very different goals and needs. “The nonprofit sector has the need for knowledge because we are increasingly being asked to show our value . . . that if we don’t demonstrate it, we’re going to lose our tax-exempt status,” she said. In her view, NSF seems to have insufficient funds to truly capture the diverse range of R&D activities in which the nonprofit sector is engaging, and instead must focus primarily on gathering data for national reporting purposes consistent with data gathered in other sectors. The National Patterns of R&D Resources is of little interest to most organizations in the nonprofit sector, she said. Therefore, NSF will need to attend to how to frame the survey in a way that is of value to the nonprofit sector so that organiza-
tions are motivated to respond to the survey. Further,more she indicated that she supported the notion of looking to outside sources to broaden the scope of the survey, and she believed other organizations might be interested in such work.
Feller indicated that rather than seeing the methodology-driven strategy and the substance-driven strategy as an either/or proposition, a phased approach might be an alternative view. He proposed that while recognizing the present planned survey has resource constraints and limitations, NSF could build in exploratory modules that serve as springboards to the nonprofit sector itself, other government agencies, or outside research groups to initiate a larger study of the sector, which he said seems necessary. In addition, Feller indicated that the National Academies could play a role in bringing together “a national forum on this type of issue, which serves the primary purpose of bringing visibility to an area and an issue that really is not on anybody’s main agenda.”
CHAPTER SUMMARY
Overall, participants discussed ways to design the questionnaire, plan for successful implementation, and achieve good response rates. Many participants expressed support for the use of a screening tool that could be useful in identifying ways that respondents understand their R&D activities, in addition to helping NSF to allocate resources effectively. Discussion revealed that underlying conceptual issues remain challenging. In particular, determining to what extent to capture the diverse nature of the nonprofit sector and how much focus should go to the largest producers of R&D remains an open policy question. Several participants offered potential ideas for accomplishing multiple uses of the data.


