
4
Approaches to Survey and Sample Design
Chapter 3 summarized five key challenges, identified through the discussions among many presenters and participants, that face the designers of the National Science Foundation (NSF) Nonprofit Research and Development (R&D) Survey: understanding the diverse and unique nature of R&D in the nonprofit sector; using the correct language for communication about R&D; accounting for the interconnections among nonprofits; identifying the correct respondents; and understanding the financial and labor resources within nonprofits. With those challenges in mind, this chapter summarizes presenters’ and participants’ guidance on design and measurement for the proposed survey of nonprofits from five sources: the Frascati Manual, international experiences, the 1996–1997 NSF survey of nonprofits, a discussion with sampling experts, and an overview of data sources available for creating a sample frame. Taken together, this guidance may help identify steps that NSF could take to address these challenges and design a survey that will meet its goals and fit within its budget limitations. Presenters made the following points, as summarized in this chapter:
- The Frascati Manual developed by the OECD provides guidance on the definition of R&D, and on a classification system to determine whether an organization should be included in the nonprofit sector.
- That guidance is considerably different from the approach of using tax-exempt status to define a nonprofit, and results in a narrower definition of the sector. Many countries use guidance from
-
the Frascati Manual, but great variation remains in measurement across countries based on institutional differences and historical realities.
- Canada, Italy, and the United Kingdom (UK) all define a fairly narrow population of nonprofits based on the Frascati guidelines and then conduct censuses of their nonprofit sectors to measure R&D.
- Several workshop participants expressed the view that the Frascati guidance was outdated in regard to R&D definitions and/or the classification of the nonprofit sector.
- Based on the experience with the past NSF nonprofit survey, the sample size should be increased for the new survey, and large nonprofit organizations likely to perform R&D should be oversampled, according to several participants.
- A variety of sampling, stratification, and weighting techniques are available to explore for this survey, with several discussed in this chapter.
- The pilot study can be used to study and refine the stratification and sample allocation, study the quality of segment classifications, study response rates and missing data rates, and analyze correlations amongst outcomes and auxiliary variables.
- Three Internal Revenue Service (IRS) data files and various data products from the National Center for Charitable Statistics (NCCS) are available to assist with identifying the nonprofit population and developing a sampling frame.
- Narrative data about program accomplishments from nonprofits’ IRS Form 990s may be used to identify key words that nonprofit organizations use to describe R&D activities.
Paul David provided some contextual comments at the beginning of the session. He explained that one reason that R&D is important is because it involves expenditure flows directly relevant to the National Income Accounts, and that looking at the broad importance of R&D across all sectors of the economy has implications for the design of the NSF Nonprofit R&D Survey. The product of research is information, and R&D produces novel information, which in turn feeds future research. He stressed that these innovative processes are key sources of economic growth and ultimately potential sources for the improvement of human welfare and well-being. However, information is only one of a number of inputs that lead to the production of new inventive outputs. Thus, the data from the survey must be able to be integrated with other kinds of information in order to be of use to analysts and those who advise policy makers. “Being aware of the need to try to make things comparable and integrable for subsequent analysis is something that at least a lot of economists think
should guide the collection of data and the tagging of data so that subsequent work could be done with the data,” suggested David.
GUIDANCE: THE FRASCATI MANUAL
The Frascati Manual is a major resource to aid countries in collecting data on R&D so that those data can be consistent across countries. The Frascati R&D definitions and guidance are relied on for the integration of R&D into the System of National Accounts (SNA). Developed by OECD, the manual provides guidance on the “measurement of human and financial resources devoted to research and experimental development (R&D)” (OECD, 2002, p. 14).
Aldo Geuna, professor at the University of Turin in Italy, provided a brief overview of key concepts from the Frascati Manual. Originally created in 1963, the manual has undergone many revisions, including a current ongoing effort. It is shaped by public policy, according to Geuna, and reflects a compromise among a growing number of countries.
A key challenge for NSF, identified by several participants and highlighted in Chapter 3, is to better understand both the breadth of the nonprofit sector in the United States and the type of R&D performed by that sector. The manual provides some definitional guidance on this issue, but the guidance is different from the approach of using the tax-exempt status certified by the IRS (discussed in Chapter 2) to identify a nonprofit. Geuna pointed to a key revision in the Frascati Manual that occurred in 1993, when the definition of private nonprofits (PNPs) was changed. According to the Frascati Manual, the PNP sector includes “non-market, private non-profit institutions serving households (i.e., the general public) and private individuals or households” (OECD, 2002, p. 64). Geuna emphasized that the word “non-market” is the significant element of the definition, referring to the OECD definition of non-market that states: “Non-market services cover those services provided to the community as a whole free of charge, or to individual consumers either free of charge or at a fee which is well below 50 percent of production costs” (OECD, n.d.). The definition does not classify organizations rendering services to enterprises, primarily serving government, or entirely or mainly financed or controlled by the government as PNPs because they are not “serving households.” Institutions of higher education and the entities they control (such as medical centers and research laboratories) are also excluded from the nonprofit sector under this definition. Some of those excluded organizations fall into the business sector, government, or education. Geuna stated that these exclusions, and the non-market criteria, help to explain why the number of institutions counted as PNPs in a number of countries seems low.
Several participants discussed their views on the Frascati definition
of nonprofits. Lester Salamon noted he was concerned that those revising the manual were not following the lead of the 2008 SNA revision. The SNA state that “the distinguishing feature that identifies an NPO is that its status does not permit it to be a source of income, profit or other financial gain for the units that establish, control or finance it” (OECD et al., 2008, p. 455). The revision also enabled the creation of subsectors within the major sectors (i.e., government, corporate, education) and thus allowed the break-out of nonprofits that were buried in the major categories. The SNA made a change in this definition, he noted, because “they recognized that nonprofit institutions serving households (NPISH) excludes all of the market-based NPIs and all of what you referred to as the ones serving government. Many of the ones described as serving government are delivering services to citizens—those services are just paid for by government funds. They are not market-based.” According to Salamon, a very limited definition of non-market entities produces a limited and distorted view of the nonprofit sector.
John Jankowski, National Center for Science and Engineering Statistics (NCSES) at NSF, has worked on the Frascati revisions. He said those working on revisions are aware of the SNA revisions and the rationale for making them. He added that the revision process considered the tagging and aggregating of various components of R&D across sectors, but did not go in that direction. Geuna added that the current revision group for the Frascati Manual is not considering a significant change to the definition of PNP, athough the group’s work and discussion are still ongoing as of June 2014.
GUIDANCE: INTERNATIONAL EXPERIENCES
The approaches of other countries to measuring R&D in the nonprofit sector can inform the design phase of the NSF Nonprofit R&D Survey. Thus, the workshop included presentations describing the experiences of Italy and the UK within a European context, as well as a presentation about Canada’s approach.
Europe
Geuna discussed the measurement of R&D in the nonprofit sector using Eurostat data from the 28 countries of the European Union (EU).1 He subsequently discussed both the UK and Italy in more detail.
______________
1As explained on its website, Eurostat is the statistical office of the European Union situated in Luxembourg. Its task is to provide the European Union with statistics at the European level that enable comparisons between countries and regions (http://epp.eurostat.ec.europa.eu/portal/page/portal/about_eurostat/introduction [December 2014]).
Looking across all countries in the EU, the nonprofit sector is involved in R&D to a much less extent than are other sectors of the economy: R&D funded by nonprofits is 0.03 percent of gross domestic product (GDP) compared with approximately 2 percent of GDP for all sectors of the economy combined. However, that percentage is growing. Looking across the past decade, the role of the PNP sector is growing as a percentage of GDP, including specifically in R&D as narrowly defined, he said.
Geuna stressed that there is no such thing as the “European experience” in these matters. He explained that great variation in measurement exists across countries and even within countries with respect to R&D in nonprofits based on institutional differences, with historical reasons for many of these differences based on the nonprofit sector ’s independence from or connection to government ministries. Comparability of the data is weak at best. Table 4-1 shows that the UK and a number of northern European countries have measured R&D in similar amounts as the United States. Italy and Finland are also measuring R&D in their nonprofit sector, but in moderate amounts. Many other countries are measuring very little R&D by that sector. In several countries, such as Germany and France, many PNP organizations are classified under the government sector. Geuna further stated that banking foundations are very important in Italy, health foundations are especially important in France, and energy foundations are most important in Germany.
As of 2011, the main expenditures by private nonprofits in R&D across the EU are by foundations that are funding extramural research in institutes of higher education. However, in Italy and Portugal, the amount of R&D dollars spent at PNPs is higher than the amount spent at universities.
United Kingdom
Geuna turned to the specific experiences of the United Kingdom. PNPs account for 2 percent of gross domestic expenditures on R&D, but they also fund approximately 5 percent of such expenditures. By comparison (as shown in Figure 4-1), the government accounts for 8 percent of R&D, higher education 27 percent, and business 63 percent. Geuna explained that the UK PNP sector consists primarily of charities, trusts, and medical research. Wellcome Trust is the single largest foundation in the UK and is particularly important as a large cancer research charity. The sector that performs R&D also includes such organizations as libraries, zoos, engineering and design activities, and technical testing and analysis.
Geuna indicated that a survey of the nonprofit sector in the UK was conducted in 2005, repeated in 2012, and is now implemented on a biannual basis. The survey design in 2012 included two waves of presurvey
TABLE 4-1 R&D Funded by Nonprofits, in Units of Purchasing Power Standard per Inhabitant at Constant 2005 Prices
| Country | 2003 | 2004 | 2005 | 2006 | 2007 | 2008 | 2009 | 2010 | 2011 |
| European Union (28 countries) | 5.4 | 5.6 | 5.8 | 6.5 | 6.8 | 7.1 | 7.0 | 7.1 | 7.2 |
| Euro Area (17 countries) | 3.1 | 3.4 | 3.7 | 4.7 | 4.9 | 5.0 | 4.8 | 5.1 | 5.2 |
| Denmark | 18.7 | 19.3 | 26.2 | 26.4 | 28.0 | 29.6 | |||
| Germany (until 1990 former territory of the FRG) | 2.1 | 2.4 | 1.9 | 2.5 | 2.5 | 2.4 | 2.0 | 1.8 | 2.9 |
| Ireland | 0.0 | 0.0 | 0.8 | 6.5 | 2.4 | 2.5 | 2.5 | 2.3 | 2.3 |
| Greece | 1.3 | 1.8 | 1.3 | ||||||
| Spain | 1.1 | 1.6 | 2.2 | 1.6 | 1.6 | 1.8 | 2.0 | 2.1 | 1.7 |
| France | 4.7 | 4.6 | 4.5 | 4.5 | 4.4 | 5.7 | 4.4 | 4.4 | 4.5 |
| Italy | 4.1 | 8.0 | 8.3 | 8.1 | 8.5 | 8.8 | 8.7 | ||
| Netherlands | 11.5 | 14.4 | 13.4 | 15.7 | 21.0 | ||||
| Austria | 2.5 | 3.0 | 3.0 | 3.0 | 3.5 | 3.6 | 4.4 | 4.5 | 4.0 |
| Poland | 0.2 | 0.2 | 0.2 | 0.2 | 0.2 | 0.2 | 0.2 | 0.3 | 0.3 |
| Portugal | 2.4 | 3.2 | 4.0 | 4.5 | 5.0 | 4.6 | 11.0 | 13.4 | 5.6 |
| Finland | 7.5 | 8.4 | 8.6 | 8.9 | 9.5 | 10.7 | 11.5 | 11.7 | 12.9 |
| Sweden | 30.8 | 28.1 | 22.5 | 25.3 | 29.6 | ||||
| United Kingdom | 21.5 | 21.5 | 22.3 | 22.7 | 23.6 | 24.8 | 24.6 | 23.3 | 23.3 |
| United States | 35.7 | ||||||||
SOURCE: Geuna (2014). Data from Eurostat online data portal at http://epp.eurostat.ec.europa.eu/portal/page/portak/statistics/search_database [February 2015].
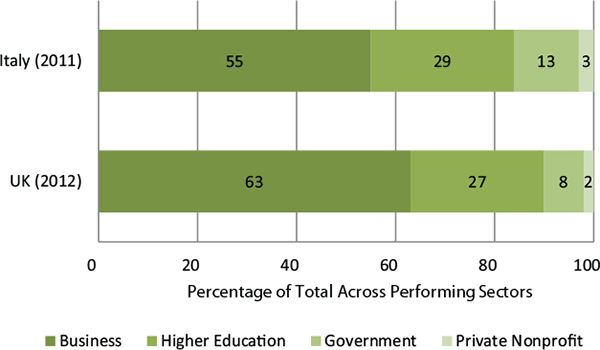
FIGURE 4-1 Percentage of gross expenditures on R&D, by performing sector, two countries.
SOURCE: Geuna (2014). Data from United Kingdom at http://www.ons.gov.uk/ons/rel/rdit1/gross-domestic-expenditure-on-research-and-development/2012/stb-gerd-2012.html. Data from Italy at http://search.istat.it/search?q=research+and+development+expenditures&output=xml_no_dtd&client=istat_fe_en&proxystylesheet=istat_fe_en&sort=date%253AD%253AL%253Ad1&oe=UTF8&ie=UTF-8&ud=1&exclude_apps=1&site=istat_en&submit.x=23&submit.y=17 [February 2015].
screening of a population of 690 potential performers meeting the Frascati definition of nonprofit organization. The screening resulted in a target population of 200 organizations that performed intramural, extramural, and/or nonmarket research for the main survey. That survey was a census of the entire target population. A response rate of 92 percent was achieved, and data for nonresponders were imputed (Office of National Statistics, 2013).
Italy
As Geuna explained, approximately one-third of the organizations in the nonprofit sector in Italy are classified as mutual assistance organizations, with the remainder classified as public utilities. The majority of nonprofit organizations are focused on culture and sports; however, education, health, research, and social care have the most employees. In
Italy, institutions of higher education are classified within the government sector, as are public research institutions. Primary and secondary education and some research institutions fall within PNP organizations.
PNP organizations account for approximately 3 percent of gross domestic expenditures in R&D in both the categories of funded and performed R&D. In Italy, the PNP organizations perform more R&D than they fund. The business sector accounts for more than half (55 percent) of all performed R&D and 45 percent of funded R&D. Higher education performs 29 percent and the government performs 13 percent of R&D, as shown in Figure 4-1.
In Italy, there are complex relationships among institutions in different sectors, forming cooperatives to create PNP research (and teaching) organizations. Geuna offered a personal example. Compagnia di San Paolo, among the largest foundations in Europe, has joined together with a corporation with the University of Torino, which has 70,000 students, to create a research (and teaching) organization called Collegio Carlo Alberto. Geuna is an employee of the university and is not employed by the Collegio. However, the statistics regarding his research activities are also included under the Collegio in the PNP sector.
In 2012, Italy completed a census of PNP organizations. According to that census, Italy has approximately 300,000 nonprofit organizations, employing 680,000 paid staff, 270,000 external paid workers, and 4.7 million volunteers. Between 2001 and 2011, Geuna reported, the number of nonprofit organizations grew by 28 percent, employment in this sector grew by 38 percent, number of volunteers grew by 43 percent, and external paid workforce grew by 169 percent (Istituto Nazionale di Statistica, 2014).
To measure R&D in this population, Italy conducts an annual census of nonprofit institutions that may potentially conduct intramural or extramural R&D. Geuna noted, “In Italy, building this kind of list of organizations is difficult, but we have a specific income tax law that allows us to identify research-performing nonprofit institutions.” Additionally, a census of all institutions was conducted in 2012. An initial population of approximately 600 organizations was identified for a screening survey to help surveyors ascertain whether the institutions were conducting research according to the Frascati Manual. Ultimately, 363 organizations were identified. In the last survey administered in 2013, 68.6 percent of the 363 organizations were performing R&D. The remaining organizations may have been doing R&D in the year or two prior to the census, but not during the time period of the actual census (Istituto Nazionale di Statistica, 2013). The census questions were quite detailed with questions regarding biotech, nanotech, energy, research, and personnel, according to Geuna.
Guidance from These European Examples
Service innovation and digitalization are increasing in the public sector in Europe, providing numerous examples of innovation in service provision. Geuna stated, “If you want to look at innovation in services (similar to the nonprofit sector) in Europe, you have to look at the public sector, and the European Public Sector Innovation Scoreboard.2 And I think if you want to look to innovation in R&D in the nonprofit sector in the U.S., you may want to look at what they did in Europe in the public sector because there is quite some overlap between the two.” Geuna provided a number of examples of innovation in the public sector that are related to the discussions that took place during this workshop:
- service innovation (the introduction of a new service or an improvement to the quality of an existing service);
- service delivery innovation (new or altered ways of supplying public services);
- administrative and organizational innovation (changes in organizational structures and routines); and
- communication innovation.
Geuna urged thinking about R&D differently. He stated, “Quality, usability, user experience, etc., are all aspects of inventive and innovative efforts in intangible service industries. Personnel engaged in efforts to plan and realize these improvements are R&D performers. Furthermore, these activities fuse the roles of research scientists, product designers, and production engineers. Now we have computer scientists and engineers collaborating in the production of intangible new digital services.”
Geuna said that he believes the definitions of R&D will need to be updated beyond the ways in which they are articulated in the 2002 version of the Frascati Manual. The traditional way of identifying what is included in “service” in R&D described in the manual is outdated and
______________
2According to the European Public Sector Innovation Scoreboard website, “Following the Europe 2020 Innovation Union flagship initiative, the European Commission launched a pilot European Public Sector Innovation Scoreboard (EPSIS) with a view to improving our ability to benchmark the innovation performance of the public sector in Europe. The ultimate ambition is to capture and present public sector innovation in a similar way to countries’ innovation performance in the Innovation Union Scoreboard (IUS) and thereby encourage and facilitate innovation activity across the public sector. The 2013 pilot EPSIS is the first EU wide attempt to better understand and to analyse innovation in the public sector. It was developed based on the experience of earlier national and regional projects, tested widely and discussed with a number of key relevant experts.” Available: http://ec.europa.eu/enterprise/policies/innovation/policy/public-sector-innovation/index_en.htm [December 2014].
becoming obsolete as digitization increases, he said. “Frascati was formulated first for application to invention and innovation in manufacturing, then updated for high-tech industries and services, and will need further updating for the new digital service provision in the private nonprofit sector, and also in the public and business sectors,” he commented.
Geuna closed his remarks by noting that R&D in the digital realm is going to grow over the next 10 years; thus, efforts to capture R&D in the nonprofit sector should move beyond traditional definitions, as well. He said he hopes that this workshop will influence the ongoing revision of the Frascati Manual.
Canada
Canada conducts an annual survey to measure R&D in its nonprofit sector. Carol House, Committee on National Statistics and study director, presented information about the Canadian process on behalf of Louise Earl of Statistics Canada. She said that the results from the survey are published annually and used as a key component in the Canadian series Gross Domestic Expenditures on Research and Development.3
Although the total nonprofit sector in Canada is sizable and accounts for up to 12 percent of the country’s total workforce, Statistics Canada follows the Frascati guidance to define a population of approximately 140 nonprofits with R&D activities4—consisting of private philanthropic foundations, voluntary health organizations, associations, societies, and research institutes—and conducts a census of these organizations. Each year, Statistics Canada seeks to determine whether the nonprofit organizations on their frame have retained their nonprofit status or have changed sectors.
The Canadian survey collects information on both intramural and funded research. The definition in Box 4-1 was provided to respondents in the instruction guide attached to the survey questionnaire. The survey is mandatory, resulting in response rates above 90 percent. Surveys are
______________
3Results from the 2012 Research and Development of Canadian Private Non-profit Organizations are available on The Daily (mobile app), in PDF version at http://www.statcan.gc.ca/daily-quotidien/140122/dq140122b-eng.htm. Additionally, tables (358–0215 to 358–0218) are available for download on CANSIM (Statistics Canada’s key socioeconomic database) under survey number 4204. These data are also published in Gross Domestic Expenditures on Research and Development in Canada, and the Provinces in PDF version at http://www.statcan.gc.ca/access_acces/alternative_alternatif.action?teng=88-221-x2013001-eng.pdf&tfra=88-221-x2013001-fra.pdf&l=eng&loc=88-221-x2013001-eng.pdf and on CANSIM table 358-0001 [December 2014].
4Nonprofits affiliated with higher education institutions or government agencies are excluded from the survey universe of Research and Development of Canadian Private Nonprofit Organizations.
BOX 4-1
Definition of R&D Provided to Respondents on the Canadian Questionnaire
Definitions
“Research and experimental development (R&D) comprise creative work undertaken on a systematic basis in order to increase the stock of knowledge, including knowledge of man, culture and society, and the use of this stock of knowledge to devise new applications.”
(OECD, 2002)
Research and development (R&D) is creative work in the natural sciences and engineering, and social sciences and humanities fields undertaken on a systematic basis to increase the stock of knowledge or discover new applications for existing knowledge. New knowledge involves the integration of newly acquired information into existing hypotheses, the formulation and testing of new hypotheses or the reevaluation of existing observations.
NOTE: Exclude all non-R&D activities (such as investigative studies, medical care, social services, education and training, dissemination of information, etc.), which your organization undertakes or funds.
To illustrate the distinction between R&D and investigative studies: the developing and testing of new methods for treating a neurosis is research. A study of psychiatric services in a region to suggest changes is an investigative study.
NOTE: The definition provided in presentation at the workshop was worded slightly differently. That definition came from the Statistics Canada website about the survey but was not provided to respondents. It is available at http://www23.statcan.gc.ca/imdb/p3Var.pl?Function=assemble Variable&DECId=128297&RepClass=587&Source=sdds&SourceId=4204&InstaId=140761&SurvId=141387&DFId=180540e.
SOURCE: Research and Development of Canadian Private Non-profit Organizations (2012). Available: http://www23.statcan.gc.ca/imdb-bmdi/instrument/4204_Q1_V14-eng.pdf [February 2015].
mailed out in June and followed up with a phone call to verify receipt. During September and October, nonrespondents are contacted by telephone up to five times, with particular effort devoted to organizations that are believed to perform R&D. The data are received and validated in November, prepared for dissemination through December, and released in January. Among the challenges that Statistics Canada faces in collecting data on R&D from nonprofit organizations are difficulties in frame construction—both identifying private nonprofit organizations with R&D
activity and ensuring that nonprofit organizations affiliated with higher education institutions or government organizations are excluded from the survey frame to prevent data duplication—House reported on behalf of Earl.
In March 2014, Statistics Canada conducted a cognitive experiment to test respondent understanding of specific concepts, questions, and terminology used in the survey. It sought feedback on respondents’ overall impressions of and reactions to the survey questions, as well as how well they understood and how accurately they could answer those questions. Finally, it also asked respondents to indicate the effort required to report the requested information. Results from this testing indicate that certain terms are better understood than others. For example, “in-house” and “out-sourced” are more easily understood than the terms “intramural” and “extramural.” In addition, respondents preferred to frame their objectives according to the field of science they were engaged in (such as medical and health sciences, or engineering and technology) rather than by socioeconomic objectives (such as defense, or control and care of the environment) as specified in the Frascati Manual. Other findings indicate that the term “funded” is preferred to “purchased” with regard to R&D activities.
Workshop Discussion of Guidance from International Experience
House suggested the small number (140) of nonprofits surveyed in Canada appeared to reflect the result of screening decisions. Perhaps, she posited, Statistics Canada includes only those likely to be conducting R&D in the annual census. Salamon emphasized that this number of nonprofit organizations did not constitute the entire number of nonprofits in Canada. He added that the nonprofit sector has 12.5 percent of the labor force in Canada, and the low number of organizations in the survey was due to the Frascati definition, which excludes most of the organizations. The SNA sectoring conventions used by the Frascati Manual fail to capture many nonprofits in most countries, argued Salamon. According to Salamon, the SNA acknowledge the existence of a large number of important nonprofit institutions that have been allocated to other economic sectors. He pointed to a United Nations manual (United Nations, 2003) that he helped develop that attempts to move the SNA in the direction of acknowledging more explicitly the nonprofit institutions that do not fall into this NPISH category.
A Note to Readers (data users) on the Statistics Canada website is presented in Box 4-2. This note was not presented at the workshop, but it does clarify that Statistics Canada has closely followed the Frascati categorization of the PNP sector. In response to the above discussion, Earl
BOX 4-2
Canadian Private Non-profit Sector
Note to Reader accompanying release of survey information.
Private non-profit organizations do not generate income, profit or other financial gain. For purposes of measuring R&D performance, private non-profit organizations include voluntary health organizations, private philanthropic foundations and private research institutes. Private non-profit organizations that are controlled and financed by government (at least 50%) or affiliated to higher education institutions are excluded from the survey population. R&D expenditures for these excluded private non-profit organizations are included in the R&D expenditures for the government and higher education sectors.
These data are not available for provinces or regions.
The private non-profit estimates as a funding sector in the gross domestic expenditure on research and development (GERD) indicators do not equal payments by private non-profit organizations for R&D performed by other organizations. The GERD source of funds data are identified by the sectors performing R&D. In some instances, organizations in the R&D performing sectors will include funds received from government-controlled private non-profit institutes and higher education affiliated private non-profit organizations and attribute it to private nonprofit source of funds data. Other reasons for differences in these estimates can include different reference periods for when the R&D was performed and funded, survey coverage and R&D performing organizations not indicating accurately their sources of funds by funding sector.
NOTE: This explanatory note to data users from the Statistics Canada website addresses the inclusions and exclusions of organizations from the private non-profit classification for the GERD. It was not presented during the workshop.
SOURCE: Statistics Canada. Available: http://www.statcan.gc.ca/daily-quotidien/131015/dq131015a-eng.htm [February 2015].
subsequently commented after the workshop that Statistics Canada uses a decision-tree approach to update and maintain the nonprofit frame. Potential units are identified based on media, responses to related science and technology surveys that identify recipients of R&D funds, other Statistics Canada surveys, associations of nonprofit organizations, tax-filing information, registration of private nonprofits and charities with the Canada Revenue Agency, Internet sources, and other aspects. Subject matter officers in Statistics Canada then review potential candidate organizations based on R&D activity—funding R&D only, performing
R&D only, or funding and performing R&D. Priority is given to profiling potential units with performing R&D activities. This profiling can include contacting potential respondents and going through a sample questionnaire with them. All units are cross-referenced to units on other frames to ensure no duplication.
Jankowski offered his knowledge of the Canadian cognitive experiment based on his ongoing communication with Statistics Canada. Respondents indicated that the terms used to describe personnel on the survey are directly from the Frascati Manual and are dated. The terms “technicians” and “technical support,” in particular, are pejorative to some respondents. With regard to intramural versus extramural research, he noted that in addition to the preference for alternate terminology, respondents also raised questions, such as whether hiring a consultant constitutes outsourcing if the consultant works alongside an organization’s staff or if other parts of the project are done in-house. Similarly, questions arose about how to count partnerships between nonprofits and scientists from universities. Jankowski said these issues regarding various employment arrangements are relevant in the United States, but are not unique to the nonprofit sector.
Jankowski further stated software development is another difficult issue in accounting for R&D. Essentially, he said, the SNA consider software as already capitalized, whereas software is the outcome from many R&D activities. He added that meeting the criteria of “uncertainty and novelty” for R&D is especially tricky in the case of software. Robyn Stone sought clarification about whether science around using a software tool was a necessary criterion to count software development as R&D. This would differ from vendor software products that are sold to nonprofit and for-profit companies, in her view. Geuna commented that software that offers a new type of service to users and represents innovation is an example of software R&D. Stone, Jankowski, and others noted that this discussion indicates a need for clarification of the distinctions between R&D, research, and innovation.
GUIDANCE: THE 1996–1997 NSF NONPROFIT R&D SURVEY
The design phase of the NSF Nonprofit R&D Survey can also be informed by lessons learned from the past implementation of the survey conducted 18 years ago. Ron Fecso, a member of the workshop steering committee, was chief statistician for NCSES when the results from that survey were disseminated. He suggested reflecting on previous iterations is the way that most repetitive surveys improve over time, but typically the iterations are far more frequent than 18 years apart.
During the last survey, NSF screened 9,112 nonprofit organizations to
develop a survey frame for the main survey questionnaire. Based on this screening, they identified a sample of 1,005 nonprofits, of which approximately 700 were performers of R&D and 283 were funders of R&D. NSF mailed surveys to the sample and received usable responses from 352 organizations for a 35 percent response rate.
Fecso indicated that the relatively small number of usable responses created concerns related to quality and usability. He said the survey yielded sufficient data for overall totals with sufficient reliability, despite having a lower response rate than other NSF surveys. However, only 233 organizations that responded were “performers” of R&D, and this small sample significantly limited how the data could be divided into various categories for analysis. He said that substantial weighting was required for all nonrespondents and the standard errors were high for those with revenue below $50 million. This made it inadvisable to compare cells in any cross-tabulation tables. Thus, Fecso concluded that one lesson learned as NSF prepares for the current survey is the sample size will have to at least be double the previous one. Fecso said, “Understanding the data is going to be really important, but understanding which data are important for decision making and how accurate they need to be is really important as well.”
Looking for insight into increasing the efficiency of the current survey, Fecso stated that approximately 86 percent of the 233 research-performing respondents to the previous survey were research institutes and university-affiliated hospitals. If the key piece of information to be measured is dollars spent on R&D, then Fecso argued, “If you take that information and think about how we apply it this time, you can get to a lot of the people and get to them very effectively. You can cut standard errors; you can do some things even maybe in the smaller domains if you can get responses from the biggest ones. In this way, you might be able to get information that makes a little more statistical sense.”
Accuracy of the data, relevance of measures, timeliness of the information, and cost are all considerations that require tradeoffs to be made and are affected by response rate. In Fecso’s view, cost is a significant limiting factor in this case because surveys are expensive and resources are limited. Thus, simply having a larger sample size is insufficient to ensure high-quality usable data. Determining how to allocate those limited resources so that the reliability and usability of the data are maximized involves making decisions about the purposes of the data. Those decisions then inform the ideal sample design for those purposes, he said.
Fecso also offered suggestions for NSF to consider in the planning phase of the new survey, while acknowledging that the design process is already well under way. First, he argued that sufficient funds are critical,
especially to staff the time-consuming work needed to obtain an acceptable response rate. Another costly phase he identified will be designing a good sample frame. However, in Fecso’s view, “the time that you put into the frame is invaluable. It cuts down significantly on downstream quality problems.”
He continued, “Sometimes you need to trade off things like coverage error to cut down on sampling error. If you cut off small dollar units in the population, you can shrink your universe to the point where your small sample size can be allocated a lot more effectively.” Obtaining preliminary information prior to implementing the survey can help to identify those nonprofits with the biggest dollar amounts devoted to R&D, he said, and reduce type I and type II errors5 in that identification process. For example, in the 1996–1997 survey, teaching hospitals only accounted for 3 percent of total R&D and, when contacted, had particular trouble in identifying a knowledgeable respondent willing to participate. Further, organizations in strata 4 and 5 were unfamiliar with NSF and with R&D, yielding little benefit for the expense of collecting data from them. Fecso recommended devoting effort and funds toward gathering better information about the target sampling frame, oversampling organizations that are likely to have R&D, developing highly efficient stratification, and considering effective cut-offs of the target population. Overall, Fecso emphasized focusing on the top R&D performers rather than simply increasing sample size across all strata, and gathering all the auxiliary information possible ahead of time to increase the response rate among this group.
Fecso closed by noting that the information quality guidelines of NSF, the statistical standards from the Office of Management and Budget, and expertise from survey design experts all will provide NSF with a great deal of instructions and guidance about the basic elements of the design.
GUIDANCE: OVERVIEW FROM SAMPLING EXPERTS
Michael Larsen, associate professor in the department of statistics at George Washington University, and Phillip Kott, senior research statistician at RTI International, discussed five major activities involved in developing an effective and efficient sample for the NSF Nonprofit R&D Survey, as well as issues tied to these activities: identifying the overall population and the target population; establishing a sampling frame and stratifying the sample; considering various sampling ideas to increase the efficiency of the sample; identifying helpful auxiliary information to gather; and making use of pilot study data to develop an adaptive sam-
______________
5In statistical testing, type I error is the incorrect rejection of a true null hypothesis. Type II error is the failure to reject a false null hypothesis.
pling plan. Larsen gave the presentation based on the work done by both him and Kott.
Population and Target Population
In planning a survey, Larsen said, one has to look at the population and at refinements that will clarify exactly the part of the population about which inferences are needed. This is the target population. Next one needs a frame, or listing of that target population, from which to sample and make contacts. Generally, one also wants to stratify that frame before sampling. Thus the survey design begins with clearly defining the population—in this case, nonprofit organizations in the United States. Earlier presentations and discussions (see Chapter 3 and the first part of Chapter 4) have pointed out many of the difficulties in determining how to define nonprofits as well as R&D, he noted. These issues will likely continue to pose challenges for NSF, he said, and the decisions that NSF ultimately makes regarding the target population will greatly influence the frame construction and the sampling strategy. Because the target population is yet to be clearly defined, Larsen said that he and Kott could not give concrete recommendations for a specific sampling scheme.
The target population should consist of nonprofits that conducted intramural R&D within a defined reference period. However, he said, it is already clear that some nonprofits should be excluded from the target population. For example, the R&D conducted by institutes of higher education will be measured through a different survey. Furthermore, Larsen pointed out that NSF will need to establish the details of the desired reference period, including whether they are interested in a calendar year or a fiscal year, and how they would like to address accounting differences between different nonprofit organizations.
Sample Frame and Stratification
Given that there does not exist a list of nonprofits that conduct intramural R&D, Larsen said, NSF will need to develop a larger pool or list of nonprofits, which contains the target population. This will be the sampling frame. He said, a key goal is to develop a sampling frame that covers the target population (without omitting too many units) and without using a list that is so large as to be very inefficient. Fecso briefly discussed this issue (see above); the section on “Data Sources Available for Creating a Sampling Frame” later in this chapter provides a detailed discussion of sources of data on nonprofit organizations that could be used to form a sample frame for the survey.
Larsen said he agrees with Fecso that making use of existing datasets
to learn more about these organizations at the outset will be valuable for limiting the size of the sampling frame and for defining strata6 to improve the sampling efficiency. For example, data from the IRS files (discussed later in this chapter) and from the 1997 survey can be correlated with outcomes of interest, including conducting intramural R&D and the resources devoted to these activities. Larsen suggested preserving the full range of variables covering the multiple financial dimensions of the population for experimentation. The variables with high correlations can then be identified and used in the development of the sampling scheme. First, defunct organizations can be eliminated. Other subsectors might be identified as unlikely to do R&D, such as non-hospital religious organizations. NSF might make a decision to eliminate such subsectors from the frame, or to include them in a stratum that is sampled lightly. Although eliminating subsectors might introduce some error, noted Larsen, it could also greatly aid efficiency. Size of the organization—amount of revenue or number of full-time-equivalent employees—might be obtained from a variety of sources and included on the frame. This information might also be used to truncate the frame. “If there is a minimum size (resources) needed for an organization to engage in R&D, not merely using data during the course of operations, but actually innovating and testing, then this information could be used to effectively truncate the frame,” stated Larsen. He suggested that a pilot study would be ideal for testing these types of cut-off procedures to confirm the assumptions.
Alternatively, strata containing very small organizations could be defined and then either excluded or sampled at a lesser rate; however, he urged, it is best to be flexible and avoid making the sample size too limited. Stratification involves dividing the survey population by key features. Many strata could be used, with the potential to be very efficient and to yield detailed information on different parts of the population. However, no perfect measure of size exists, noted Larsen. He indicated that the pilot study would help refine the full survey sample and make determinations about subsectors to exclude. Although such strategies are unlikely to be 100 percent accurate, he noted, a variety of strategies exist to cope with this issue ranging from simple to complex. One simple strategy is to use simple random sampling, while the use of auxiliary variables from the frame to check response propensities is at the other end of the spectrum. “Not doing a one size fits all approach for every strata or every size category is something that could maximize the benefit of your sample,” stated Larsen.
______________
6Strata are distinct groups or subpopulations identified on the sampling frame that can be sampled separately for the purpose of efficiency or to ensure that each subpopulation is covered by a minimum sample size.
He said NSF might also want to explore the possibility of using a multiple frame approach. Certain segments of the target population, such as hospitals and large research organizations, may be more effectively covered through a supplemental frame. This approach may assist in ensuring that the largest performers are in the frame and sampled.
Sampling Options
Larsen presented two options for sampling that NSF could employ: systematic sampling and probability proportional to size (PPS) sampling. Systematic sampling involves sorting the file of potential organizations in a certain way, such as to guarantee that some small, medium, and large organizations are represented in the final sample. PPS sampling involves choosing criteria, such as size or revenue, and using that variable to determine the probability an organization is given to be selected in the sample. Thus, bigger organizations would have a greater chance of being in the sample, while the smaller ones would have a smaller, but nonzero, chance of being selected for the sample. According to Larsen, “In a sampling theory sense, it is unbiased. It is representative of the population, but it can be much more efficient. If you want total dollars, total amount of R&D, it is really important to sample the big ones if they are a lot bigger than the smaller ones.”
Identifying and Using Auxiliary Information
Larsen argued it would be useful to identify and accumulate auxiliary data on the frame that would yield useful information about small, medium, and large organizations. Identifying a variable that is highly correlated with the outcome (amount of intramural R&D) is key to implementing the main survey efficiently, he said. The pilot study may help to identify these potential correlates, so collecting a fairly wide range of variables in the pilot would be important. If not useful, then they can be dropped from the main survey. Larsen suggested that some creativity is required.
The auxiliary data, he noted, will be important in defining the probabilities of selection for each organization on the sampling frame. This will be the case for defining strata and for sampling from those strata by systematic or PPS-based processes. Thus the measure of size used will affect the survey weights. In selecting a variable as a size measure for defining these strata and probabilities, he said it is important to be cautious and avoid using variables that can vary in an extreme fashion because that can cause problems with estimation. If this happens, he noted, then statistical tools exist to address such problems, such as adjusting or calibrating
survey weights to key control totals. “In these datasets with these hundreds of financial variables, I would encourage NSF to think about doing that kind of post-stratification or adjustment to weights that will help the sample be representative,” stated Larsen. Kott shared his concern that the size variable needs to be selected with care, noting that although size and overall revenue could yield predictable numbers of organizations in various strata, the number of volunteers that small organizations have could result in “too many small organizations receiving big weights.”
The auxiliary data will also play a role in dealing with missing data from the survey, Larsen explained. The best approach to dealing with missing data in a survey is to try to minimize it from the outset, Larsen argued, by using administrative data as a proxy for survey data that do not have to be collected. NSF is likely to have hundreds of variables from the administrative data it pulls together. Alternatively if the administrative data were highly correlated with survey data but not acceptable as a proxy, they could be used in modeling for imputation. Another way of filling in missing data involves finding a unit that is similar to the one that did not respond and trying to do some matching. The important point here, he commented, is that collecting those auxiliary administrative variables a priori will allow NSF to study some of these options as part of the pilot survey.
Larsen pointed out that missing data do not have to be handled in the same way in every stratum. For example, in strata in which the organizations are doing little R&D, nonresponse might be handled simply through a nonresponse weighting adjustment. But in the strata that include research hospitals or other large nonprofits that are likely doing R&D, a more sophisticated approach might be called for. If a unit totally does not respond, but exists, he explained, then a replacement similar in terms of key characteristics may be used. Larsen suggested some creativity. With the large database that NSF will have, he suggested experimenting with some fairly sophisticated techniques as part of the pilot test to try to find a good replacement for missing data and to rely less on statistical models to do imputation.
Larsen said useful auxiliary information could also be gathered through a two-phase sampling approach. A short screener could be administered to determine whether an organization is doing R&D. If it is conducting R&D, then it could screen in and be sampled further. One drawback to this approach, he said, is that administering such a screener might be so labor-intensive that it may be more cost-effective to administer the full survey. Another possibility is using a screener to determine simply whether the organization is still in existence, in operation, and with the same purpose as previously thought.
Making Use of the Pilot Study
According to Larsen, the pilot survey will be an extremely useful part of developing the NSF main survey. He reiterated the basic uses for the pilot:
- Study and refine stratification and allocation of the sample.
- Study the quality of segment classifications.
- Study response rates and missing data rates.
- Analyze correlations among frame variables’ outcomes—adjusting sampling plans, developing potential models for missing data, and developing some estimation techniques (such as ratio estimation).
The two-phase sampling approach can also be done in two different time periods. Larsen stated, “One way that can be done is that in the pilot, if it is engineered correctly, . . . you might be able to roll it into the further data collection later on.” With this type of preplanning, he said, the pilot data could ultimately increase the overall sample size and be included in the final analysis in a rigorous way; they would not just be used for adjusting design and verifying various aspects of the survey. Even in the absence of this approach, Larsen stated, the pilot data will be useful for studying the stratification plan, quality of segment classifications, response rates, and missing rates. In addition, the data from the pilot study will be useful for identifying variables correlated with the outcome that can be used to adjust sampling plans, develop models for missing data, and conduct estimations.
Summary and Workshop Discussion of Survey Design
Larsen reiterated that significant challenges exist in designing this survey, noting that forethought and planning are necessary to get an efficient sample design, and planning needs to be done in a way that is safe from big surprises that might arise. With many options for stratification, Larsen stressed flexibility in the use of variables and not treating all the strata the same. Simplicity has its merits because it is fairly safe, he said, but in some of the key strata where a lot of the R&D is being conducted, NSF needs to investigate more sophisticated approaches that will likely pay off. The pilot survey can give NSF some information on critical choices about sampling rates and where the bulk of the nonprofit R&D dollars are likely to be located. Finally, he indicated that designers should take full advantage of the pilot phase of the survey.
Stone noted that the sampling design will need to account for the structure of “parent” and “child” organizations. Many organizations that
fall under her association are large, with their own subsidiary organizations. These relationships will be important to understand to determine the level of analysis and population, she suggested. For example, in some cases, the corporate provider conducts research across multiple provider sites, which would be missed if the separate providers constitute the entities sampled. This question relates to how organizations file their IRS Form 990s. Paul Arnsberger of the IRS agreed that the issue will need to be addressed, adding that very large organizations such as the Red Cross or YMCA are filed as single organizations that represent many others, which in turn have group exemptions. However, in other cases, the various related groups are disaggregated and file separately. Larsen indicated that in instances where a single corporate entity represents many related organizations, determining the correct respondent for the survey within that organization would be very challenging. In addition, from a sampling standpoint, the disaggregated organizations pose a different challenge. In this case, a single organization can end up being selected for the sample while the larger corporate entity is missed.
Salamon noted that these issues around “parent” and “child” organizations exist because the database is organization-based rather than establishment-based. “If we had an organization-based database used for economic statistics, all of the employment of General Motors all across the country would show up in Detroit,” he said. “There would be more people working for General Motors in Detroit than live in Detroit or in the entire state of Michigan.” The implication for the sampling strategy is that size of the organization, a logical basis for determining a cutoff point, is going to vary depending on the organization’s structure, he said. Another participant noted that the parent organizations should have a greater chance of being selected and being represented in the sample, and that avoiding double-counting parent and child organizations can be addressed in the analysis phase. Nathan Dietz, National Center for Charitable Statistics, recommended excluding child organizations in cases where it is possible to establish that the parent organization is responsible for research, particularly if there is interest in obtaining data from smaller nonprofits that are likely not to be huge R&D producers.
GUIDANCE: DATA SOURCES AVAILABLE FOR CREATING A SAMPLING FRAME
Paul Arnsberger, a senior statistician with the Statistics of Income (SOI) Division of the IRS, presented an overview of the IRS and SOI exempt organization data products that NSF could use to help identify the population and sample for the survey of the nonprofit sector. He was followed by Nathan Dietz, the associate director of the National Center
for Charitable Statistics (NCCS) at the Urban Institute. Dietz described the work of NCCS and the data products it produces, adding value to data from SOI. Together their presentations discussed data products that may be of use to NSF in developing a sampling frame.
IRS and SOI Data Products
The SOI division of the IRS is one of 13 federal statistical agencies and produces data primarily used for tax policy research by the Congress and the U.S. Department of the Treasury. Its mission is “to collect, analyze, and disseminate data from a variety of tax and information returns filed with the IRS,” stated Arnsberger. He added that SOI is not involved in any compliance research.
Arnsberger focused his remarks on three public micro-datasets that SOI makes available—the Exempt Organizations Business Master File (EO BMF), the Exempt Organizations Financial Extract, and the Exempt Organizations Sample Studies (see Box 4-3). He noted that the EO BMF
BOX 4-3
Data Products Useful in Building a Sampling Frame
IRS data products:
- Exempt Organizations Business Master File (EO BMF)
- Exempt Organizations Financial Extracts
- Exempt Organizations Sample Studies
- Sample of 501(c)(3) organizations (990)
- Sample of 501(c)(4) organizations (990)
- Sample of private foundations from 990-PF forms
Urban Institute’s National Center for Charitable Statistics’ data products:
- Archives of IRS data: BMF (multiple versions/year) and SOI (annually)
- NCCS Core Files (1989–present)
- NCCS Cumulative Master File (1998–2003)
- NCCS-GuideStar National Nonprofit Research Database (NNRD or “digitized data” (1998–2003)
- Parts 3 and 8 Supplement (1992)
- NCCS Trend Analysis Files
- NCCS NTEE Master File
SOURCE: Arnsberger and Dietz (2014).
is an administrative file that SOI hosts on its website, but it is created by the IRS, and not specifically by SOI. The EO financial extract is created annually based on administrative data transcribed outside of SOI. However, SOI completes the data cleaning on this file so that it can be used as a statistical research file. The EO sample studies are created within SOI and are designed and intended for statistical research purposes.
Exempt Organizations Business Master File
As Arnsberger explained, the EO BMF is a monthly extract that includes a cumulative listing of all organizations with an active exemption with the IRS. All of these organizations are included regardless of their filing requirements, meaning that very small to very large organizations are a part of this data file. All of the exempt subsection code 501(c) (1) through 501(c)(27) organizations are included. Most of the information contained in the EO BMF extract is derived from the “entity portion” of the BMF, which includes static information about the organizations such as their name, address, and exempt subsection code. The EO BMF extract also includes some very limited data from Forms 990, 990-EZ, and 990-PF.7 However, these data are only included for those organizations that filed a return with the IRS and many do not. As of June 2014, the EO BMF contained 28 fields of data for 1.542 million organizations. Three of the fields contain financial data—assets, revenues, and gross receipts (which is labeled as income on the file). Arnsberger reported that the IRS has begun to purge organizations off the master file, an important step.
Exempt Organizations Financial Extracts
The exempt organizations financial extracts are created annually and include data from those currently active organizations from all subsection codes that file IRS Forms 990, 990-EZ, or 990-PF, Arnsberger explained. Another division in IRS completes the data transcription for the extract for their administrative purposes and provides the file to SOI. SOI then conducts minimal data cleaning to correct any major errors, including transcription or arithmetic errors. The EO financial extracts include data from returns processed by the IRS within a given calendar year. Because
______________
7Form 990 is an annual information return that the IRS requires of filing by most organizations exempt from income tax under section 501(c), and certain political organizations and nonexempt charitable trusts. It provides information about the organization’s finance, programs, and mission. A copy of the Form 990 is in Appendix C. Form 990-EZ is a two-page version of the Form 990 that may be used by smaller organizations. Private foundations file the Form 990-PF.
TABLE 4-2 Distribution of Records in the Exempt Organizations Financial Extracts by Source Form, 2013
| Form | Number of Records | Number of Fields | Financial Fields (%) | |
| 990 | 289,603 | 245 | 61 | |
| 990-EZ | 218,981 | 71 | 80 | |
| 990-PF | 100,484 | 179 | 71 | |
| Total | 609,068 | 495 | 68 | |
SOURCE: Arnsberger and Dietz (2014).
of filing patterns, this means that an extract will contain data from returns from more than one tax year.
Although SOI has prepared the EO financial extracts for many years, 2012 was the first year in which the extracts were made widely publicly available. Table 4-2 shows the distribution of the extracts in 2013 by filing the form along with the number of data fields available. In 2013, SOI significantly expanded the number of fields included in the EO financial extracts. They now include 245 fields from Form 990, 71 fields from Form 990-EZ, and 179 fields from Form 990-PF. The EO financial extracts currently contain just fewer than 610,000 records.
Exempt Organizations Sample Studies
Arnsberger described three files that SOI creates by selecting samples of exempt organizations called the EO sample studies. These files are particularly useful for the purpose of statistical analysis and are publicly available on the SOI website:
- The first sample is of 501(c)(3) public-serving organizations that filed Form 990s.
- The second sample is of 501(c)(4-9) organizations, all of which, with the exception of 501(c)(4)s, are member-serving organizations. This sample is primarily tailored to meet the needs of the Office of Tax Policy and the Treasury Department.
- The third sample is a sample of private foundations and uses data from the Form 990-PF.
These samples are selected from the population of currently active organizations that file IRS returns that are classified in subsections 3 through 9. The resulting population contains approximately 467,000 organizations. This excludes credit unions, cemetery companies, and other
entities of less interest to tax policy researchers. In addition, the EO sample studies include a sample drawn for a 2-year period; therefore, any organizations that file on the third year would not be included. The data file across the three sample studies is made up of 31,634 filers drawn randomly within defined strata from the population. Table 4-3 shows the distribution of this file by filing source.
According to Arnsberger, “the sample is definitely targeted to the larger organizations because it is a financial sample made to study the industry. The movers and shakers are the ones people are interested in.” Very large organizations (greater than $50 million in assets) are sampled with certainty. The very small organizations with less than $1 million in assets are sampled at a 3 percent to 14 percent rate. Across the three samples, Arnsberger noted that approximately 63 percent of all of the returns in the sample are in the certainty strata.
SOI staff complete extensive data cleaning on the data files for the EO sample studies. Whereas the EO financial extract data file is examined for more egregious errors, the sample study data files are subjected to many hours of review, he said. SOI staff correct any arithmetic errors and identify any inconsistencies within the return or with the prior year ’s return. They also engage in “allocating,” which consists of determining whether assets that have been lumped in a single category could be more specifically allocated to other categories based on other information submitted with the tax filing. The EO sample studies include many more fields of data than the EO financial extracts—1,400 fields as compared to 600 fields. Ultimately, the sample study data files include approximately 70 percent of the information from the tax forms.
Arnsberger stated that the EO sample studies provide a huge value added to the product line. He said SOI has been partnering with NCCS for a long time, and NCCS has done some remarkable things with the products that SOI creates.
TABLE 4-3 Distribution of Records in Exempt Organizations Sample Studies by Source Form, Tax Year 2010
| Form | Number of Records | Number of Fields | Financial Fields (%) | |
| 990 | 19,476 | 856 | 70 | |
| 990-EZ | 1,260 | 202 | 65 | |
| 990-PF | 10,898 | 308 | 69 | |
| Total | 31,634 | 1,366 | 69 | |
SOURCE Arnsberger and Dietz (2014).
National Center for Charitable Statistics Data Products and Systems
Dietz next discussed the data products that NCCS produces using data from SOI (see Box 4-3). First, it provides an archiving function to make IRS/SOI data more readably available for research. NCCS makes multiple versions of the EO BMF available, keeping archives of files for past years. NCCS also archives current and previous years of the EO sample studies.
NCCS Data Products
The NCCS core file is produced annually by NCCS itself. This file contains more variables than does the EO BMF, but fewer variables than do the EO sample studies. Three core files are available for each year: 501(c) (3) public charities, 501(c)(3) private foundations, and other exempt organizations. NCCS has core files going back to 1989. Dietz said, “We treat these as the standard source of financial data that researchers can use.” The 2012 core file for 501(c)(3) organizations was released in June 2014.
Dietz described several other products that NCCS has developed. NCCS produces a cumulative master file of all organizations that have ever filed Form 990s. From 1998 to 2003, digitized data were released that included a full complement of financial and other variables on Form 990 filers during those years. In addition, supplementary data files were compiled and released containing data on program service accomplishments (Part 3) and revenue sources (Part 8); however, these data have not been compiled since 1992. NCCS also produces trend files, which contain longitudinal data that researchers use for various projects. Finally, NCCS collects data for the National Taxonomy of Exempt Entities (NTEE), codes that are used to categorize organizations that have filed one of the IRS 990 Forms.
National Taxonomy of Exempt Entities
Dietz presented more background on the NTEE codes and the process of assigning those codes to organizational records. The staff of NCCS led the process of creating the NTEE codes before NCCS came to the Urban Institute, according to Dietz. Now, NCCS oversees the process of revising the codes and keeping them current. This process involves working with stakeholders on an advisory committee and an oversight committee who provide input into how the codes are working and whether they should be revised.
Since 2006, IRS “determination specialists” have been responsible for assigning NTEE codes to tax-exempt organizations after reviewing their applications (IRS Forms 1023 or 1024). The EO NTEE Program of NCSS
has conducted reviews of the quality of the code assignments using narrative data from Form 990s since 2004. It makes its own determination about whether the correct codes have been assigned to the organizations, and assigns confidence ratings to every value of the NTEE codes.
Nonprofit Program Classification System
NCCS has also developed the Nonprofit Program Classification System to code organizations’ programmatic activities based on narrative data extracted from Form 990s. Dietz said that the Form 990 contains information about the organization’s programs, but this information is generally so broad that it is often difficult to determine what an organization actually does programmatically. He said, “There is information in the narrative section of the 990s that talks about the organization’s individual programs. We extract that information, and have developed a nice little database of programs that nonprofit organizations run that we classify using a Nonprofit Program Classification system we developed.”
Dietz suggested that the most relevant information for NSF to use in putting together the sampling frame for the NSF Nonprofit R&D Survey is from Part III of IRS Form 990, Program Service Accomplishments. Dietz drew attention to question 4 in this section of the form (see Appendix C). Question 4 asks for more details about the main programmatic accomplishments that the organization has engaged in over the past year. It also asks the organization to list the amount of expenses it devoted to each accomplishment, along with grants paid out and revenues taken in that are associated with each program. This particular field is not currently available on any of the SOI data files. NCCS will make these data available to NSF and its contractors in machine-readable versions to help with developing a sampling frame for the survey.
Dietz described how NCCS plans to use these data to determine sets of keywords that can be used to identify nonprofit organizations that do significant amounts of R&D. Work is ongoing to identify the correct terms, including incorporating the ideas from this workshop. NCCS has identified three tasks that it will complete to assist NSF with designing the sample. First, Dietz said, it will work with a training sample previously used by NSF, which includes 1,800 nonprofit organizations “that we have on pretty good authority . . . have been extensive producers of R&D in the past.” Using those forms, NCCS will closely examine the narrative data that those organizations use to describe their R&D activities. Second, it will then use the narrative data from the training sample to identify potential keywords that could be used to identify likely R&D performers. Third, NCCS plans to use a final set of standard keywords to identity organizations that are likely “performers” of R&D in the broader sample.
Dietz pointed out that NCCS plans to limit the organizations it examines to the larger organizations, which are more likely to conduct substantial amounts of R&D. However, he said, using the list of keywords to identify the sample “does not lock us into a strategy of only collecting data from those organizations. . . . We can try to expand the sample so that we collect data from other R&D-producing organizations.” He emphasized the importance of ensuring the likeliest producers of R&D are heavily represented in the sample. Using machine-readable versions of all the Forms 990 will facilitate the text analysis that NCCS plans to conduct.
Dietz enumerated several challenges that NCCS anticipates as it moves forward with its work. A key challenge is the risk of false positives associated with the use of virtually any list of keywords chosen. In other words, organizations may use a keyword in their narrative descriptions of their activities, but not really engage in R&D. This problem is likely to require considerable effort in examining descriptions in detail to determine whether they should remain in the sample. A second potential challenge is that the examination of the small sample of 1,800 organizations may not yield a list of words that is adequate for identifying likely R&D producers from the larger sample.
Summary and Workshop Discussion of Existing Data Sources
Discussion among participants followed the presentations about the data files from the IRS, SOI, and NCCS. Kott noted that zero is a valid answer in an establishment survey, and encouraged NSF to not eliminate all organizations that do not do R&D. Salamon expressed concern that by using what an organization lists as its three major purposes may lead to overlooking organizations that actually engage in R&D but do not consider that activity among its top purposes. As he stated, “this is going to miss all the stuff that we have been trying to include. To me, this is a serious problem.” He argued for a wider “net” or a two-tiered approach, whereby keywords are used for organizations for which research is one of their top three purposes and then a broader set of organizations is included for whom the keywords are not the constraining factor. Kevin Cecco, IRS, reiterated that assigning certain types of organizations a smaller likelihood of being selected for the sample does not mean that they will be excluded altogether. The numbers of various types of organizations that are included will depend on the allocations assigned to them, he explained.
Jankowski explained that the data mining technique that NCCS plans to conduct is just one potential technique that may be used when the actual sample is drawn. However, a great deal of other work is ongoing to identify other potential ways of selecting the sample. Dietz affirmed
that the keywords approach is only one possible way to identify likely R&D producers but added that it “is primarily a way to identify the main producers of R&D.”
Wojciech Sokolowski asked for clarification about whether organizations or establishments were the unit of analysis because the EO BMF contains both, referring to earlier discussions about the structures of certain nonprofit organizations. This can have particular significance when many establishments are part of one parent organization, he asserted. Dietz responded that NCCS intends to take this into account as best as it can during its analysis.
The presentations and discussions summarized in this chapter yielded a number of suggestions for designing the sample for the NSF Nonprofit R&D Survey, while acknowledging that significant challenges remain. Many participants emphasized using the pilot and design phase wisely to maximize the efficiency of the sample and to make preparations for successful implementation.


