
2
A Profile of the Nonprofit Sector in the United States
Examining the nature of the nonprofit universe is a natural first step in determining how to proceed with the design of a survey intended to capture the research and development (R&D) activities of this sector. Presenters in this opening session of the workshop shared that much of the existing literature and data sources, including the National Science Foundation (NSF)’s National Patterns of R&D Resources (National Science Foundation, n.d.-a), have hidden or distorted the true size and complexity of the sector. Despite these challenges, this session’s presenters have developed a picture of the sector through in-depth research that shows the significant impact that the nonprofit sector has in the United States. Their presentations showed that the U.S. nonprofit sector
- is vast in scope and size with the largest workforce (paid plus volunteer) of any sector in the country;
- has a smaller workforce, as a percentage of total workforce, than the nonprofit sector in many other countries;
- consists of a diverse range of public-serving and member-serving organizations;
- has experienced dynamic growth in revenue and employment over an extended period;
- brings in $1.3 trillion in revenue from government sources, fees and charges, and private giving; and
- receives most revenue from fees and government sources but is working with philanthropic donors who are engaging with the sector in new ways.
Lester Salamon, director of the Center for Civil Society Studies at Johns Hopkins University and chair of the workshop steering committee for the workshop, described the nature, size, and scope of the nonprofit sector. He began by offering his views on why the sector has been historically difficult to assess. According to Salamon, “the nonprofit sector has been the lost continent on the social and economic map of modern society,” primarily because existing national and international data sources mask or distort the picture of the nonprofit sector.
CHALLENGES WITH EXISTING DATA SOURCES
According to Salamon, existing statistical lenses through which we view the nonprofit sector obscure or hide key facets of its size and shape, and produce a distorted view of its nature. For example, the Exempt Organization Business Master File (EO BMF)1 maintained by the Internal Revenue Service (IRS) provides the only full listing of nonprofits in the United States; however, this system has historically had no means for purging organizations. Organizations were continually added to the list without regular purging since its creation in 1914. Although the IRS has recently improved this situation, this listing cannot easily be used for understanding the scope of the sector and is highly inefficient for sampling for research purposes.
The international System of National Accounts (SNA), the set of guidelines through which the United States and all other countries around the world generate their estimates of gross domestic product (GDP), are also problematic from the point of view of creating a valid picture of the nonprofit sector. SNA include a categorization of nonprofit institutions, but according to Salamon, “It’s not just partly wrong; it is grossly wrong.” This is largely due to the fact that most economically significant nonprofits are buried within the corporate sector in national accounts because the SNA categorize any organization that sells goods or services on the market as a corporation. As a result, organizations, such as universities that charge tuition, are counted among other large for-profit corporations, leaving only those organizations that are funded mostly by charity explicitly identified as nonprofit institutions in a Nonprofit Institutions Serving Households (NPISH) sector. As a result, SNA data on Germany suggest that its nonprofit sector constitutes less than 1 percent of its GDP, despite the fact that Germany has several huge free welfare associations
______________
1The EO BMF is an extract prepared monthly by the IRS that includes a cumulative listing of all organizations with an active tax exemption. This file is discussed in more detail in Chapter 4.
delivering much of the daycare, hospital care, nursing care, and other services in the country.
Within the United States, he said, the masking of the true scale of the nonprofit sector takes several forms. The U.S. Bureau of Economic Analysis (BEA) has long treated nonprofits as part of the household sector, distorting not only the picture of nonprofits, but also the picture of households. For example, household savings rates include the assets held by foundations. Another national data source, the Bureau of Labor Statistics (BLS) Quarterly Census of Employment and Wages (QCEW), until very recently failed to differentiate between for-profit and nonprofit places of employment, he said, and, therefore obscured the extent to which the nonprofit sector is contributing to the growth of employment. Finally, the IRS Form 990, which provides virtually all of the available financial data about nonprofits, provides a distorted view of the source of nonprofit revenues. Government support provided in the form of contracts or vouchers, including Medicaid and Medicare funds, is counted as program service fees and merged with private fees because they are funneled through the market. The result is that the accounting of how much funding comes from government, relative to philanthropy and fees, appears smaller than it actually is. Salamon’s concern is that this distortion can seriously confuse policy makers about the importance of government support and the ability of the nonprofit sector to make up for potential reductions in government spending.
Salamon said the Center for Civil Society Studies is currently engaged in collaborative action to address some of the problems with these data sources. They have worked with the BLS to help disentangle nonprofit data from employment datasets and are also helping to develop statistical tools to be able to better use data from the U.S. and other nations’ national accounts. At the international level, Salamon and his team have worked with the United Nations Statistics Division to create a United Nations handbook on nonprofit institutions (United Nations, 2003) to assist countries in pulling nonprofit data from other sectors in their national accounts. BEA has begun to make some changes based on guidance from this handbook, and BLS is exploring ways to publish wage and employment data for the nonprofit sector.2
Looking at NSF’s National Patterns of R&D Resources, Salamon shared his view that the way that NSF has produced this accounting of U.S. R&D has resulted in “defining the nonprofit sector away.” In particular, the R&D carried out by nonprofit hospitals and higher education institutions
______________
2BLS’ QCEW recently published experimental data that separates employment and wages by the profit and nonprofit sectors. The link to this new product is http://www.bls.gov/bdm/nonprofits/nonprofits.htm [February 2015].
is not included in NSF’s reporting of “other nonprofit” R&D. Rather, these institutions are merged with data on for-profit and public hospitals and higher education institutions, obscuring their character as nonprofits and minimizing the estimate of nonprofit R&D. He said this is particularly problematic for the measurement of nonprofit R&D because nonprofit universities and hospitals conduct a large proportion of the R&D among nonprofits. Salamon argued that a key goal of redesigning the NSF Nonprofit R&D Survey should be to make what is happening in this sector visible to the wider community.
A PROFILE OF THE NONPROFIT SECTOR
Despite these data problems, Salamon has conducted research to describe the nonprofit sector. His work is published in a book titled America’s Nonprofit Sector: A Primer, Third Edition (Salamon, 2012). He presented the results of this work organized into five key areas: size and scope of the sector, diversity of the sector, dynamism of the sector, international position of the U.S. nonprofit sector, and revenue picture of the nonprofit sector.
Size and Scope of the Nonprofit Sector
Salamon’s work reveals that the nonprofit sector is significant in size both in terms of contribution to economy as well as workforce. Using data gleaned from the EO BMF, approximately 2 million nonprofits in the United States together account for approximately $2 trillion in revenue. The nonprofit sector also accounts for 13.5 million paid workers. As shown in Figure 2-1, when the estimated 4.5 million volunteer workers (presented as full-time equivalents) are added to the 13.5 million paid workers, the nonprofit sector has the largest workforce in the U.S. economy (of the 18 sectors into which statisticians categorize the workforce), ahead of sectors such as retail and manufacturing. The figure shows that even when ignoring volunteer workers, the nonprofit sector is still the third largest employer in the nation. According to Salamon, the nonprofit sector “is a major actor. It needs to be brought into the picture of R&D as well as into the picture of labor and into the picture of GDP contributions.”
Diversity of the Nonprofit Sector
The nonprofit sector is comprised of a highly diverse group of organizations. To help characterize these organizations, Salamon grouped them into two broad categories—public-serving organizations and member-
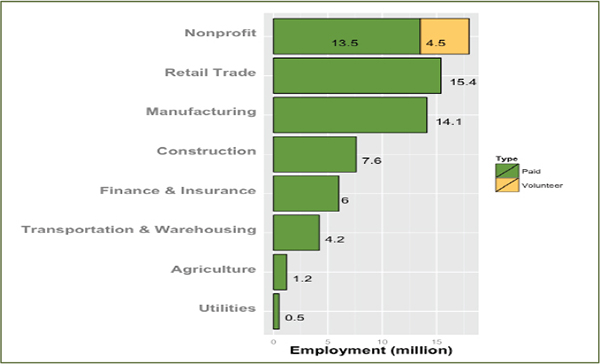
FIGURE 2-1 Employment in the nonprofit sector compared with selected sectors, 2006 (in millions).
SOURCE: Adapted from America’s Nonprofit Sector: A Primer, Third Edition, published by Foundation Center. Copyright © 2012 Lester M. Salamon. Used by permission.
serving organizations. Public-serving organizations can be thought of as charitable organizations, and they are both tax-exempt and eligible to receive tax-exempt gifts. Member-serving organizations are tax-exempt, but are not eligible for tax-deductible gifts. Because they have a public-serving purpose, Salamon includes 501(c)(4) organizations3 within the public-serving category, even though they are not eligible to receive tax-exempt contributions. The two types of nonprofit organizations and their subcategories are shown in Box 2-1. Salamon indicated that most research within the nonprofit sector focuses primarily within the public-serving 501(c)(3) and 501(c)(4) organizations. He suggested that NSF will need to make a determination about whether or not to capture the member-serving nonprofits in the nonprofit R&D survey.
The 501(c)(3) organizations, referred to here as public-serving service
______________
3501(c)(4) organizations, such as civic leagues, homeowner associations, and volunteer fire companies, as well as organizations that engage in substantial lobbying efforts, are tax-exempt if they meet the requirements but are ineligible to receive tax-exempt gifts.
BOX 2-1
The Nonprofit Sector, Types of Organizations
| Public-Serving Organizations | Member-Serving Organizations |
| Service & Expressive 501(c)(3) | Labor Unions 501(c)(5) |
| Social Welfare & Action 501(c)(4) | Business Leagues 501(c)(6) |
| Funding Intermediaries 501(c)(3) | Social & Recreational 501(c)(7) + |
| Religious Organizations | Fraternal Societies 501(c)(8) + |
| Mutual Benefit 501(c)(9) + | |
SOURCE: Adapted from America’s Nonprofit Sector: A Primer, Third Edition, published by Foundation Center. Copyright © 2012 Lester M. Salamon. Used by permission.
and expressive organizations, are themselves quite varied. For example, these organizations represent interests ranging from arts, culture, and humanities to the environment. They also include hospitals, schools and daycare centers, and soup kitchens. Using categorizations from the National Taxonomy of Exempt Entities4 (Urban Institute, n.d.), the human services category of the service and expressive nonprofits, by itself, is broken down into 13 different types. The service and expressive nonprofits “are the action arm of the sector,” stated Salamon.
There are three other types of public-serving organizations that deserve some mention, he said. The social welfare and action 501(c)(4) organizations include groups that can lobby substantially on legislation. Funding intermediaries, such as charitable foundations and the United Way, comprise another category of public-serving nonprofit. Because of their role as intermediaries, their work is often difficult to capture accurately because they generally pass funds through to other nonprofits. This can result in double-counting of R&D funds if care is not taken, Salamon warned. These organizations may conduct some research themselves, but much of the money is paid to others, such as nonprofit universities, to do the research. This means that dollars are counted when they come to the intermediaries and the same dollars are counted again when they come into the university. This measurement issue is exacerbated because funds
______________
4This taxonomy is discussed in more detail in Chapter 4.
given to a foundation may be counted in one year, but the money may not be all spent or passed to other nonprofits in the same year. Finally, religious congregations are part of the public-serving nonprofit organizations, primarily serving as places of worship and not as public service providers. These entities are automatically tax-exempt and do not have to seek approval from the IRS for this status. Salamon suggested that “if we want to focus on the doers of R&D, we want to focus on the service and expressive organizations—the 501(c)(3)s.”
Salamon used Figure 2-2 to show his best estimates of numbers of nonprofit organizations by category and to provide an indication of the relative scale of each within the entire sector. Overall, public-serving organizations account for approximately 1.6 million of the estimated 2 million nonprofits in the United States. The wide variability within the nonprofit sector in terms of purpose, function, and size have important implications for sampling and stratification in order to capture a cross-section of the sector, as discussed in Chapter 4.
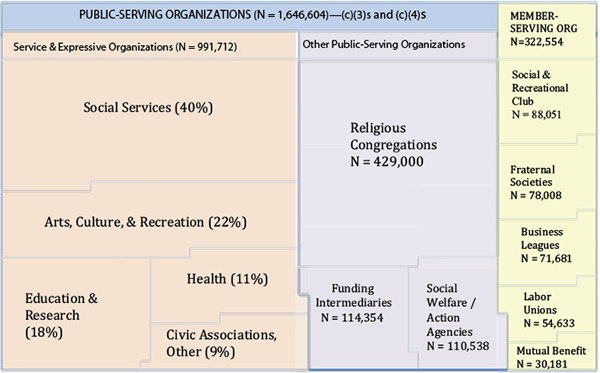
FIGURE 2-2 Profile of U.S. nonprofit organizations, by number of organizations.
SOURCE: Used by permission of Dr. Larry McGill, Foundation Center, who adapted it from data in America’s Nonprofit Sector: A Primer, Third Edition, published by Foundation Center. Copyright © 2012 Lester M. Salamon.
Dynamism of the Nonprofit Sector
The nonprofit sector sometimes has a reputation for being “laggard and not entrepreneurial,” said Salamon, but he noted the data tell a different story. Whereas the U.S. economy has been growing at an average rate of 3 percent per year in real terms, the nonprofit sector has been growing faster at 3.6 percent. Further, nonprofit revenue grew 20 percent faster than overall U.S. GDP during the 1977 to 1996 period and 33 percent faster during the 1997 to 2007 period. This growth pattern was also largely sustained during the recession.
Except for one year in which they were nearly equal, growth in employment in the nonprofit sector (based on BLS data) has exceeded growth in private-sector employment in every year of the past decade, even through the recession. These patterns are shown in Figure 2-3. Salamon said that the nonprofit sector ’s strong employment growth was helpful to the U.S. economy as for-profit companies experienced losses in employment. The shift in the U.S. economy toward services, the aging of the U.S. population, and the growth of women’s participation in the
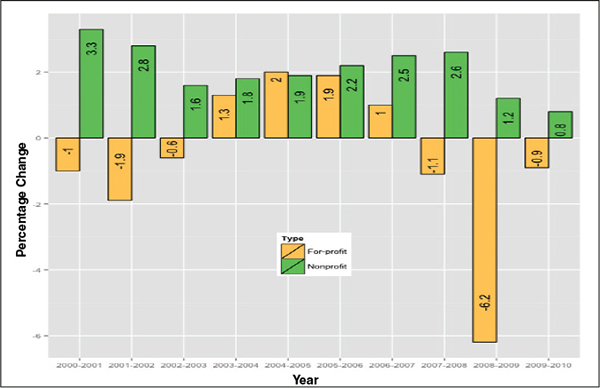
FIGURE 2-3 Annual changes in employment, nonprofit versus for-profit, 2000–2010.
SOURCE: Salamon, Sokolowski, and Geller (2012).
workforce have all contributed to a greater demand for the types of services that nonprofits provide. He added that the for-profit sector in those same areas of service has also experienced growth.
Overall, Salamon’s data show that nonprofit revenue grew 53 percent from 1997 to 2007, compared to growth in the private sector of 32 percent during the same period. This represented about $457 billion in growth over the period. Although growth in the health field (53 percent) was important, other fields in the nonprofit sector experienced significant growth as well. Social services revenue grew by 51 percent, and education and research grew by approximately 50 percent. The primary source of growth was in fees (58 percent), while 12 percent came from growth in philanthropy and 30 percent from government sources. In recent years, Salamon pointed out, government support for nonprofits has been decreasing, forcing nonprofits to increase their commercial activities. Social services, in particular, used to be more fully funded by government, but as this support has diminished, these nonprofits are increasingly charging fees for services such as nursing home care or daycare slots.
The International Position of the U.S. Nonprofit Sector
Salamon also presented data to compare the U.S. nonprofit sector to that of other countries around the world. He stated, “I think Americans have taken great pride in asserting that we are unique in the world in having a nonprofit sector. . . . We think of the Europeans somewhat disdainfully as having made a wrong turn somewhere in their history in creating welfare states, whereas we have survived and prospered because we have relied on the nonprofit sector.” However, a number of other developed countries’ nonprofit sectors exceed the United States in terms of workforce, both paid and volunteer. The Netherlands tops the list with the nonprofit workforce (paid and volunteer) constituting 15.9 percent of the country’s economically active population. The United States, by contrast is ninth on the list, behind countries such as Belgium, Canada, Sweden, and the United Kingdom, with approximately 9 to 10 percent of the U.S. workforce in the nonprofit sector.
Salamon indicated that many European countries do not have a “welfare state” but rather have a “welfare partnership.” He stated that these nonprofit sectors are quite strong and are also a source of pride. For example, Salamon stated individuals associated with nonprofits in the Netherlands take exception with being characterized as simply “an arm” of the government, which provides 60–70 percent of their funding, and instead hold up their long history and tradition as “private initiative organizations.”
Revenue of the Nonprofit Sector
U.S. nonprofit revenue comes from three major sources—government support, private giving, and fees and charges. Government support is comprised of grants, fee-for-service contracts, and reimbursements and vouchers, many of which come from Medicaid and Medicare. Private giving includes individual giving, foundations, and corporate giving, as well as federated funders such as the United Way. Finally, fees and charges are payments for services. These also include membership dues and earnings from investments.
Salamon presented his research on the amount of nonprofit revenue for each category. He reported that private giving from all sources constitutes 10 percent of total revenue. Government sources of revenue are approximately 38 percent of the total. Fees and charges are the biggest source of nonprofit revenue at 52 percent of the total. In dollar terms, as of 2007, foundations provided approximately $32 billion out of a total of $1.3 trillion total, a proportion of the total that is far lower than many in the United States and abroad believe, by Salamon’s account. Approximately $500 billion in revenue comes from government sources and $681 billion from fees. Salamon noted that his work involved making adjustments to correct IRS Form 990 reporting, for example, to remove Medicaid and Medicare dollars from the fee category and to put them in the government category.
The proportions of revenue source vary across the sector and by type of organization, as shown in Figure 2-4. Education is heavily dependent on fees, whereas health care receives nearly equal amounts from government and fee sources. The revenue source for social services has shifted over the years. Historically, social services received a greater proportion of revenue from the government, but now more revenue comes from fees than government. Civic and other nonprofits are still primarily funded by private giving.
Conceptualization of R&D in the Nonprofit Sector
According to Salamon, data on the full scale and diversity of the nonprofit sector suggest the need for a more complete and robust treatment of the nonprofit sector in NSF’s R&D reports and for a broader conceptualization of R&D than has been suggested in official definitions to date. Many nonprofits are engaged in researching and applying new techniques of intervention in the broad area of human services, improving recovery from addictions, finding new ways to promote economic independence, solving significant health issues, and generally improving life chances. In an increasingly service-oriented economy, Salamon said that this human services R&D deserves as much attention as the traditional technology
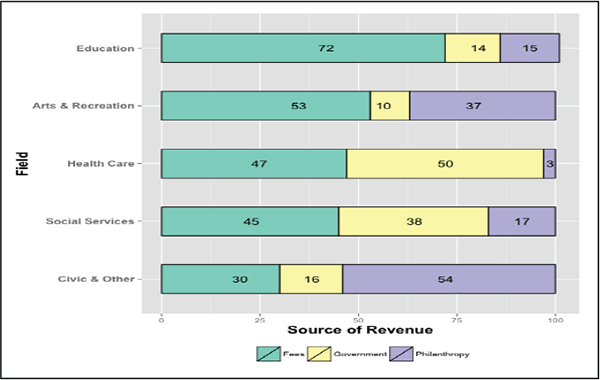
FIGURE 2-4 Nonprofit revenue patterns by field.
SOURCE: Adapted from America’s Nonprofit Sector: A Primer, Third Edition, published by Foundation Center. Copyright © 2012 Lester M. Salamon. Used by permission.
and hardware R&D. He maintained that the nonprofit sector is a huge generator of human service R&D and deserves to be identified as such.
UNDERSTANDING THE ROLE OF PHILANTHROPIC GIVING IN R&D PERFORMED IN THE NONPROFIT SECTOR
Many believe that private giving, particularly from foundations, constitutes a larger proportion of the revenue in the nonprofit sector than is actually the case, observed Salamon. First, total foundation assets, though important, are relatively small when compared to the assets of other parts of the economy. For example, as of 2007, nonfinancial businesses had a total of $17 trillion in assets, commercial banks had $11 trillion, mutual funds had $7.8 trillion, and foundations had $682 billion. Salamon pointed out that the complexity and fragmented nature of the philanthropic system may limit how much can be financed through that vehicle.
In her presentation, Susan Raymond, executive vice president of
Changing Our World, Inc.,5 and a member of the workshop steering committee, said she agreed that funding from private philanthropy is significantly less than government or commercial dollars in research and scientific activities. Additionally, she stated that little is known about how funding moves into research activities within nonprofits. This lack of data significantly limits what is known about individual philanthropic giving and its ties to research. Despite this paucity of data, she said, there are some unique aspects to philanthropic support for nonprofits that make it attractive to those who might be interested in funding R&D activities. Flexibility is the key advantage that philanthropic dollars have over traditional sources of revenue. Furthermore, traditionally the philanthropic community has a greater willingness to take risks than other funders, being able to invest in very early stage inquiry. However, Raymond expressed her concern that an increased focus on measurable impact of funding could reduce this risk-taking, adversely affecting the flexibility that private giving affords.
The Landscape of Current Philanthropic Giving
In the second part of this session, Raymond laid out the landscape of current philanthropic giving. Most of this giving comes from individuals, which includes individual bequests. Together individual philanthropic giving constitutes 80 to 85 percent of the money. The remainder of the philanthropic giving comes from two sources, foundations and corporate—both much smaller than the individual giving. Corporate giving is the smallest—only a third of that contributed by foundations. Corporate giving is difficult to track and likely underestimated because corporate commitments now originate not only in company foundations but also in marketing and communications budgets. Those resources are not tracked by traditional giving datasets. Foundations are a third component of the private philanthropic community. The largest portion of increase in the proportion of foundation dollars in recent years is likely a result of the entrance of the Bill & Melinda Gates Foundation and the foundations of several other ultra-high net worth individuals. Overall, Raymond argued, these data show that it is important to understand how and why individuals give, and to learn more about their interest in science or research.
Existing data on foundation funding for R&D has some inconsistencies, Raymond said. Data from the Foundation Directory (Foundation Center, 2013) indicate that science and technology foundation giving was approximately $585 million, or about 2 percent of all foundation giving.
______________
5Changing Our World, Inc. is a philanthropy consulting group, working with nonprofit clients to strengthen revenue strategies.
However, the Council on Foundations (Council on Foundations, 2013) reports that $1.6 billion is given just in medical research grants alone. Raymond observed that she found it interesting that the Council on Foundations’ numbers broke out research funding only for the health sector. She said, “The fact is that even when it comes to foundations, which do have to report and for which we do have reasonable numbers . . . it is very obscure as to how much money we’re actually talking about in research.” She further added that identifying the actual research activities of foundations would be quite difficult and likely require reviewing every single grant of the major funders as provided on their IRS Form 990s.
The 100 largest foundations have an average grant amount that ranges anywhere from $400,000 to $600,000. This number far exceeds the average grant size of the remaining 1,022 foundations in the Foundation Center sample, which together have average grant sizes ranging between $95,000 and $159,000. However, Raymond noted that a great deal of research comes with a much higher price tag, and hence the costs of research are much higher than the average grant level. Thus, funding such activities may involve philanthropists working together or with nonprofits seeking funding from an array of sources, only one of which might be philanthropic giving.
Overall, however, foundation funding for science and technology activities as a percentage of total foundation funding has decreased between 1998 and 2011. Raymond’s work indicates that this decrease is directly related to the recent recession, which prompted a greater focus on services and programs over research. Foundations that had been engaged in more innovation and experimentation were more likely to move away from risk-taking and toward their core missions, she explained. A compounding problem is that the fastest growing sources of philanthropy are donor-advised funds housed within financial houses and other organizations. The sources and areas of interests of these funds are not publicly available.
“The problem is that it is extremely opaque now in the philanthropic sector exactly where the money exists, where it is moving, and how it’s moving into research or anything else,” Raymond stated. Nevertheless, she said she sees cause for optimism in the passion for giving that she sees in particular areas, such as in associations focused on certain diseases, a sector that recovered more quickly from the recession than other areas.
Although funding from private philanthropy is significantly less than government or commercial dollars in research and scientific activities, Raymond observed that there are some unique aspects to this approach that make it attractive to some nonprofits because of flexibility and the risk-taking nature of philanthropic community.
Changing Philanthropists and Changing Expectations
Over the past 3 to 5 years, Raymond said she has observed tremendous change in the way that high net worth individuals, corporate foundations, and private foundations think about giving. Increasingly, the focus is on investing and not simply on “writing checks.” This shift in perspective significantly alters how money moves, what people expect those dollars to do, and how people and institutions in the nonprofit arena relate to each other.
The face of the high net worth individual philanthropist is changing in ways that affect the nature of giving and the expectations that come with it. According to Raymond’s accounting, of the top 50 American philanthropists, 11 were under the age of 65, with all of their wealth coming from technology. In 2012, billionaires under the age of 40 made new gifts of $1.1 billion. As recently as 30 years ago, most high net worth individuals under the age of 45 had inherited their wealth; today, 69 percent of those individuals have earned their wealth. Earning this wealth rather than inheriting it and giving at a younger age than in previous generations have changed the expectations that individuals have when they give, according to Raymond.
A recent survey conducted by Changing Our World indicated five themes that characterize the expectations of very high net worth individuals who give, as follows:
- A majority of high net worth individuals tend to view giving as investing in a long-term gain, rather than as a charitable gift.
- These individuals are interested in the measurable impact they will have in terms of fixing problems. They want feedback on their giving that includes facts and figures and reporting on key performance indicators that resemble what they receive in their business and investing settings.
- Individuals who completed this survey also indicated that they wanted to be engaged in the process. They want to bring their skills and expertise to problem solving, not just their money.
- These individuals are concerned with sustainability of the effort and how the work they support will go on after they stop providing funds to it.
- Respondents cared about accountability, not only for careful stewardship of dollars given, but also for the organization as a whole.
Raymond observed that greater numbers of donors seem to be sharing these expectations. Even donors at lower levels of giving are now demanding evidence of results.
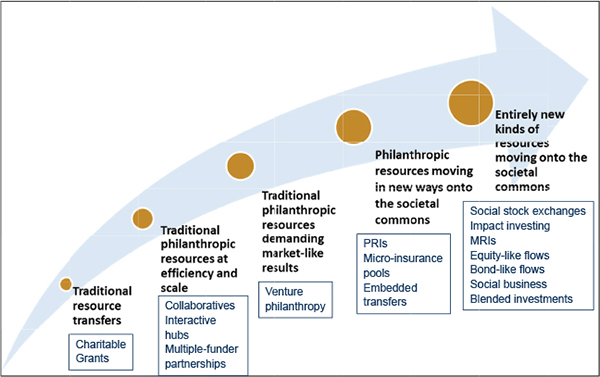
FIGURE 2-5 The arc of innovation in philanthropy.
SOURCE: Raymond (2013).
Complexity of the Philanthropic Market
The philanthropic market is growing in complexity, according to Raymond. Traditional institutions, such as large- and small-staffed foundations and corporate giving, continue to exist but so do entities with an expanded philanthropic focus. They include corporate marketing, high net worth individuals, donor-advised funds, and foundations of associations. Entities that have a social finance focus are also part of the picture and include impact investing groups and specialized funds inside of investment banks, among others. These entities are associated in various ways with innovation in philanthropy as shown in Figure 2-5. In a number of cases, the dollar amounts from these entities are quite large. However, they are hard to identify and survey, and many are new and nontraditional types of organizations. Raymond suggested that using a framework of questions to compare various organizations, their funding, and their work might help identify the involvement of a nonprofit engaged in research.
Raymond noted that although innovation does generate funds that move through these vehicles in interesting ways, it can be problematic to rely on philanthropy for a core of research. Research can have a long timeframe, while the funder engagement wanes over time. In addition, outcomes from research, such as those that result from complexity or fail-
ure, can help the research progress but are not the type of outcomes that engages donors. Finally, research results are difficult to map onto philanthropic dollars. It is rare that a particular research result can be attributed to a particular donor dollar. Despite these challenges, philanthropic giving can involve significant dollars with flexibility. This approach to funding development has the opportunity to increase thinking about innovation and better ways to solve problems, as well as to produce leadership and advocacy.
IMPLICATIONS FOR THE NSF NONPROFIT R&D SURVEY: DISCUSSION AND SUMMARY
Following the presentation of the profile of the size and complexity of the nonprofit sector and its funding sources, workshop participants engaged in discussion regarding the potential implications for the NSF Nonprofit R&D Survey. One discussion topic addressed whether and how NSF plans to focus on particular segments of the nonprofit sector (rather than the entire sector) in its survey. John Gawalt, director of the NSF National Center for Science and Engineering Statistics (NCSES), stated that the sampling decisions have not been made—he and his staff are still gathering information with which to make those decisions. This workshop is part of that process, he said. John Jankowski, program director at NCSES, added that the survey of R&D in higher education will continue, and data from university-affiliated research institutes or hospitals will continue to be collected in that survey. However, he suggested that those institutions could receive multiple codes or be cross-tabbed, so that data could be aggregated differently for different purposes, such as including this research under higher education or as part of the broader nonprofit sector. A similar approach could be used with the Business R&D and Innovation Survey. Salamon strongly encouraged this approach of reporting the nonprofit higher education and hospital data not only as part of hospitals and higher education, but also as part of the nonprofit sector. He also encouraged NSF to broaden the sampling of other types of nonprofits beyond the scientific research laboratories to cover, as well, the broad array of human services R&D taking place elsewhere in the nonprofit sector.
Salamon also suggested that it would be important for NSF to learn about where, and in what form, R&D takes place within the nonprofit sector. R&D may take on different forms than what is typically thought of as R&D. Specifically, nonprofit organizations may be researching and implementing innovative changes in service delivery rather than producing new “widgets,” he suggested.
In addition to the source of funding, the administrative control of the
activity is another important dimension for NSF to consider, according to Paul David, Stanford University and a member of the workshop steering committee. For example, hospitals may be administratively controlled by universities rather than business corporations. Another dimension to consider is the character of the activity itself. David cautioned, “Each of these institutions reflects an interest and a view of what is going on beneath the numbers . . . and that their interactions may also be informative about what the nature of the activity is.” Choosing a fixed set of boxes or one particular lens through which to view complex organizations is “necessarily going to produce distortions,” according to David.
By way of example, David explained that the Frascati Manual6 defines a nonmarket organization as one that is not covering more than 50 percent of its cost with the price of its products or services. He suggested considering producers of digital services that have a high fixed initial cost at start-up. These entities can seem to be nonprofit at the outset and then later in their life cycles no longer meet those criteria as they earn profits. Wojciech Sokolowski, Center for Civil Society Studies at Johns Hopkins University, suggested the definition of nonprofit institutions in national accounts, both in the SNA and National Income and Product Accounts structures, is determined by whether the organization is legally prohibited from distributing its profits to stakeholders rather than by its income structure. He stated, “I think part of the confusion is that if we use the income structure criterion to classify the nonprofit to institutional sectors, that criterion may change from year to year. Basically, it’s like a wild goose chase.” David clarified that some countries and organizations follow the Frascati Manual strictly, while others develop additional criteria to address the anomalies that occur. Overall, he suggested it will be important to try to find a relatively stable “structure of bins into which you can throw things,” but added that finding a single perfect system may not prove possible.
The presentations and discussions in this session of the workshop led to a clearer understanding of the nature and complexities of the nonprofit sector and recognition that their R&D activities are both worthwhile and challenging to capture. The presentations provided descriptive data regarding the particular sectors and sources of revenue within the nonprofit domain most involved with R&D. Understanding the scope of nonprofits, their impact on the economy and the pathways through which they are funded provides context for considering the types of activities that constitute R&D in this sector.
______________
6The Frascati Manual is an internationally recognized methodology for collecting and using R&D statistics developed and published by the OECD. This manual is discussed in more detail in Chapter 4.
This page intentionally left blank.


