
3
Key Components of a Performance Standard for BioWatch
This chapter explores fundamental components of performance standards for real-time polymerase chain reaction (PCR) assays and discusses basic principles that a pathogen detection standard would need to take into account to serve the BioWatch program’s needs. The chapter compares approaches taken by existing guidelines, as well as performance characterization work undertaken at Los Alamos National Laboratory (LANL), and provides committee suggestions.
The committee determined that a PCR standard to characterize assay performance and conduct validation, applicable to BioWatch, would need to meet the following basic goals:
- Establish that the assay has a sufficient limit of detection and sensitivity to detect the release of a tested biothreat agent at a program-relevant concentration above the baseline of environmental background. The BioWatch system was not deployed with the goal of detecting a single airborne particle, but rather to monitor for a substantial release event. On the other hand, low concentrations of agents must be detectable given the variability introduced by wind dispersion and collector siting, as well as losses and inefficiencies in the subsequent analytical steps leading to the PCR reaction, should there be an environmental pathogen plume.
- Establish that the assay has sufficient specificity to not cross-react with nontargeted strains and background organisms or materials, within acceptable program false positive and false negative rates.
- Be sufficiently robust for routine operational use by BioWatch jurisdictional laboratories and be otherwise acceptable to program users.
The simple flowchart in Figure 3-1 indicates some of the main steps in the process of establishing whether assay characteristics meet these goals.
TRADEOFFS IN PERFORMANCE AND ASSAY PURPOSE
Under the current BioWatch program, an initial screening assay (one signature per assay; assay and materials provided through Department of Defense [DOD] Critical Reagents Program [CRP]) is followed by a secondary assay (three or more signatures in the assay set; assay and materials provided through Centers for Disease Control and Prevention [CDC] Laboratory Response Network [LRN]) if the initial assay produces a positive result.1 There is an inherent tradeoff between the properties of sensitivity and specificity—as the assay’s true positive rate increases so does the false positive rate. Therefore the specificity of the assay decreases. A screening assay should prioritize sensitivity. If a nucleic acid from a tested pathogen is present then the assay should detect it and minimize the rate of obtaining a false negative result. A false positive result is less detrimental at this stage because all positive screening results will proceed to a subsequent secondary assay. A secondary assay for verification or confirmation, on the other hand, should have high specificity. The assay needs to be able to precisely distinguish between the tested pathogen and closely related but nonpathogenic organisms that the assay should not detect, minimizing the rate of a false positive result being passed forward for action. While this type of approach has been the general compromise between the two assays, the secondary assay should and likely can be comparable in sensitivity with that of the screening assay. The analytical system must be able to achieve a target limit of detection (LOD) to minimize a situation in which the primary assay yields a positive result but the secondary assay produces a false negative that causes the primary result to be discounted. The combination of the initial screening and secondary assays function together to provide an overall high sensitivity and high specificity. Several participants in BioWatch jurisdictions from whom the committee heard during its data-gathering indicated that the program’s evolution to using a
___________________
1 The signature used in the initial screening assay is not necessarily the same as the set of signatures used in the secondary assay, although there may be places where these signatures overlap for some tested agents. Both screening and secondary assays could be provided through the DOD CRP, in which case the committee understands that the secondary assay would repeat the screening signature. The program currently uses the LRN secondary assay, which targets a different set of signatures.
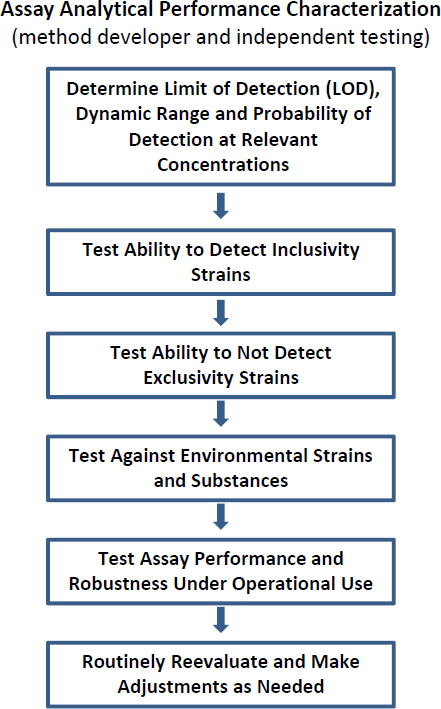
FIGURE 3-1 Flowchart representing steps in assay analytical performance characterization.
two-step assay process has improved their experiences with regard to preliminary positive results and downstream decision making.
Although the same core performance standard and validation framework is appropriate for both types of PCR assays, the BioWatch program could consider the use of serial testing or “tiers” of validation testing that emphasize different parameters based on the assay’s actual intended use. For example, stringent characterization of the minimum concentration of
inclusivity strains that can be reliably detected with a sufficiently high probability (assay sensitivity) could be prioritized during development and validation of a screening assay along with a basic set of inclusivity, exclusivity, and environmental strains. Because of the importance of specificity to the performance of a secondary assay, the program might conclude that it is useful, for example, to conduct laboratory validation using additional inclusivity and exclusivity strains than were used for an initial screening assay. An assay meant to be used for a secondary level of verification or confirmation could thus be validated in the laboratory against a second tier containing additional inclusivity, exclusivity, and environmental strains in order to demonstrate the requirement that this type of assay have high specificity.
The report focuses the majority of its discussions on the current screening/secondary assay model used by BioWatch for the practical reason that this is the current approach and is likely to remain so for at least the near future. However, the report raises other possible options, particularly for secondary assays, both here and in Chapter 5, for consideration by BioWatch and its network of stakeholders.
ASSAY SENSITIVITY AND LIMIT OF DETECTION
To be suitable for BioWatch’s mission, a performance standard must specify the process for determining or confirming that the assay’s sensitivity meets program targets. These program targets are (or would be) set by the Department of Homeland Security (DHS). Although very challenging to quantify, the BioWatch program could consider establishing minimum target LODs for its agent detection assays based on factors such as the scale of aerosol release that the program is designed to detect, modeling of plume dispersion, collector siting, collector intake rate, and other parameters that influence the deposition of agent particles on a filter, infectious dose of the pathogens of interest, and system testing characterizing expected losses from the point of release to the filter and through the sample preparation steps that provide input DNA to the PCR amplification. Should such program targets exist, the validated LOD for a given assay would thus be required to meet or exceed (be more sensitive than) the desired LOD in order for the assay to be judged fit for the purpose for which BioWatch is designed. A “notional example” of system losses at various steps is provided in Appendix A. The committee does not have information on the specific performance of the BioWatch system or on operational program LOD targets (e.g., ability to detect x number of copies of DNA for agent A per filter quarter). As a result, the discussion below on the process for validating assay LOD is presented in more general terms.
Assay sensitivity generally is characterized by determining the probability of detection at one or more nucleic acid concentrations. The approach taken by the Stakeholder Panel on Agent Detection Assays (SPADA) in its Standard Method Performance Requirements (SMPRs) and validation guidelines is interesting because it uses a predetermined acceptable minimum detection level (AMDL) of a reference strain. The AMDL value is specified as part of the SMPR, although the SMPR does not provide detailed information on how the specific value was determined. For the detection of Bacillus anthracis in aerosol collection filters and/or liquids, for example, the AMDL prescribed by the standard is “20,000 standardized Bacillus anthracis Ames spores per filter; 2000 standardized spores per mL; 2000 genome equivalents per mL” (AOAC 2011c). As depicted in Figure 3-2, the SPADA probability of detection (POD) at the AMDL is related to other commonly used assay performance terms.
Other approaches to characterizing assay performance (e.g., the Public Health Actionable Assay [PHAA] and Federal Standards for Assay Performance and Equivalency [FSAPE] guidelines, DOD assay transition packages, and test and evaluation work conducted for BioWatch by LANL) do not start with a set AMDL. Rather, they call for the use of serial dilutions of a reference strain to determine the ability of the assay to yield a positive detection over a range of concentrations. These data are used to calculate the LOD of the assay.
Setting an upfront AMDL performance target has the advantage of providing clear guidance to assay and technology developers on the detection limit that is required for the assay to be acceptable. This model may be more challenging to implement in practice—it is difficult to draw definitive links between the human infectious dose of a pathogen, the pathogen concentration in an air plume that would be required to cause illness, the factors that influence pathogen deposition onto an aerosol point collector like the BioWatch devices, and the effects of collection medium and sample processing prior to entry into the PCR reaction in order to set the appropriate AMDL. Other assay performance approaches essentially have taken an alternate approach at the assay evaluation stage by assuming that an assay will be designed to be as sensitive as possible and determining the achievable lower analytical detection limit. Subsequent decision making is required to determine whether the measured performance meets mission needs. Either approach—using a predetermined AMDL if stakeholder agreement on this value can be obtained or calculating minimum nucleic acid quantity detectable by the assay followed by stakeholder determination of whether this makes the assay acceptable for the mission—seems reasonable to the committee.
Although pathogen detection assays for environmental biosurveillance programs collectively are expected to detect multiple inclusivity
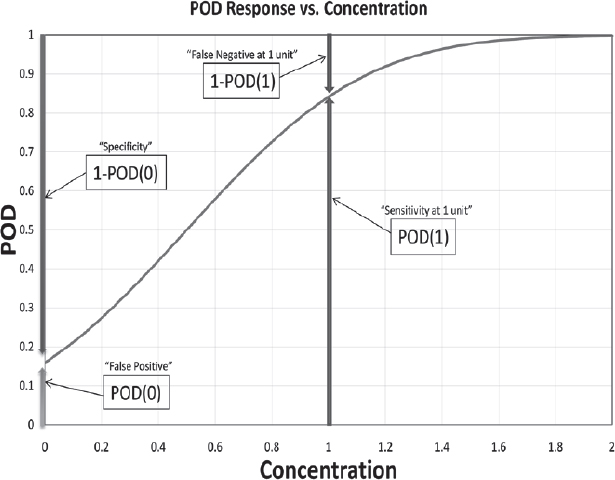
FIGURE 3-2 A hypothetical POD curve, as defined by the SPADA validation guidelines, depends on concentration and can be related to other commonly used assay performance concepts. According to AOAC, “[i]n other models, the terms “false positive,” “false negative,” “sensitivity,” and “specificity” have been defined in a variety of ways, usually not conditional on concentration. For these reasons, their use is denigrated under this model” (AOAC Methods Committee 2011, p. 1374).
SOURCE: AOAC Methods Committee (2011). Reprinted with permission from the Journal of AOAC International.
strains of the tested pathogen, it would be cost and time prohibitive to test multiple replicates of all strains to comprehensively determine the LOD for each. Most performance characterization methods use a reference strain to evaluate the assay’s performance (whether at a preset AMDL or a calculated LOD). The reference strain method assumes that the LOD will be similar among inclusivity strains that the assay should detect. This assumption is not necessarily accurate. When conducting assay testing using SPADA strain panels, for example, LANL scientists observed that different strains exhibited different probabilities of detection at the anticipated LOD. LANL and the BioWatch program addressed this issue
by conducting subsequent steps of testing (for inclusivity and exclusivity panel performance) at a concentration that would allow for some variability.2 The committee believes that the reference strain approach is a reasonable first step given practical constraints on testing, but variation in true LOD among strains is a potential issue of which programs making operational use of such assays should be aware. The committee suggests that a limited number of reference strains (such as n = 3-5) should be tested in a range of concentrations near the expected LOD in order to get an appreciation of inherent variation.
Multiple replicates must be run to determine the probability of detection at any given concentration with associated statistical information on the confidence limits around the result. Table 3-1 provides examples of confidence limits associated with different numbers of replicates and different numbers of “successes” calculated using the Agresti-Coull, Clopper-Pearson, and Wilson confidence interval methods for binomial data (e.g., detect or nondetect results) using a 90 percent confidence interval (95 percent upper confidence limit and 95 percent lower confidence limit). Although the results are similar for the three methods used, they are not identical and all three are presented here for comparison.3
For example, if 10 replicates of DNA are tested and an assay successfully detects DNA in 8 of the 10 samples, there is 95 percent confidence that the true probability of detection of the assay at that concentration is at least ~0.50. On the other hand, should DNA be detected in 40/40 samples, the probability of detection at that concentration is at least ~0.93 (93 percent) with 95 percent confidence. As can be seen in Table 3-1, depending on the interval calculation method employed, testing 47-56 samples with zero failures, 79-85 samples with one failure, and 107-112 samples with two failures will achieve probabilities of detection of approximately 95 percent with 95 percent confidence.
___________________
2 For inclusivity strain testing, testing was conducted not at the concentration for which the assay yielded 95 percent probability of detection of the agent reference strain, but at the higher agent concentration for which the assay yielded a 99.5 percent probability of detection of the reference strain. Exclusivity testing was conducted at 10× the 99.5 percent probability of detection concentration.
3 Current BioWatch assays rely on real-time PCR, which provides an appreciation of the relative amount of nucleic acid present in the sample through differences in cycle threshold values. However, the decision algorithms (employing cutoff Ct values) essentially convert the data to binomial yes/no detection results. The Wilson method is referenced in AOAC validation guidelines (AOAC Methods Committee 2011) while the Clopper-Pearson method is used by Signature Science, LLC in several analyses it has conducted on behalf of DHS as part of the Quality Assurance Program (DHS 2013a,b) because it provides a more conservative estimate of confidence intervals. A prior analysis of bionomial confidence intervals recommended the Wilson method for smaller n and the Agresti-Coull method for larger n (Brown et al. 2001).
| x | n | Agresti-Coull | Clopper-Pearson | Wilson | |||||||||
| “successes” | trials | lower | upper | lower | upper | lower | upper | ||||||
| 3 | 3 | 0.470 | ≤ p ≤ | 1.000 | 0.368 | ≤ p ≤ | 1.000 | 0.526 | ≤ p ≤ | 1.000 | |||
| 3 | 5 | 0.271 | ≤ p ≤ | 0.859 | 0.189 | ≤ p ≤ | 0.924 | 0.272 | ≤ p ≤ | 0.857 | |||
| 4 | 5 | 0.422 | ≤ p ≤ | 0.968 | 0.343 | ≤ p ≤ | 0.990 | 0.435 | ≤ p ≤ | 0.954 | |||
| 5 | 5 | 0.599 | ≤ p ≤ | 1.000 | 0.549 | ≤ p ≤ | 1.000 | 0.649 | ≤ p ≤ | 1.000 | |||
| 9 | 9 | 0.731 | ≤ p ≤ | 1.000 | 0.717 | ≤ p ≤ | 1.000 | 0.769 | ≤ p ≤ | 1.000 | |||
| 8 | 10 | 0.533 | ≤ p ≤ | 0.939 | 0.493 | ≤ p ≤ | 0.963 | 0.541 | ≤ p ≤ | 0.931 | |||
| 9 | 10 | 0.636 | ≤ p ≤ | 0.994 | 0.606 | ≤ p ≤ | 0.995 | 0.652 | ≤ p ≤ | 0.977 | |||
| 10 | 10 | 0.751 | ≤ p ≤ | 1.000 | 0.741 | ≤ p ≤ | 1.000 | 0.787 | ≤ p ≤ | 1.000 | |||
| 18 | 20 | 0.730 | ≤ p ≤ | 0.975 | 0.717 | ≤ p ≤ | 0.982 | 0.738 | ≤ p ≤ | 0.966 | |||
| 19 | 20 | 0.791 | ≤ p ≤ | 1.000 | 0.784 | ≤ p ≤ | 0.997 | 0.804 | ≤ p ≤ | 0.989 | |||
| 20 | 20 | 0.859 | ≤ p ≤ | 1.000 | 0.861 | ≤ p ≤ | 1.000 | 0.881 | ≤ p ≤ | 1.000 | |||
| 38 | 40 | 0.854 | ≤ p ≤ | 0.989 | 0.851 | ≤ p ≤ | 0.991 | 0.860 | ≤ p ≤ | 0.983 | |||
| 39 | 40 | 0.887 | ≤ p ≤ | 1.000 | 0.887 | ≤ p ≤ | 0.999 | 0.895 | ≤ p ≤ | 0.994 | |||
| 40 | 40 | 0.924 | ≤ p ≤ | 1.000 | 0.928 | ≤ p ≤ | 1.000 | 0.937 | ≤ p ≤ | 1.000 | |||
| 58 | 60 | 0.900 | ≤ p ≤ | 0.993 | 0.899 | ≤ p ≤ | 0.994 | 0.904 | ≤ p ≤ | 0.989 | |||
| 59 | 60 | 0.923 | ≤ p ≤ | 1.000 | 0.923 | ≤ p ≤ | 0.999 | 0.929 | ≤ p ≤ | 0.996 | |||
| 60 | 60 | 0.948 | ≤ p ≤ | 1.000 | 0.951 | ≤ p ≤ | 1.000 | 0.957 | ≤ p ≤ | 1.000 | |||
| 94 | 96 | 0.936 | ≤ p ≤ | 0.996 | 0.936 | ≤ p ≤ | 0.996 | 0.939 | ≤ p ≤ | 0.993 | |||
| 95 | 96 | 0.951 | ≤ p ≤ | 1.000 | 0.952 | ≤ p ≤ | 0.999 | 0.955 | ≤ p ≤ | 0.998 | |||
| 96 | 96 | 0.967 | ≤ p ≤ | 1.000 | 0.969 | ≤ p ≤ | 1.000 | 0.973 | ≤ p ≤ | 1.000 | |||
| 118 | 120 | 0.948 | ≤ p ≤ | 0.997 | 0.948 | ≤ p ≤ | 0.997 | 0.951 | ≤ p ≤ | 0.994 | |||
| 119 | 120 | 0.960 | ≤ p ≤ | 1.000 | 0.961 | ≤ p ≤ | 1.000 | 0.964 | ≤ p ≤ | 0.998 | |||
| 120 | 120 | 0.973 | ≤ p ≤ | 1.000 | 0.975 | ≤ p ≤ | 1.000 | 0.978 | ≤ p ≤ | 1.000 | |||
| 47 | 47 | 0.935 | ≤ p ≤ | 1.000 | 0.938 | ≤ p ≤ | 1.000 | 0.946 | ≤ p ≤ | 1.000 | |||
| 53 | 53 | 0.942 | ≤ p ≤ | 1.000 | 0.945 | ≤ p ≤ | 1.000 | 0.951 | ≤ p ≤ | 1.000 | |||
| 56 | 56 | 0.945 | ≤ p ≤ | 1.000 | 0.948 | ≤ p ≤ | 1.000 | 0.954 | ≤ p ≤ | 1.000 | |||
| 57 | 57 | 0.946 | ≤ p ≤ | 1.000 | 0.949 | ≤ p ≤ | 1.000 | 0.955 | ≤ p ≤ | 1.000 | |||
| 78 | 79 | 0.941 | ≤ p ≤ | 1.000 | 0.941 | ≤ p ≤ | 0.999 | 0.945 | ≤ p ≤ | 0.997 | |||
| 84 | 85 | 0.945 | ≤ p ≤ | 1.000 | 0.945 | ≤ p ≤ | 0.999 | 0.949 | ≤ p ≤ | 0.997 | |||
| 85 | 86 | 0.945 | ≤ p ≤ | 1.000 | 0.946 | ≤ p ≤ | 0.999 | 0.950 | ≤ p ≤ | 0.997 | |||
| 105 | 107 | 0.942 | ≤ p ≤ | 0.996 | 0.942 | ≤ p ≤ | 0.997 | 0.945 | ≤ p ≤ | 0.994 | |||
| 110 | 112 | 0.945 | ≤ p ≤ | 0.997 | 0.945 | ≤ p ≤ | 0.997 | 0.947 | ≤ p ≤ | 0.994 | |||
Notes: Confidence intervals calculated using the package ‘bionom’ version 1.1-1 (Dorai-Raj 2014) in the statistical computing software R, version 3.1.2 (R Project for Statistical Computing, available at http://www.r-project.org/).
For comparison, Table 3-2 summarizes the approaches, including numbers of replicates, that form the bases of the performance characterization process recommended by SPADA/PSAA, PHAA/FSAPE, and as conducted by the BioWatch program (used during testing by LANL); Table 3-3 provides an additional comparison of approaches taken by SPADA and PHAA/FSAPE on several of the parameters discussed further in the report.
The SPADA process calls for testing 96 replicates to determine POD at AMDL; the PHAA/FSAPE process uses 9 replicates (3 runs by 3 operators) in a first phase to estimate the LOD followed by testing 60 replicates (20 runs by 3 operators) to determine LOD repeatability; and the BioWatch program tested 20 replicates followed by a further 20 if an unexpected result was obtained (e.g., a failure to detect). In its Defense Technology Objective CB.56 data transition packages, DOD assay developers commonly use several runs of 20 replicates for a total of 60 tests. A sample size of 60 likewise reflects Clinical and Laboratory Standards Institute (CLSI) guidance on limit of detection (CLSI 2004, 2012):
As a reasonable compromise between precision and costs, a minimum number of 60 measurements (on both blank and low level samples) is suggested for establishing the LoD. This would typically be performed by the developer of the method. To verify a claimed LOD, use a minimum of 20 results at the claimed level and, if necessary, at the LoB [limit of blank]. This is usually performed by the laboratory or user. (CLSI 2004, section 4.2.1)
It should be noted that when using a method such as serial dilution to calculate assay LOD, the concentrations used should bracket the actual, obtained LOD in order to most correctly use curve fitting to calculate the value. Because of this, the committee notes that the two-step strategy employed by PHAA/FSAPE, which entails testing a limited number of replicates to initially estimate an approximate LOD, could be helpful in setting the appropriate concentration boundaries for the actual LOD calculation. It can also be noted that data obtained from lower concentrations of a serial dilution series help support confidence in results contained at higher concentrations (e.g., correctly detecting DNA in all tested samples at a lower concentration helps bolster confidence in the results from correctly detecting DNA in tested samples at a higher concentration). The committee has not attempted to place a statistical value on this point, however.
The relatively high numbers of replicates advocated by all of the approaches examined by the committee result in robust statistical power for this stage of the detection analysis. A statistical analysis of the SPADA and PHAA approaches undertaken by Signature Science on behalf of DHS
TABLE 3-2 Comparison of SPADA, PHAA/FSAPE, and BioWatch Acquisition Testing Approaches
| Characteristic | SPADA | |
| Approach | Testing Details | |
| Detection Limit | ||
| Preestablished Acceptable Minimum Detection Limit (AMDL) of reference strain Two stages of testing: method developer stage and collaborative validation stage |
Reference strain is spiked into matrix of interest Criteria require that false negative rate of the agent at the AMDL be less than 5% |
|
| Method developer stage | n = 96 replicates | |
| Determine probability of detection (POD) when reference strain is present at AMDL—goal is 0.95 POD at AMDL with 95% confidence | 0 or 1 nondetect = pass; >1 nondetect = fail If 95/96 samples, the 95% lower confidence limit on the POD is approx. 95% |
|
| FSAPE/PHAA (for environmental samples)a | BioWatch Process (LANL Gen-3 Testing) | ||
| Approach | Testing Details | Approach | Testing Details |
| Determine analytical limit of detection (ALOD) and operational ALOD of reference strain | Multiple phases of testing to address these characteristics (Phases I–IV) | Determine probability of detection of reference strain spiked at different concentrations | Limit of detection determined to be concentration with 0.95 probability of detection |
| Phase I: Analytical Limit of Detection Test reference strain at concentrations of 0.025, 0.05, 0.1, 0.2, 0.4, 0.8 pg/reaction (rxn) In the absence of nontarget nucleic acid or environmental background |
Estimate ALOD as lowest concentration that can be detected 95% of time n = 3 replicates by 3 operators (total = 9) for each concentration If 9/9 samples are able to detect the concentration, the 95% lower confidence limit on the ALOD is 66% |
Step 1: Determine Probability of Detection Test reference strains at range of 8 or more concentrations of DNA (0 to 8192 copy numbers/rxn) |
n = 20 replicates 0 unexpected results = pass; 1 nondetect, tested an additional 20 replicates; 39/40 detections = pass; >1 nondetect = fail If 20/20 samples are able to detect the concentration, the 95% lower confidence limit is 86%; for 39/40 samples the 95% lower confidence limit is 89% |
| Characteristic | SPADA | |
| Approach | Testing Details | |
| Detection Limit | ||
| Collaborative validation stage 12 collaborators (4 at 3 sites) Each collaborator tests 12 samples of the reference strain; study must produce 10 valid data sets and report reproducibility and standard deviation (total = at least 120) See below for testing in absence of agent |
Confirming POD in presence of agent Samples spiked at AMDL; matrix is dust-loaded collection medium (such as a BioWatch filter) POD at least 0.95 with 95% confidence limit |
|
| FSAPE/PHAA (for environmental samples)a | BioWatch Process (LANL Gen-3 Testing) | ||
| Approach | Testing Details | Approach | Testing Details |
| Phase II: Intermediate precision/repeatability Test reference strain spiked at the limit of detection calculated in Phase I Tested in absence of nontarget/background |
n = 20 replicates by 3 operators (total = 60) Criteria: If 0 negative results = pass For 60/60 samples, the 95% lower confidence limit of detection at the ALOD is 95% If ≥1 unexpected result, evaluate assay at next concentration above ALOD and/or may modify the signatures or test (if so, assay must repeat process) 0-2 failures = “robust” if ALOD is 0.1 pg/rxn bacteria and 0.05 pg/rxn virus; 0-2 failures = “acceptable with limitation” if ALOD is 0.5 pg/rxn bacteria or 0.1 pg/rxn virus; 3+ failures at 0.5 pg/rxn bacteria or 0.1 pg/rxn virus = “assay may not be acceptable for the intended application” |
“Threshold of Probable Detection” measured at the BioWatch system level | 2012-2014: System characterization and field tests conducted |
| Characteristic | SPADA | |
| Approach | Testing Details | |
| Detection Limit | ||
| Not applicable | Not applicable | |
| Not applicable | Not applicable | |
| FSAPE/PHAA (for environmental samples)a | BioWatch Process (LANL Gen-3 Testing) | ||
| Approach | Testing Details | Approach | Testing Details |
| Phase III: Operational ALOD Test reference strain at concentrations of 0.025, 0.05, 0.1, 0.2, 0.4, 0.8 pg/rxn in presence of background (nontarget nucleic acid or environmental materials) Under FSAPE: Background of 20 “pooled processed BioWatch PCR-negative samples” |
n = 3 replicates by 3 operators (total = 9) for each concentration Estimated operational analytical limit of detection calculated If 9/9 samples are able to detect the concentration, the 95% lower confidence limit on the measurement is 66% |
Not applicable | Not applicable |
| Phase IV: Operational Intermediate precision/repeatability Test reference strain spiked at the operational ALOD calculated in Phase III in presence of background (nontarget nucleic acid or environmental materials) |
n = 20 replicates by 3 operators (total = 60) Criteria: 0 false negatives expected If unexpected results, evaluate at next concentration above the ALOD (see description for Phase II) For 60/60 samples, the 95% lower confidence limit on the measurement is 95% |
Not applicable | Not applicable |
| Characteristic | SPADA | |
| Approach | Testing Details | |
| Inclusivity Panel Testing | ||
| Test inclusivity panel organisms at concentration of AMDL | n = 1 0 unexpected results = pass; If an unexpected result, re-test with n = 96, 0 failures allowed For 1/1 sample, the 95% lower confidence limit is 5%. For 95/96 samples, the 95% lower confidence limit of detection approx. 95% |
|
| Exclusivity Strain Panels Test | ||
| Test exclusivity panel organisms at concentration of 10× AMDL | n = 1 0 unexpected results = pass; If an unexpected result, re-test with n = 96, 0 failures allowed For 95/96 samples, the 95% lower confidence limit of detection approx. 95% |
|
| FSAPE/PHAA (for environmental samples)a | BioWatch Process (LANL Gen-3 Testing) | ||
| Approach | Testing Details | Approach | Testing Details |
| Demonstration of detectability Conducted prior to the limit of detection testing (Phases I-IV above) Inclusivity panel of strains are each tested at 1pg/rxn DNA or RNA (bacteria) and 0.5 pg/rxn (virus) |
n = 3 (n = 1 run by 3 personnel when applicable) 0 unexpected results = pass; ≥1 unexpected result, “assay does not definitively meet performance standard” and will be investigated For 3/3 samples, the 95% lower confidence of detection approx. 37% |
Step 2: Test using strains on SPADA inclusivity panels identified by SPADA panel chairs as high priority Step 3: Test using additional SPADA strains obtained by LANL |
n = 20 replicates If 1 nondetect, tested an additional 20 replicates Tested at concentration of reference strain expected to give 0.995 POD based on the target strain probability of detection (Step 1) For vendor platform testing used concentration with 0.995 probability of detection for least sensitive system being evaluated |
| Phase V: Evaluation of Assay Exclusivity Test up to 10 organisms per pool at 100 pg/organism (total of 1000 pg/rxn) Tested in the absence of target |
n = 3 (n = 1 run by 3 personnel when applicable) 0 unexpected results = pass; If 1-2 unexpected results, analyze each pool component (number of replicates unspecified) If all pool components individually test negative = pass If 3+ unexpected positive results = fail |
Step 2: Test using strains on SPADA exclusivity panels identified by SPADA panel chairs as high priority Step 3: Test using additional SPADA strains obtained by LANL |
n = 20 replicates If 1 unexpected result, tested an additional 20 replicates Tested at 10× the concentration of reference strain expected to give 0.995 probability of detection based on the target strain probability of detection (Step 1) |
| Characteristic | SPADA | |
| Approach | Testing Details | |
| Exclusivity Strain Panels | ||
| Collaborative validation stage 12 collaborators (4 at 3 sites) Each collaborator tests 12 samples; study must produce 10 valid data sets and report reproducibility and standard deviation (total = at least 120) |
Confirming POD in absence of agent Samples spiked with a near neighbor at 10× AMDL; matrix is dust-loaded collection medium (such as a filter); 95% confidence limit that POD is 0.05 or less |
|
| Environmental Background Organisms and Substances | ||
| Testing pools of panel organisms at 10× AMDL each (up to 10 organisms per pool) Two types of testing: (a) in the presence of the target agent, and (b) in the absence of the target agent at AMDL |
n = 1 0 unexpected results = pass; If an unexpected result, re-test individual components with n = 96 For 1/1 sample, the 95% lower confidence limit is 5%; for 95/96 samples, the 95% lower confidence limit is approx. 95% |
|
| FSAPE/PHAA (for environmental samples)a | BioWatch Process (LANL Gen-3 Testing) | ||
| Approach | Testing Details | Approach | Testing Details |
| Not applicable | Not applicable | ||
| Phase V: Evaluation of Assay Exclusivity Tested in the absence of target Up to 10 organisms per pool at 100 pg/organism (total of 1000 pg/rxn) Under FSAPE: Sample derived from known negative BioWatch samples (100; pooled 10/tube) |
n = 3 0 unexpected results = pass; If 1-2 unexpected results, analyze each component of the pool (number of replicates unspecified) all pool components individually test negative = pass 3+ unexpected positive results = fail |
Step 4: Test using SPADA environmental panel organisms in pools Tested as individual organisms T1-11 and 8 pools |
n = 20 replicates If an unexpected result, each strain from pool tested individually 20 times Tested at 10× the concentration of reference strain expected to give 0.995 POD based on the target strain probability of detection calculated in Step 1 |
| Parameter | SPADA | PHAA/FSAPE |
| Limit of detection | Includes sufficient replicates for statistically robust determination of probability of detection at acceptable minimum detection level | Includes sufficient replicates for statistically robust determination of limit of detection and associated probability of detection at that quantity |
| Inclusivity strains | Strains represent a reasonable starting point but may not reflect sufficient genetic diversity for all pathogens, especially in light of new knowledge | Includes a larger number of strains than the SPADA panels; may call for testing more strains than required for sufficient BioWatch performance, particularly dependent on intended use of the assay |
| Exclusivity and environmental strains | Strains represent a reasonable starting point but may not reflect sufficient genetic diversity for all pathogens, especially in light of new knowledge | Includes a larger number of strains than the SPADA approach; may call for testing more strains than required for sufficient BioWatch performance, particularly dependent on intended use of the assay |
| Environmental substances | Includes a panel of environmental substances for interference testing; uses “dust-loaded filters” during reproducibility phases of collaborative validation | Does not specifically list environmental substances panel; some phases of FSAPE testing call for using pooled BioWatch filter samples to provide realistic environmental background |
| Process | Developed through stakeholder working groups; published as voluntary consensus standards in open literature through AOAC International | Developed as a government unique standard; experts within and outside federal government consulted but not published in open literature |
reveals that, in both cases, the testing strategy “is highly protective against accepting the method if the true POD [probability of detection model at the AMDL, as defined by the SPADA standard] is lower than 0.95” (DHS 2013b, p. 9); similar analysis with regard to PHAA analytical LOD determination is found in DHS (2013a). For both standards approaches, this means that the true detection rate needs to be higher than 95 percent in order for the assay to have a good chance of passing the performance standard criteria. To meet the SPADA requirement of 95/96 or 96/96 detections with greater than 43 percent probability, the true detection rate must be over 98 percent; if the true detection rate is 95 percent the test
will only have 4.4 percent probability of meeting the criteria (DHS 2013b). The initial phase of LOD estimation under PHAA guidelines (n = 9) has a lower statistical confidence associated with a 30 percent margin of error, but estimates undergo subsequent testing with a larger number of replicates (n = 60). To meet the PHAA requirement of 60/60 detections with greater that 50 percent probability, the true detection rate must be over 99 percent; if the true detection rate is 95 percent, the test will only have 4.6 percent probability of meeting the criteria (DHS 2013b). The assay LOD testing previously conducted as part of the BioNet study, initiated in 2005, similarly tested 60 replicates (using a strategy of 3 runs of 20 replicates tested on at least 2 days, by at least two operators, on at least two instruments). In this case, results of 58/60 or better were considered acceptable (Joan Gebhardt, Naval Medical Research Center, personal communication, January 6, 2015). PCR assays are highly sensitive, and validating the minimum LOD of the assay could be useful information because it helps set the maximum achievable performance. For a screening assay, this high level of statistical confidence in the probability of detection of representative inclusivity strains may be especially useful. As discussed above, a key consideration at a screening assay stage is avoiding false negative results.
Examining the methodology used by these various standards approaches and the statistical confidence presented in Table 3-1, the committee concluded that obtaining 60/60 detections is sufficient to infer a high degree of confidence that the assay will be able to detect DNA at that concentration with high probability of success. Even with acceptance criteria that would allow for two failures (58/60), the long-term probability of detection will still be close to at least 90 percent with 95 percent confidence. The committee concluded that this approach should be reasonable, when combined with appropriate data analysis and curve fitting, to determine an assay’s LOD in the laboratory setting.
As noted previously, for decision makers the most relevant information is not necessarily the analytical laboratory LOD of an assay but whether the assay is sensitive enough to detect an amount of DNA reasonably expected to be present in a filter sample following an intentional release. Using the calculated laboratory LOD of the assay in concert with additional data and modeling from release to extracted sample would provide information to help determine whether the laboratory performance of the PCR assay meets such fit for purpose, operational requirements.
ASSAY SPECIFICITY: STRAIN AND SUBSTANCE PANELS
A BioWatch performance standard must sufficiently sample the known genetic diversity of a tested pathogen species such that a defined
set of strains (the ones of biothreat concern) is detected, but closely related nonpathogenic species and strains are not detected. The standard also needs to provide a reasonable balance among competing goals: achieving maximal assay specificity, being feasible within the constraints of assay design and optimization, using available strain sequences and DNA against which to test the assay, and taking account of practical considerations such as time, cost, and who bears the primary responsibility for the burden of validation testing. As expected, there is an inherent tension over meeting these requirements.
An environmental pathogen detection assay for BioWatch should be designed and tested against three types of panels:
- Inclusivity: the set of pathogen strains the assay should detect.
- Exclusivity: the set of closely related species and strains the assay should not detect.
- Environmental background: the set of other organisms, including higher eukaryotes as well as additional microorganisms, that the assay should not detect through cross-reactivity. Potentially interfering background substances (e.g., dust, pollen) also should be included on defined environmental exclusivity panels.
The composition of the panels defined in assay standards are established through consultation with subject-matter experts knowledgeable about the genetic diversity of the pathogen and its near neighbors. Although strain panel composition varies among different standards, the general principles for determining which organisms and strains to include or exclude are similar. An example of the selection criteria used by one of the SPADA working groups in developing its inclusivity panel recommendations was provided by Luther Lindler (2014). The SPADA working group took account of the genetic relationships of this particular pathogen (including strains with pathogen-specific DNA sequences, strains with plasmid variations, and strains from various phylogenetic branches [Morelli et al. 2010]), as well as the virulence status of the strains (including strains with unusual genetic makeup known to be virulent in an animal model and strains with known virulence status verified by small-animal models). The selection of target inclusivity strains should generally seek to balance broad phylogenetic and geographic diversity within the realm of practical testing. The selection of exclusivity (near neighbor) and environmental organism panels generally should include a broad range of taxonomic diversity based upon available knowledge, data, and strain accessibility. The composition of the PHAA/FSAPE inclusivity and exclusivity panels was determined in coordination with subject experts at CDC (DHS 2014).
As Table 3-4 shows for a representative sample of biothreat agents, the inclusivity and exclusivity strain panels in the SPADA SMPRs generally contain fewer organisms than the inclusivity and exclusivity strain panels called for under the PHAA environmental sample approach or under FSAPE. As part of an informal interagency working group, Stephen Morse and Paul Jackson were asked to compare several of the SPADA and PHAA panels and provide their suggestions on whether the panels sufficiently sampled different species’ genetic diversity. As can be seen from the table, representative pathogen species of interest vary significantly in their levels of genetic diversity, which is a key factor in the number of strains suggested for inclusion on the required panels by different approaches. The current SPADA panels should be reviewed in light of the new genetic knowledge available and the Morse-Jackson strain suggestions, given the time that has passed since most of the SPADA working groups established their recommendations (generally 2010-2011). Such a review would determine whether additions or alterations should be made to the panels.
In silico testing can be used to screen large numbers of inclusivity strains for predictions of assay detectability. The testing strategy should include in silico procedures (e.g., predictions of cross-reactivity based on sequence alignments undertaken during assay design and optimization) and laboratory analysis to validate the predicted performance. To keep the inclusivity panel size manageable for laboratory testing, a strategy for prioritizing the inclusivity panel strains is required. The committee suggests that inclusivity panel strains for laboratory characterization and validation of assay performance should sample the genetic diversity represented by available strain collections with the emphasis on prioritizing those strains that cause significant morbidity or mortality, have high transmissibility, or have a wide host range. The strain panel contents are likely to evolve over time as novel diversity is encountered, and it is likely that each agent of interest to BioWatch will have its own unique rate of such evolution.
For practical use in an environmental surveillance program such as BioWatch, the system also needs to function in the presence of a range of substances that could inhibit the assay detection (e.g., pollen, dirt). The SPADA SMPRs provide a list of environmental background substances against which assay performance should be tested to determine whether these substances inhibit or interfere with the results. The PHAA/FSAPE approach does not specifically identify a panel of background substances. At the request of DHS, LANL did not test assay analytical performance against the SPADA environmental substances panel, because system operational performance testing was subsequently undertaken by the program elsewhere. As a general principle, the committee agrees with the concept that assay analytical performance should be tested against environmental substances that might be present on filters in a realistic operational envi-
| Agent a | Number of Strains and Substances | |
| SPADA | LANL Assembly | |
| A | ||
| Inclusivity | 15 | 13 |
| Exclusivity | 20 | 20 |
| Inclusivity | 9 | 9 |
| Exclusivity | 10 | 7 |
| C | ||
| Inclusivity | 16 | 15 |
| Exclusivity | 17 | 17 |
| D and E | ||
| Inclusivity | 12 | 10 |
| Inclusivity | 24 | 24 |
| Exclusivity | 24 | 21 |
| F | ||
| Inclusivity | At least 2 from each major clade | Ongoing |
| Exclusivity | 11 | |
| Additional strains for testing | Based on bioinformatics screening | |
| Environmental panels (strains) | Other threat agents: 7 Bacteria in air/soil: 36 DNA viruses: 3 Microbial eukaryotes: 14 Higher eukaryotes: 18 Biol. insecticides: 5 | Other threat agents: 3 of 4* Bacteria in air/soil: 33 DNA viruses: 3 Micro. eukaryotes: 8 Higher eukaryotes: 17 Biol. insecticides: 1 of 2 |
| Total = 83 | ||
| Environmental panels (substances) | 32 | N/A |
| Total strains and substances | 262 | Assembled 214 of 220 unique strains in SPADA panels |
a Specific pathogen names have been replaced with a designation of “Agent A,” “Agent B,” etc. The full table and associated references are provided in Appendix A.
b These strain panels continue to evolve as new strains have been identified. Numbers listed reflect strains in DHS (2014).
c Based on an analysis undertaken by Paul Jackson and Stephen Morse (unpublished).
| FSAPE / PHAAb | Jackson/Morse | Jackson/Morse Suggestionsc |
| Genetically monomorphic; SPADA panels sufficient for inclusivity and exclusivity | ||
| 48 | 15 | |
| 61 (+ 7 on environmental panel) | 22 | |
| 40 | 35 | Genetically diverse; for inclusivity and exclusivity, |
| 42 | 19 | supplement SPADA panels; provided suggestions for additional strains |
| Genetically diverse; for inclusivity, supplement SPADA | ||
| 46 | 40 | |
| 37 | 32 | panel; provided suggestions for additional strains; for exclusivity, use FSAPE panel |
| 31 | 31 | Genetically diverse; for inclusivity and exclusivity of D and E, use FSAPE panels |
| 73 | 82 | |
| 91 | 98 | |
| 45 | Did not review this agent | |
| 26 | ||
| Arthropod: 20 Bacterial: 112 Botanical: 10 Fungal: 14 Protists: 10 Vertebrates: 20 Viral: 9 | N/A | Did not comment on these panels |
| Total = 195 | ||
| N/A | N/A | Did not comment on these panels |
| 664 | ||
ronment for informational purposes. If interference from environmental substances affects performance, modifications to sample preparation procedures or assay conditions may need to be made.
Strain access and quality control are fundamental issues for any performance standard. The work undertaken by LANL to assemble and quality control the inclusivity and exclusivity strains in published or forthcoming SPADA SMPRs for five pathogen species is illustrative of the challenges (AOAC 2011a,b,c, in preparation-a,-b; LANL 2011a). Not all strains of a pathogen that might be reported in the literature are easily accessible. Not all strain cultures or extracted DNA that LANL obtained matched canonical nucleic acid sequences for the strain; others failed quality control for other reasons. Although most strains could ultimately be obtained and verified, LANL was not able to obtain several of them, as Table 3-4 makes clear. The time, cost, and ability to obtain and verify strains would be expected to be greater the larger is the size of the required panels (such as for the more extensive PHAA/FSAPE panels).
As noted above, testing assay performance against inclusivity and exclusivity strains should be conducted through a combination of in silico prediction and laboratory analysis. In silico predictions of sequence alignment and potential detection or cross-reactivity rely on access to quality databases with as many accurate pathogen sequences as possible, but are an especially useful tool to screen large numbers of organisms quickly and economically and flag likely issues. Laboratory testing is more time-consuming, but is required to validate the expected performance.
Most standards approaches specify laboratory testing of inclusivity strains at the limit of detection (generally the quantity producing a 95 percent probability of detection, or a related modification such as the testing conducted by LANL at the concentration producing a 99.5 percent probability of detection). Exclusivity or environmental panel testing, on the other hand, is generally carried out at 10× the LOD or 10× the AMDL to maximize the chance of detecting an issue should one exist. These levels are appropriate and reflect general procedures in the community.
For exclusivity and environmental panel organisms, a strategy of sample pooling can be considered in order to increase testing efficiency. If a positive result is detected in a particular pooled sample, each agent in the pool then should be tested separately. Both SPADA and PHAA/FSAPE use a pooling strategy—SPADA for environmental organisms and PHAA/FSAPE for environmental organisms and exclusivity strains. Anecdotally, it is possible that assay sensitivity may decrease when pooling DNA from multiple organisms and the guidance documents reviewed by the committee generally limit pooling to a maximum of 10 organisms per pool. The reality that some pools may need to be deconvoluted and the strains tested individually should be kept in mind when planning
validation time lines and budgets. Overall, however, the committee agrees that a strategy of sample pooling is reasonable in order to increase testing efficiency for exclusivity and environmental panels, rather than a requirement that each such organism be tested individually.
As with assay LOD, understanding the statistical levels of confidence around an assay’s performance on inclusivity and exclusivity panel testing is important for interpreting the results. Different approaches use different testing strategies with different implications for statistical confidence. The SPADA SMPR testing for inclusivity, exclusivity, and environmental interference evaluates a single sample if the expected result is obtained. This provides only weak statistical confidence that the test will identify an issue should one exist. On the other hand, if an unexpected result is obtained, follow-up testing is done at high stringency (a further n = 96 samples). The PHAA/FSAPE approach for inclusivity on the full panel of inclusivity strains relies on an initial demonstration of detectability using three samples. The obtained threshold cycle (Ct) values are examined in comparison to the Ct value of the reference strain to judge how the assay performs across strains and whether there appear to be issues with the detectability of any of them. Exclusivity and environmental panel organisms also are only tested with n = 3 samples (three total runs of the panel strains by three different operators, one run per operator). The implication of both the SPADA and PHAA/FSAPE approaches for testing exclusivity and environmental strains is that the assays’ potential false positive rate is not well characterized unless an issue is detected in the first tested sample and subsequently re-tested (under SPADA guidelines). For n = 1/1, there is 95 percent confidence that the lower confidence limit on the measurement is only 5 percent (e.g., the long-term detection rate is at least 5 percent); even if there is an assumed error rate of 20 percent, the sample would still have an 80 percent chance of passing the test. For n = 3/3, there will be 95 percent confidence that the long-term detection rate is at least 37 percent. With an assumed error rate of 20 percent, there will be a 51 percent rate of passing the test (DHS 2013a,b).
Under the SPADA approach, if the n = 1 sample does not produce the expected result of detection (inclusivity strains) or nondetection (exclusivity and background strains), a further 96 samples are tested. This produces stringent confidence around the results (should 95/96 detections be obtained based on the further testing, the assay will have a 95 percent probability of detecting the strain with a 95 percent lower confidence limit). On the other hand, this type of approach has the potential to lead to a significant increase in the number of tests required under the standard (e.g., were testing conducted on 20 strains and 10 produced failures in the n = 1 sample such that a further n = 96 replicates were required, an additional 960 samples would need to be performed).
High uncertainty around the false positive rate may be particularly problematic for a secondary assay, because assay specificity will be critical in ensuring that false positive results do not lead to high-consequence actions. The use of three or more independent signatures in a secondary assay (as is the case with the BioWatch assays through the LRN), and use of a decision algorithm that requires all of the signatures to be positive in order for the result to be considered a positive detection, mitigates the likelihood of a false positive in the overall detection algorithm, although the possibility of a false negative could exist if a signature fails. It appears to the committee that additional performance data at the inclusivity and, particularly, the exclusivity testing stage by testing a larger number of replicates than included in either SPADA or PHAA/FSAPE guidance would be valuable as part of a BioWatch performance standard. As discussed elsewhere in the chapter, obtaining and quality assuring strain DNA can represent a significant effort. Once this DNA has been assembled, conducting additional replicate testing in order to increase the statistical confidence associated with the results may not pose an extraordinary burden. In this regard, the committee notes that the LANL test and evaluation work conducted on behalf of BioWatch tested inclusivity and exclusivity strains using 20 replicates. If an unexpected result was obtained, 20 further replicates were tested. This yields a statistical lower confidence limit of 86 percent for 20/20 expected results and 89 percent for 39/40 samples.
A potential false positive or false negative performance rate on the assay of 1 – 0.86 = 0.14 (14 percent) for a given strain may seem particularly problematic to program users and the committee considered this issue. Even for a secondary assay panel comprising three independent signatures, the potential false positive or false negative rate would be 0.14 × 0.14 × 0.14 = 0.0027 or one incorrect result per 370 tests.
The committee noted that balancing the need to undertake a reasonable amount of laboratory assay testing (in both time and cost) with achieving high statistical certainty around assay performance is inherently challenging for a system such as BioWatch. The program has so far conducted over 7 million assays and must certainly keep its false positive rate low in order to be acceptable to jurisdictions. Its false negative rate must also be very low since a failure to detect an actual biothreat release would be potentially catastrophic. If one were to set the performance targets for laboratory validation testing of an assay at the sort of stringency level users may desire operationally (e.g., specifying that an assay false positive or false negative rate be less than 1 per 100,000 tests with 95 percent confidence, as a hypothetical example), it would not be possible or practical to conduct enough replicates to validate performance to this level. And furthermore, this process would reflect laboratory testing, rather than performance in the real-world environment of the jurisdictions.
The most feasible option to the committee is to conduct a manageable amount of laboratory testing at the assay performance characterization and validation stage, in order to gain confidence that the assay appears to perform reasonably. Ongoing analysis of assay performance data from verification in user laboratories and from operational deployment of the assay in the program will be critical to build a more complete understanding of assay performance over time. This ongoing data analysis will build confidence in the performance of the assay or reveal issues that need to be addressed.
As a result, the committee concluded that the approach and number of replicates used for inclusivity and exclusivity strain testing by LANL provides a reasonable level of confidence in assay performance for the laboratory validation stage. Combining the data obtained through this validation with ongoing performance monitoring should be considered in assessing confidence in the assay.
UNDERSTANDING ENVIRONMENTAL BACKGROUND
The BioWatch system is required to successfully detect a specific set of pathogenic organisms from the millions of nonpathogenic related or unrelated microorganisms present in the environment. This aim requires understanding how the assay result differs from a baseline. The program involves the collection of aerosol samples from multiple jurisdictions around the country and multiple locations within each jurisdiction. Because filter samples are collected daily, conditions such as the season, temperature, precipitation, presence of local disturbances such as construction, and other factors vary substantially over time for any given sample site. All of these factors make the background of microbes and substances out of which the pathogenic strains need to be detected extremely demanding.
How to detect a true signal from the noise of background is made more complicated still by the fact that the distribution of bacteria and viruses in different environments around the United States is not well characterized. Some BioWatch collectors are located in indoor, rather than outdoor, environments but indoor environmental background also is not well known.4 Though culture was, for many years, the standard for characterization of microorganisms, many bacteria and viruses cannot be cultured. Advances in recent years in genomic sequencing have contributed substantially to sampling microbiomes in media such as water
___________________
4 For example, the Alfred P. Sloan Foundation is currently supporting a research program to investigate “microbiology of the built environment” (see http://www.sloan.org/major-program-areas/basic-research/microbiology-of-the-built-environment/).
and soil samples, on surfaces, and in the air, yet it is common that a large fraction of the sequencing reads from such samples cannot be mapped to any known genome.
Investigations have been undertaken to explore the presence and composition of bacteria and near neighbors relevant to the current BioWatch program using sources such as archived filters from Environmental Protection Agency (EPA) air quality monitoring stations (Barns et al. 2005; Kuske et al. 2006; Merrill et al. 2006). Certain bacteria or near neighbors were detected more commonly than others, and notable variability was observed. These surveys also observed significant sequence identity between pathogens of interest and near neighbors, including near neighbors carrying partial or similar virulence genes, such as the pX01 plasmid found in Bacillus anthracis (Kuske et al. 2006).
It appears to the committee that public health users and others on the front line of decision making in BioWatch jurisdictions remain wary about the use of results in making decisions because of previous experiences with nonbiothreat environmental detections. This has been a bigger issue in some jurisdictions than others. For example, BioWatch jurisdiction “X” has experienced relatively high assay detections for tested pathogen “C,” which has led the jurisdiction to stop using this particular assay (see Appendix A for further information). Specific investigations of these filters should occur and continue in order to uncover the root cause behind these results.
For BioWatch and its users, the practical implication is that to interpret assay data in a real-world situation, more accurate background information for existing collector locations is needed against which to compare results. Previously tested, threat agent–negative BioWatch filters from selected locations in the BioWatch jurisdictions could be used to undertake this environmental sampling, which could be carried out through deep metagenomic sequencing. Judicious sampling of microorganisms present in soil and water samples would also be informative. The significance of environmental background to confidence in assay results echoes a recommendation made in a previous NRC report (IOM and NRC 2011, pp. 9-10):
RECOMMENDATION 5: As part of its response to the technical and operational challenges posed by the development and launch of Generation 3 BioWatch, DHS should collaborate with HHS, DoD, EPA, the National Science Foundation, and other agencies doing relevant work to develop and execute an aggressive research and development plan focused on (1) shorter-term goals to improve the capabilities and cost effectiveness of the environmental monitoring for airborne biological threats performed by the BioWatch system, and (2) longer-term goals to improve the knowledge base needed to support transformational inno-
vations in environmental biosurveillance.
Work in support of shorter term goals should focus on
- Advancement of the state of science needed for the development of an autonomous field-deployable detector with capabilities to meet Generation 3 BioWatch operational requirements and beyond.
Work supporting longer-term goals should include
- Temporal and spatial characterization of pathogen and near neighbor populations in air and natural reservoirs in urban areas, including those near BioWatch sites, and
- Participation in the work by others on host–pathogen interactions, surveillance, and epidemiologic research investigations and establishment of shared databases.
The use of existing resources such as used BioWatch filters to improve understanding of environmental background would build on the capacity of the BioWatch network as a tool. An improved understanding of background for that jurisdiction and location would help more broadly in assay data interpretation or in the prediction that such results might occur under certain sets of circumstances, and in understanding the context of the result. This understanding might help prevent a jurisdiction from dropping an assay in frustration.
In addition to helping put assay results in context, genomic sequence information obtained through further characterization of environmental background in BioWatch jurisdictions could aid PCR assay design (for example, in selection and in silico screening of target sequences, primers, and probes in an effort to make the assays as sensitive and specific as possible). It also is possible that results from further environmental background characterization could help guide selection of the most appropriate exclusivity and environmental strains with which to conduct the laboratory validation testing of BioWatch assays. As with selection of the inclusivity strains that should form part of the standard panels, employing a strategy to prioritize the most appropriate subset of environmental strains will be helpful in balancing the need to cover genetic diversity while reducing the size of strain panels and number of required tests.
Using Environmental Background to Understand Predictive Value of the Assay
Better understanding of environmental background would provide information on the expected probability of the tested organism or near neighbors in the specific jurisdictional environment. The predictive value of a test, particularly positive predictive value (PPV), is a concept that relates how likely it is that the condition is true when there is a positive test result (“true positives” divided by “positive test results”). The
negative predictive value (NPV), on the other hand, reflects “true negatives” divided by “negative test results.” These parameters are familiar from clinical and public health use. The determination of PPV is affected by prevalence. For BioWatch, the true prevalence of tested pathogens in local environments is difficult to determine, because little is known about the actual environmental background of the agents and how they vary geographically and temporally, and because the prevalence of the tested microorganisms is likely to be generally very low. For certain biothreat agents of potential relevance to BioWatch, such as Variola virus, the causative agent of smallpox, the environmental prevalence is expected to be zero. Other relevant biothreat agents are zoonotic and endemic, however, and may be found in certain U.S. environments under certain conditions. As a result, the prevalence is not necessarily too low to be relevant in all cases. Earlier in the program’s history, for example, testing included a species of bacteria that infects livestock animals such as cattle, pigs, and sheep, and wildlife such as bison; this organism was subsequently dropped from BioWatch because of the frequency of environmental detections. Decision making by state and local jurisdictions would be strengthened by a better understanding of assays’ PPV in the local context, could this be obtained. The committee notes that the newly released SPADA SMPR for Variola virus (AOAC 2014) asks for the detection assay’s PPV to be reported given that the virus has been eliminated from the environment.
Microorganisms are diverse. Bacteria, for example, may undergo mutations during replication, exchange genetic information, experience deletions or rearrangements in their genomes, or gain and lose plasmids (additional, extra-chromosomal pieces of DNA) associated with virulence. Viruses, especially RNA viruses because of an error-prone polymerase (Smidansky et al. 2008), may also mutate, or viruses with segmented genomes, such as influenza, undergo recombination (Bean et al. 1980). In addition, viruses exhibit a broad inherent diversity in mammals that far exceeds the known diversity in humans (Anthony et al. 2013), and novel human viruses are being continually discovered (Chiu 2013). This diversity is of direct relevance to BioWatch because nearly all of the microbial agents targeted by the program are zoonotic in origin. Appendix A provides an additional figure that attempts to capture measures of variation involved with representative pathogenic agents.
Several concepts have been proposed to express the range of microbial diversity. Viruses may evolve through mutation into distinct phylogenetic groups, or “clades,” resulting in independent, potentially highly
diverse strains circulating in the population. Even within an infected individual, there can be viral “quasi species” which reflect a distribution of closely related viral genomes in a population. It is thus critical that PCR assays targeting these viruses use primers derived from highly conserved regions of the genome to be able to capture the diversity of viruses within individuals as well as populations. In many cases, a single viral reference sequence may not be sufficient to detect all viral genomes within a population (Domingo et al. 2012), and the availability of multiple reference sequences spanning the phylogenetic “space” may be needed. The viral reference database for assay design also needs to be regularly updated given the high mutation rate for RNA viruses. A recent genomic study of Ebola viruses from the 2014 West African outbreak found that the 2014 genomes differed from the PCR primers and probes for four separate assays that had been deployed for Ebola and pan-filovirus diagnostics (Gire et al. 2014).
For organisms such as bacteria, defining the pan-genome is an effort to represent the species diversity that exists. The pan-genome represents the full set of genes present in all of the strains of a species. Thus, the known pan-genome is likely to grow as new strains are identified and sequenced.5 The pan-genome includes a core genome, containing the absolutely conserved genes present in all members of the species, and an accessory genome, representing the elements that are present in only one or a subset of strains. Whereas the core genome of a species is associated with many of its fundamental characteristics, it has been suggested that the accessory genome is frequently associated with traits of interest such as antibiotic resistance and virulence (Tettelin et al. 2005). As new strains are sequenced the accessory genome may grow while the core genome is reduced.
An example from the bacterial species Burkholderia pseudomallei illustrates the challenges that can be presented for PCR assay development. To avoid a failure to detect the particular species of interest (a false negative), assays target DNA signatures drawn from the core genome of the species. To avoid detecting a near neighbor that is not the species of interest (a false positive result), assays target those core genome sequences that are not shared with the other species. As can be seen in Figure 3-3, the Burkholderia genus exhibits very high diversity and there is only a small portion of the overall B. pseudomallei genome that is suitable for use in designing an effective PCR assay. As more and more genomic informa-
___________________
5 Alternatively, as genetic sequence information increases, a pathogen previously identified as a strain of a particular species could be reclassified as belonging to a different species. In that case, its genetic information would no longer be part of the pan-genome for the initial species.
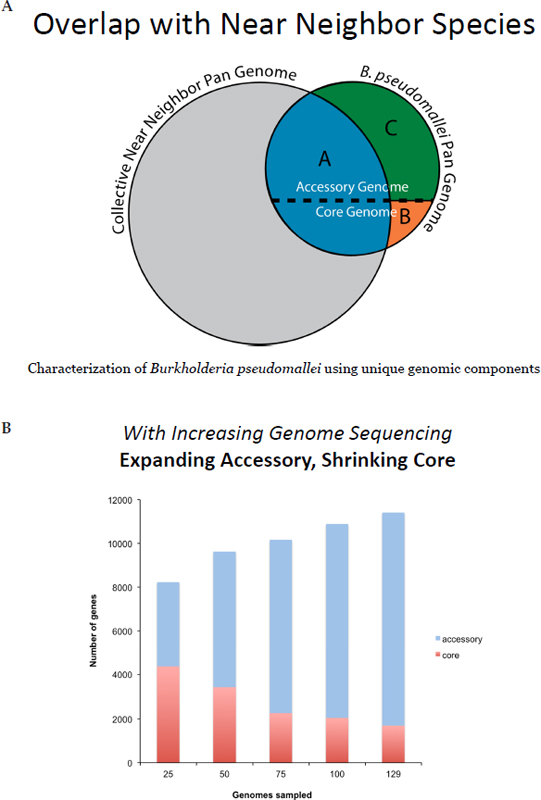
FIGURE 3-3 A. Representation of the Burkholderia pseudomallei pan-genome. B. Effect this has on the selection of DNA signatures that can be used in designing PCR assays.
SOURCE: J. Sahl, P. Keim, and D. Wagner, unpublished data, used with permission.
tion has become available on B. pseudomallei strains and on closely related Burkholderia species, what is recognized as the conserved, core genome has shrunken and the accessory genome has grown. This presents a huge challenge to identifying DNA signatures that can be distinctive for particular subsets of B. pseudomallei. Furthermore, as knowledge of the Burkholderia genus has expanded, it is being recognized that pathogens B. pseudomallei and B. mallei may need to be treated as a single assay target rather than as two separate targets, because of their genetic similarity. Despite causing vastly different disease manifestations, there are now no uniquely identifying signatures available for B. mallei (Keim 2014).
Even for bacteria that exhibit much less genetic diversity than the Burkholderia genus, a given bacterial strain can vary unexpectedly. For example, investigations into the Bacillus anthracis Ames strain used in the 2001 anthrax mailings identified morphological differences among colonies within the Ames strain and associated genetic changes, including insertions, deletions, or single nucleotide alterations in the chromosomal DNA or in the plasmid pX01 (NRC 2011; Rasko et al. 2011). Should a PCR assay’s primers and probe target sequences exhibit such variations, binding and amplification could potentially be affected.
To help deal with the challenges posed by genetic diversity, it may in some cases be useful to incorporate into the BioWatch program the use of one or more additional near-neighbor rule-out assays as part of the decision-making algorithm (e.g., the development and use of PCR-based or other assays, beyond the existing screening and secondary assays, that would be designed to detect expected nonpathogen near neighbors). These could be incorporated into the program for pathogens that exhibit high genetic variability that makes it challenging to design and validate screening and secondary assays against a limited number of target DNA sequences with sufficient powers of discrimination. This option might be considered for use with certain pathogens in the context of certain collector sites or certain jurisdictions where it has been challenging to obtain PCR assays with sufficient specificity. This situation also suggests that a single set of initial and secondary assays sufficient for all BioWatch jurisdictions and all collection sites may not be feasible.
ASSAY PRECISION AND OTHER PERFORMANCE PARAMETERS
Assay performance characterization undertaken to validate performance standards needs to consider several additional factors such as precision and robustness. Assay precision represents the closeness of the values of results obtained through independent tests of a sample. It can include two dimensions—repeatability (measurements carried out under identical conditions and over a short period of time) and reproducibility
(measurements carried out using different reagent lots, different operators, and over different days).
In addition, the accuracy of the assay can be determined in situations where results from the tested assay or method can be compared with results from a standard reference method or with a true value known by other means. For analytical testing of a real-time PCR assay starting from known quantities of a purified nucleic acid, the accuracy of the assay result can at least be compared with the starting reference value.6 As the BioWatch program validates new assays or new detection technologies, it also can compare the performance of the new candidate method to the existing assay system.
POSITIVE AND NEGATIVE PCR ASSAY CONTROLS
Appropriate positive and negative controls are required when conducting all real-time PCR assays to ensure that the reagents and instruments are operating correctly, that there is no detectable contamination, and that PCR inhibitors are not present. These controls should be specified in any performance standard. Rather than compare and contrast descriptions of assay controls used by LANL in its extensive testing or discussed in existing performance standards, the committee provides the principle types of controls it judges are necessary for inclusion in a performance standard for a real-time pathogen detection assay to meet BioWatch’s needs. These are
Positive controls
- Positive target amplification control (external positive control): contains all of the reaction components along with reference DNA that should be amplified by the assay; used to help rule out amplification failure if a negative sample result is obtained.
- Positive amplification control (inhibition control): contains materials designed to amplify a known, different region of DNA (such as the bacterial 16S gene) along with a test sample; used to help rule out an amplification failure due to the presence of substances that inhibit PCR in the test samples. In addition to running the inhibitor control within the background of a test sample, the inhibitor control should be run by itself to rule out a failure of amplification due to a failure of the 16S assay or reagents.
___________________
6 Note that when creating test samples using dilutions series the actual concentration of DNA in a given sample will be subject to a statistical distribution. The effects of a Poisson distribution of genome copies will be more noticeable at very low copy numbers.
Negative controls
- No template control: contains all of the reaction components in the absence of target DNA; used to detect contamination or some nonspecific amplification products.
Instrument and operator performance controls
- Quality and uniformity controls: known samples run regularly that help the laboratory assess that procedures and instruments are performing as expected. LANL’s testing and evaluation, for example, included the following:
- — Daily quality control samples that verified the concentration of DNA aliquots used in testing and correct preparation of dilution series; and
- — Monthly uniformity samples that contained the same reaction in all wells of a 96-well assay plate, to verify that similar results were obtained across the plate.
- Prior to validation testing, the assay or instrument developer should provide information on the expected acceptable performance of the assay on the instrument or platform, such as specified ranges for Ct values. This type of information is used to ensure, for example, that the results produced by positive amplification controls are in the correct range.
Sufficient positive and negative controls should be included to ensure that the PCR process was performed properly and to reliably indicate when there has been some type of mitigating result. Quality control and proficiency test samples also should be run as part of a comprehensive quality assurance (QA) framework. Ongoing monitoring and evaluation of assay and operational performance through a QA program is discussed further in Chapter 4.
TESTING LABORATORY SETUP AND MANAGEMENT
Assay performance and validation testing should be conducted using a laboratory setup designed to minimize the potential for contamination and with systems to record and manage the data obtained. International standards such as ISO 17025 provide guidance for testing laboratories and should be consulted.
The report does not delve into appropriate laboratory setup in detail, but points, for example, to the procedures implemented at LANL for the assay and platform testing it conducted on behalf of the BioWatch program (LANL 2010). Different stages of the assay testing process were
conducted in separate rooms with directional sample flow from one stage of analysis to another (see Figure 3-4).7 Weekly swipe testing also was conducted to monitor for cross-contaminating DNA. The time, space, and cost to set up and maintain the appropriate type of laboratory operation (with associated, trained personnel) is not insignificant.
REFERENCE MATERIAL AVAILABILITY
A critical dimension of assay characterization and validation, regardless of the performance standard, is the use of quality-controlled reference materials. Reference materials must be available to BioWatch assay developers and laboratories conducting validation in quantities sufficient for the required testing.
For BioWatch assay development and testing, access is required to at least extracted nucleic acids from inclusivity, exclusivity, and environmental background organisms. For ongoing or large-scale testing, having access to microbial cultures from which new batches of DNA can be extracted and purified is helpful. The BioWatch program has also conducted some system testing using live microbial agents. The committee recognizes that access to certain live biothreat agents may be limited to designated parties or locations that are licensed to handle these organisms under appropriate safety and security regulations. Even with select agent registration it can reportedly be difficult to access select agent materials and, in particular, federal agencies may not be willing to distribute select agents to nonfederal entities. Because of specific restrictions on the possession of, for example, Variola virus cell culture stocks and DNA, special considerations arise when undertaking assay performance testing and validation for orthopox detection assays.
To reduce the need for high-level biosafety facilities and to clarify access, establishing mechanisms to provide assay developers and validation testing laboratories with necessary testing materials would be helpful. Non–live agent strain materials that could be used for conducting PCR assay testing include sterilized or killed agents, purified genomic DNA, or synthetic or cloned DNA fragments. To address orthopox assay testing needs, for example, the molecular genetics and assay development communities are currently wrestling with the issue of whether candidate gene fragments can be used as an acceptable substitute to
___________________
7 Preparation of PCR master mix and preparation and aliquoting of DNA are performed in the same room, although the steps are separated on either side of the room. Note that for clinical and public health PCR testing, spatial segregation between these areas is generally recommended. Thus this specific setup may not be the one in operational use in BioWatch laboratories.
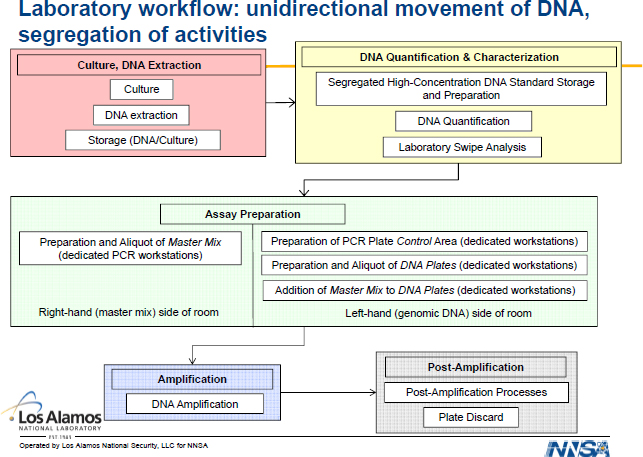
FIGURE 3-4 Laboratory organization used by LANL in conducting assay testing.
SOURCE: Los Alamos National Laboratory, used with permission.
genomic DNA or live virus, or whether all Variola materials and testing would need to be conducted at the CDC’s Variola laboratory, which could place a burden on the CDC’s Biosecurity Level 4 resources. The committee supports efforts to address the issue of which types of strain reference materials are necessary for biodetection assay testing and how they can be provided, and notes, as well, that the need for access to relevant reference materials does not imply that all such materials should be held in a single repository.
Awareness of who holds nucleic acids from which microorganisms and how to obtain these materials is an important issue for the biodetection community and has the potential to limit assay development and validation efforts. A clear list of who maintains which strains and strain nucleic acids across federal agencies and through other known sources currently is not available. The committee’s understanding is that discussions were previously held among federal agencies and relevant participants on creating such a catalogue, informational reference, or virtual database, but the effort did not come to fruition.
There are several sources from which relevant strain cultures and extracted strain nucleic acids can be obtained. Acquisition and subsequent use of materials from all sources is likely to be governed by applicable material transfer agreements:
- Los Alamos National Laboratory: In 2009, DHS contracted with LANL to assemble the inclusivity and exclusivity strain panels recommended by the SPADA SMPRs that address aerosol collection of representative biothreat agents. The materials that LANL assembled, particularly culture stocks from which new batches of DNA could be produced and purified, remain available for further assay or device testing.
- Critical Reagents Program: As discussed in Chapter 2, the CRP provides a source for reference materials to DOD as well as to other agency purchasers.
- American Type Culture Collection (ATCC): ATCC is a nonprofit center that maintains and sells microorganisms, cells, and other biological materials (non–select agents).
- BEI Resources (BEI): BEI was initially established by the National Institute for Allergy and Infectious Diseases of the National Institutes of Health to support infectious disease research, including maintenance and provision of microbiological research materials. It is currently managed under a contract to ATCC.
- Other Agency Collections: DHS and CDC have identified strains listed on the PHAA panels for agent detection assays as part of CDC LRN assay validation testing and documentation.
-
Other Resources:
- — Individual researchers may be sources for particular strains. For example, Paul Keim is recognized as having assembled a substantial collection of Burkholderia species in the course of his research on that genus.
- — Private companies may hold relevant strains from their research and development of different types of detection devices. For example, MRI Global has served as the independent testing laboratory to conduct validation following AOAC and SPADA requirements and maintains ISO 17025 accreditation under the American Association for Laboratory Accreditation. It also formerly served as an “Accredited Reference Material Producer” to the ISO 34 standard.8
___________________
8 MRI Global recently canceled its ISO 34 certification because it did not have active business in this particular area (Chris Bailey, MRI Global, personal communication, January 5, 2015).
The initial screening assay and associated reagents used by BioWatch are provided to the jurisdictional laboratories through the DOD CRP. At the time that LANL assembled SPADA panel strains in order to conduct performance testing, it obtained some materials from CRP, some from repositories such as BEI and ATCC, and some from private collections and other sources. In parallel, the CRP undertook an effort to obtain stocks for additional microorganisms that it did not previously hold. As a result, the CRP now strives to hold as reference materials the strains listed on SPADA inclusivity and exclusivity panels that are biological weapons agents, and the strains held by CRP are in the process of being sequenced (Bruce Goodwin, CRP, personal communication, January 12, 2015).9 The resultant data raise the question for the microbiology, molecular genetics, and population genetics communities about what degree of sequence similarity is sufficient for something to be considered the same strain and to proceed with using it for the panels, given the potential for mutations and plasmid changes over time. The CRP is wrestling with this issue (Goodwin 2014; Omberg 2014).
The secondary assay and associated reagents used by BioWatch are provided to the jurisdictional laboratories through the CDC LRN. The CDC has adopted the PHAA performance standard, which includes testing procedures and strain panels for clinical samples and procedures and strain panels for environmental samples. The CDC has been submitting LRN assays to the Food and Drug Administration (FDA) for 510(k) approval (clinical diagnostic component); it has so far completed this submission for one LRN agent detection assay and has others in the process (Toby Merlin and Harvey Holmes, CDC, personal communication, December 2, 2014). As a result, sources for the relevant pathogen strains on PHAA panels for certain agents have been identified, and strain material has been extracted. In this case, nucleic acids from the identified strains are requested through the DHS Science and Technology (S&T) Directorate, which communicates with the experts who possess and maintain the strains in their laboratories. The committee does not have detailed information on the quality control processes used in verifying the panel strain materials, but these experts provide certificates of analysis on which CDC relies for strain authentication. As noted, the subject experts continue to maintain the strains in their own laboratories and provide them on request. However, these experts are not professional repositories and a streamlined mechanism or repository to make standard materials from the PHAA panels available to the broader community does not cur-
___________________
9 The CRP indicated that it focuses on strains that are biological weapons agents (BWAs) and is generally not in the practice of producing reference materials for non-BWAs as these materials may be available through other entities.
rently exist and remains a limitation (Toby Merlin and Harvey Holmes, CDC, personal communication, December 2, 2014). It might be feasible for panel materials eventually to be transferred to another entity to serve as the resource to provide them to DHS or others, as necessary for future assay performance and validation testing, but this option would need to be explored.
Quality Control
LANL was able to obtain the majority of the SPADA strains it sought—214 out of a total of 220 strains in SPADA inclusivity, exclusivity, and environmental strain panels were obtained by time of its report to DHS in 2011 (LANL 2011a). Some of these strains were obtained as cultures and others as purified nucleic acids.
LANL scientists went through an extensive process to obtain and qualify these 214 strains to verify that the materials were the agents specified and to assess the purity, quality, and concentration of the nucleic acid prior to use (Omberg 2014). The multistep characterization varied with species based on published information, but
involved a combination of PCR for plasmid identity and/or specific genomic signatures, sequencing of the 16S rDNA gene, multi-locus sequence typing (MLST), canonical single nucleotide polymorphism (SNP) analysis, amplified fragment length polymorphism (AFLP) analysis, and variable number tandem repeat (VNTR) region analysis to confirm strain identity. Samples were characterized at both the species level and the strain level. (LANL 2011a, p. 22)
A table summarizing the strain characterization procedures used by LANL for different species is included in Appendix A.
LANL investigators reported several challenges. It was difficult to identify strain sources for certain samples of DNA and, in some cases, multiple or inconsistent nomenclature in the literature complicated the ability to determine that they were obtaining the correct strain. Once obtained, some strains were discovered to be contaminated or to have lost canonical sequences (e.g., exhibited mutations in the set of single nucleotide polymorphisms used to type the strain or had lost particular plasmids normally contained in that strain of that particular pathogen). LANL reportedly went through three different sources to obtain one particular strain. It also noted that some species and strains in the SPADA panels were very precisely specified whereas others, particularly on the environmental panels, were specified only generally (e.g., pine pollen). LANL did not undertake the same level of extensive characterization of the SPADA environmental panel materials as it undertook for the inclu-
sivity and exclusivity panels because there was insufficient literature on how to proceed for many of the organisms.
LANL’s work assembling and qualifying strain reference materials for subsequent assay performance evaluation has implications for a BioWatch performance standard and the qualified reference materials that are needed to support the standard. It was not a trivial exercise or inexpensive process for LANL to identify, assemble, and quality control the materials they obtained, which represented the majority (but not entirety) of the inclusivity and exclusivity strains recommended by SPADA for the representative set of agents they examined. Similarly, MRI Global assembled SPADA strain panels (inclusivity targets, near-neighbor and background exclusivity panels, and potentially interfering environmental substances) for at least one biothreat agent of relevance to BioWatch. The effort in time and costs to identify sources for these strains or strain nucleic acids, acquire them, and undertake quality control and sample preparation were similarly nontrivial, although the committee does not have a precise figure for these costs (Matthew Davenport, Johns Hopkins University Applied Physics Laboratory, personal communication, January 8, 2015). An important question posed by LANL and others is “how good is enough” for ensuring the microbial strain identity and quality of DNA in the panels that will be used for assay validation. Both the number of required strains and the level to which they need to be qualified will affect the cost required to assemble and maintain reference material collections. The strain panels recommended by PHAA and FSAPE are more extensive in number than the SPADA panels, which may make this process even more complicated.
There are obvious tradeoffs between how precisely reference materials can be qualified, how thoroughly the performance of an assay can be characterized and validated, how fast this can be accomplished, and how much the effort will cost:
- The greater the number of inclusivity, exclusivity, and environmental materials against which assays should be tested, the longer it will take to obtain and validate these materials. The largest investment of time and cost is incurred during initial panel assembly, although there are ongoing production and quality control expenses associated with providing the materials to users (making additional culture stocks or extracted DNA as needed, ongoing quality control monitoring of existing lots, and testing of new lots, etc.).
- The more precisely assay reagents and reference materials need to be quality-tested initially and the more frequently they need to be re-tested, the more the time and cost will increase. For example, some materials may be subject to higher mutation rates or to the frequency with which plasmid gain or loss occurs. DHS should explore the question of “what’s close enough” with regard to genetic changes for DNA to be considered the same strain, in order to inform its assay and system testing.
- The better the available data curation—for example, the existence of high-quality sequence data deposited into reference databases and documentation on other strain characterization parameters—the greater is the likelihood that some labor and resource costs may be reduced.
- The greater the number of inclusivity, exclusivity, and environmental materials against which assays should be tested, the more precisely assay specificity will be known but the higher the time and cost to conduct the assay testing. Similarly, requiring testing with a greater number of replicates will increase statistical confidence in the assay performance results but increase time and cost.
Table 3-5 summarizes the cost information provided to the committee from several sources. The cost estimates for performance testing given in the table include the stages of laboratory testing undertaken to determine assay probability of detection and LOD, assay specificity using inclusivity, exclusivity, and environmental panels, and, where applicable, testing using BioWatch filters to provide background. The costs do not include multisite collaborative validation, a component that is found in the AOAC validation guidance documents. In addition to the information in Table 3-5, a commercial vendor has taken a PCR detection system through a SPADA-based validation process. It took BioFire 2-3 years and roughly $3+ million dollars to validate its RAZOR EX device to the full AOAC/SPADA standard for the detection of B. anthracis, which included performance testing conducted by BioFire, production of testing kits for additional testing, program management, and report writing, but did not include the independent laboratory testing conducted by MRI Global to address AOAC/SPADA requirements for multilaboratory validation (Matthew Scullion, BioFire, personal communication, December 12, 2014). Undertaking independent laboratory validation at MRI Global to repeat the vendor testing conducted by BioFire took roughly a month and cost approximately $300,000, although it is estimated that costs for independent validation under the SPADA approach might be able to be reduced to something on the order of $150,000 based on lessons learned and/or revisions in the required testing (Matthew Davenport, personal communi-
TABLE 3-5 Estimated Time and Cost Associated with Assay Testing and Reference Material Provision
| Step | Details | Completion Time (approx.) | Cost (approx.) |
|---|---|---|---|
| Assembly and quality control of reference materials (strain panels) | SPADA (214 strains obtained by LANL) | 18 months | $1. 2Ma |
| PHAA (to identify strain sources and develop extracted material) | 2 years | $0.5-1M | |
| Testing laboratory setup costs | LANL for BioWatch assay testing | $2.1M | |
| Assay performance testing | BioWatch process | 7 months | $0.6M |
| SPADA/PSAA | 6 months | $0.4M | |
| PHAA | 2 or more years | $1-2Mb | |
| Platform performance testing (comparison of two Gen-3 vendor systems with reference system) | LANL for BioWatch vendor system testing | 9 months, setup to completion | $4.4M |
| Ongoing assay and reference material provision | PCR assays and reagents; most strains on SPADA panels that are bioweapons agents | Available through CRP catalogue | $909 per strain vial (~200 ng DNA/ vial). Strains sold individually (not in panels) |
| PCR Mastermix | $4 per reaction (sold in vials suitable for variable numbers of runs and using variable technologies) | ||
| PCR positive plasmid controls | $90 per 50-µl tube | ||
| PHAA panels and LRN assays | Coordinated through DHS S&T Directorate | Available through subject-matter experts who hold the identified strains in their laboratories | |
a Cost includes nucleic acid acquisition and quality control. The unburdened nucleic acid acquisition cost was reportedly $605k (Omberg 2014); the cost to acquire nucleic acid including labor to extract DNA was reportedly $1.4M (Walter 2014b). The differences reported
in quality control costs ($560k in Omberg [2014] and $982k in Walter [2014b]) presumably represent differences in how these figures are calculated and what costs are included.
b A figure of 2 or more years and $1.2M per agent was reported by Walter (2014b). A figure of $1.8M “end to end” over 2-3 years per agent was reported by scientists at CDC, who noted that this figure reflects elements associated with LRN assay submission under FDA regulations. The CDC scientists suggested that the figure might be reduced by roughly half for environmental assay validation that did not involve FDA approval (Toby Merlin and Harvey Holmes, CDC, personal communication, December 2, 2014).
SOURCES: LANL 2010, 2011a,b, 2012a,b; CRP 2015; Walter 2014b; Toby Merlin and Harvey Holmes, CDC, personal communication.
cation, January 8, 2015). BioFire’s and MRI Global’s costs for this activity were supported primarily by DHS.10
These expenses are not insignificant. On the other hand, investments have already been made and are continuing to be made in assembling relevant panels of strains and establishing workflow processes in independent testing laboratories, both at private companies and in national laboratories. Initial work to assemble SPADA panel strains has been undertaken by CRP and LANL, while work identifying sources from which to assemble PHAA/FSAPE strains has occurred and appears to be ongoing by DHS and CDC. These efforts provide a base for undertaking future performance characterization and validation studies should the need arise.
An important consideration is who should bear the burden in time and cost of which parts of assay development, performance testing, and validation. For clinical diagnostic use, a significant burden is on the medical assay or device developer to sufficiently demonstrate performance in order to obtain FDA approval. The health care market is a key driver of advancing technology, and the potential financial rewards to developers for a successful product help support this system. Although an overseeing regulatory authority such as the FDA does not exist in the environmental biosurveillance realm, biodefense remains a potentially significant market. Government agencies serve as substantial buyers of technology; however, different local, state, and federal agencies and programs may need different types of assays and devices to meet different mission needs.
___________________
10 The RAZOR EX device was developed as a portable field detection system using pouches of reagents; it is not the same as the system of collectors and laboratory-based PCR assays used in the BioWatch program. However, it provides the only data point available to the committee on the time and cost associated with validating a biothreat detection device to the full AOAC/SPADA standard.
One approach that could be considered would be for assay and device developers to be required to undertake initial studies to validate assay specificity using extensive in silico screening as well as a reasonable amount of laboratory testing against a set of inclusivity, exclusivity, and environmental organisms and substances. For example, developers might be asked to document performance testing against some or all of the SPADA strains. Further validation conducted by DHS through independent laboratories could be used to confirm the performance reported by the developer against a subset of the same strains and to conduct performance validation testing against additional strains to further sample genetic diversity (e.g., using additional priority strains drawn from the PHAA/FSAPE panels). Such a model would enable validation costs to be shared and would mean that validation testing is undertaken at several steps in the process from assay design to operational use. Both SPADA and PHAA/FSAPE guidelines list potential tools and databases that can be used for in silico screening (DHS 2011, 2014; AOAC 2014).
In estimating the time lines and budgets necessary for assay performance characterization and validation, it will also be important to take into account the implications of obtaining “failures” at different points in testing. Both SPADA and PHAA/FSAPE pool DNA from exclusivity and/or environmental strains to reduce test numbers. But for each pool that produces an unexpected assay result, individual agents will still need to be tested separately and so the potential cost savings from a pooling strategy, for example, will not be perfect.
USE OF PRIOR AND ONGOING PERFORMANCE TEST INFORMATION
CDC is currently testing its LRN assays, which are used by BioWatch as secondary assays, to the PHAA standard for submission to FDA (clinical diagnostic use). PHAA/FSAPE guidance includes more extensive inclusivity and exclusivity strain panels than SPADA. PHAA/FSAPE also uses a fairly similar overall testing approach to that suggested by the committee, although the committee has suggested conducting a larger number of exclusivity and environmental panel replicates than the n = 3 specified under PHAA/FSAPE. If CDC is willing to share its performance testing data with the BioWatch program, the committee does not mean to imply that the BioWatch program should duplicate all of the time, effort, and cost that will have gone into CDC’s work on these assays.
LANL, on behalf of DHS, has conducted testing on several of the CRP assays, which are used by BioWatch as screening assays. The approach used by LANL involved SPADA panels and was not exactly the same as the approach suggested by the committee, but is also very similar. The
committee likewise does not intend to imply that the BioWatch program should redo the existing foundation of work that has been conducted or is ongoing. The committee wishes to emphasize three points, however:
- The need to annually revisit all strain panels in light of new genetic knowledge and, for example, specific suggestions such as those made by Paul Jackson and Stephen Morse with regard to SPADA panels (see Appendix A for further details on these suggestions).
- The need for BioWatch to better understand actual environmental background to inform assay design (target sequences, primers, and probes), assay testing (identification of the most important inclusivity, exclusivity, and environmental strains and substances), and user understanding of assay performance. The committee stresses the usefulness of this knowledge, which remains very limited.
- The need for communication with laboratory experts and jurisdictional officials on the detailed performance data obtained, the necessary limits to what can be accomplished through in silico and laboratory assay testing, and how the data can be interpreted and used. The committee aims to recognize the valuable efforts that have been made to obtain assay performance data but does not wish the message to be that DHS, CDC, and others have conducted all of the necessary testing and that jurisdictions should trust that fact without enabling data access and discussions.
In this chapter, the committee explored key factors that will affect whether a PCR assay standard is suitable for performance testing and validation as part of the BioWatch program. However, the steps that surround the PCR play critical and interconnected roles in the overall system. Supporting the entire system is an ongoing validation and quality assurance framework.


