
The major spring systems of the Edwards Aquifer are home to many plants and animals, including seven federally listed endangered species, one federally listed threatened species, and three vulnerable species for which petitions for addition to the endangered species list have been filed (see Chapter 1). There are many threats to the listed species, including loss of habitat from reduced spring flows, interactions with non-native species, habitat destruction or modification by humans (e.g., recreation, bank erosion), and other factors that degrade water quality. Three of the species covered by the Incidental Take Permit—the fountain darter, the Comal Springs riffle beetle, and Texas wild rice—are designated as indicator species, whose protection under the Habitat Conservation Plan (HCP) is assumed to ensure adequate protection for the other eight species. This chapter first discusses what is found in the HCP regarding the indicator species, in terms of the goals for each species and the habitat suitability analysis. Next, the chapter discusses the development of ecological models for the fountain darter, submersed aquatic vegetation (SAV), and the Comal Springs riffle beetle, which are the only new ecological models that have been proposed to date. The chapter concludes with recommendations for improving these modeling efforts.
WHAT IS IN THE HABITAT CONSERVATION PLAN?
The HCP provides a baseline of information on the listed species that is to be built upon during the 15 years of HCP implementation, particularly during Phase I (the first seven years). Long-term biological goals are speci-
fied for the listed species, in terms of the desired density of individuals in key habitat types, desired habitat areal coverage, and critical water quality and quantity parameters that must be attained and maintained over the life of the HCP. It is not the purpose of this National Research Council (NRC) report to critique the biological goals as they will be the subject of the third and final NRC report. However, they are presented here for all of the listed species to provide context.
In addition to the biological goals, the HCP outlines a biomonitoring program intended to gather data on the listed species that can then be used to ensure compliance with the biological goals in the HCP, assess the health of the communities, parameterize and test the ecological models, and gain greater understanding of species biology and ecology. Although the Committee’s main critique of the biomonitoring program can be found in Chapter 4, the monitoring efforts for some species are mentioned here when critical to the ecological modeling efforts.
Finally, for all of the listed species, a spring flow objective has been assigned, below which the species are thought to be imperiled. The values used for spring flow objectives were derived from habitat suitability analyses done for the fountain darter, Texas wild rice, and he Comal Springs riffle beetle (and appear as appendices to the HCP). Because these analyses represent the current state of ecological modeling for these species, a description and critique of the efforts are provided here. (Note that the Committee did not perform a comprehensive review of all possible ecological models for the indicator species, but rather focused on those recently used, currently in use, or planned.)
As described in Box 3-1, the habitat suitability analyses were all supported by two-dimensional hydrodynamic models that estimated the distribution of water depths and velocities as a function of simulated flow rate for specific sections of both the Comal and San Marcos Rivers. Temperatures were derived from simulations of the QUAL2E water quality model. These model outputs were used in combination with habitat suitability curves for water depth and velocity to estimate available habitat for Texas wild rice and the Comal Springs riffle beetle (CSRB) over a variety of flow rates. Fountain darter habitat was modeled using water depth, velocity, temperature, and vegetation type, with vegetation data being derived from historical vegetation maps.
Texas Wild Rice
Within the HCP there are biological goals, a habitat suitability analysis, and a description of biomonitoring in the San Marcos system, all for Texas wild rice. However, the HCP also places great importance on SAV because of its role in providing fountain darter habitat. Thus, the ecologi-
Box 3-1
Hydrodynamic and Water Quality Modeling to Support the Habitat Suitability Analyses
The first habitat suitability analysis done for fountain darter, Texas wild rice, and Comal Springs riffle beetle (Hardy, 2009) relied on 2-D hydrodynamic models of the Comal and San Marcos rivers (RMA2 for the Comal system; FESWMS for the San Marcos system). Predictions of dissolved oxygen and temperature were generated from the QUAL2E model. The model HEC-RAS (1-D) was used to generate water surface elevations, which served as boundary conditions for each river segment, and each segment was simulated separately. Vegetation was mapped to the 2-dimensional cells within each segment to determine roughness and velocities near the bottom. Water depths and velocities were predicted under steady-state conditions for each segment separately. Water temperatures under steady state conditions were simulated for the entire system rather than segment by segment. For the purpose of the first habitat suitability analysis, the Comal system was divided into 18 segments and the San Marcos system into 21 segments. Simulation results for Comal consisted of velocities, depth, and temperature for a series of constant spring flows (30, 60, 100, 150, 300 cfs) and specified alternative routing between the Old and New Channels. Simulations for San Marcos were similar, and generated depths, velocities, and temperature for a series of constant spring flows (15, 30, 65, 100, 135, 170, 190, and 200 cfs).
In a follow-up habitat suitability analysis (Hardy et al., 2010), the 2-D hydrological framework used in the first analysis was improved upon. The second analysis included habitat and temperature effects at spring flows observed during drought conditions. Topography and vegetation mapping were updated, and the model MDSWMS was used to simulate 2-dimensional hydraulics in separate segments in the riverine portions of each system. The Comal system was divided into 11 riverine segments and the San Marcos system into 12 riverine segments, both with 0.25 meter resolution. Calibration was done for each segment. The lakes in both systems were also simulated, with habitat in Spring Lake considered fixed and independent of spring flow and habitat in Landa Lake dependent on flow due to drying of some potential habitat areas. The QUAL2E model was re-calibrated for both systems to simulate temperature. The models were calibrated to 2009, and then used to simulate velocities, depths, and temperature for a series of fixed spring flows (30 to 260 cfs for San Marcos; 30 to 300 cfs for Comal).
cal model currently being developed is for SAV, with the goal of eventually coupling the SAV and fountain darter models to enable simulation of spatially and temporally varying habitat within the fountain darter ecological model. There is also the possibility that the SAV model might be modified in the future to encompass Texas wild rice (i.e., to predict Texas wild rice responses to variation in flows and other environmental conditions). The sections below focus only on Texas wild rice, while the section on ecological modeling later in the chapter focuses exclusively on SAV.
HCP Goals and Objectives for Texas Wild Rice
The long-term biological goals for Texas wild rice are based on maintenance of areal coverage in four segments of the San Marcos River. According to the HCP, the actual long-term goals (Table 3-1) are based on an evaluation of (1) the maximum occupied area of Texas wild rice that has been present in the San Marcos system over time; (2) Texas Parks and Wildlife Department analysis of the Hardy et al. (2010) physical habitat modeling; and (3) the 1996 U.S. Fish and Wildlife Service (FWS) recovery plan goals (USFWS, 1996; EARIP, 2012, Section 4.1.1.2).
Three management objectives have been formulated with respect to the long-term goals for Texas wild rice: a minimum areal coverage during the drought of record, recreational awareness, and restoration and expansion efforts. The minimum areal coverage objectives have been formulated separately for each of the river segments (Table 3-2).
A major concern regarding Texas wild rice is recreational activity in high-quality habitat areas of the San Marcos River, including swimming, snorkeling, SCUBA, non-motorized boating, tubing, wading, fishing, and recreating with dogs. Although the exact impacts of these recreational activities on Texas wild rice are unknown, a greater percentage of plants are exposed to potential negative consequences as discharge decreases. Damage to Texas wild rice stands by recreationists, particularly dogs, through direct contact has been documented (EARIP, 2012, pp. 4-42). Texas wild rice is further impacted through fragmentation of other vegetation that then floats downstream eventually collecting on Texas wild rice stands. While there are hard-scaped access points in all adjacent city parks, numerous ad hoc access trails created by recreationists contribute to bank erosion. The HCP targets the entire San Marcos River for recreation awareness, and four segments
TABLE 3-1 Long-Term Biological Goal for Texas Wild Rice in Four Segments of the San Marcos River
| River Segment | Areal Coverage (m2) | Reach Percentage of Total Areal Coverage |
| Spring Lake | 1,000–1,500 | n/a |
| Spring Lake Dam to Rio Vista Dam | 5,810–9,245 | 83–66 |
| Rio Vista Dam to IH-35 | 910–1,650 | 13–12 |
| Downstream of IH-35 | 280–3,055 | 4–22 |
| TOTAL | 8,000-15,450 | 100 |
SOURCE: EARIP, 2012, Table 4-10.
TABLE 3-2 Minimum Texas Wild Rice Areal Coverage per Segment During Drought of Record-Like Conditions
| River Segment | Areal Coverage (m2) | Reach Percentage of Total Areal Coverage |
| Spring Lake | 500 | n/a |
| Spring Lake Dam to Rio Vista Dam | 2,490 | 83 |
| Rio Vista Dam to IH-35 | 390 | 13 |
| Downstream of IH-35 | 120 | 4 |
| TOTAL | 3,500 | 100 |
SOURCE: EARIP, 2012, Table 4-11.
within three reaches have been identified as targets for recreation control when flows decline below 100 cfs.
Recreation control during low-flow conditions within key high quality habitat areas for Texas wild rice is viewed as necessary in order to limit unnecessary impacts, rather than general recreation restriction for large parts of the river. Therefore the City of San Marcos plans to establish five or more permanent river access points to allow public access while attempting to limit potential damage. Areas between these access points will be planted with vegetation to discourage streamside access. The Texas Parks and Wildlife Department will further restrict access along select shoreline areas during low flow conditions by establishment of State Scientific Areas. The City of San Marcos will construct kiosks at key locations to provide information to the public detailing access points, protected or restricted areas, and other educational information.
Active restoration and Texas wild rice expansion efforts are to be focused primarily on high-quality habitat areas. The City of San Marcos and Texas State University will implement a Texas wild rice enhancement and restoration program. Areas that have a high probability of success based on the Hardy et al. (2010) habitat suitability analysis will be targeted for Texas wild rice restoration and habitat enhancement.
In addition to the habitat-based long-term biological goals and the associated restoration and water quality management objectives, the HCP also identifies flow-related objectives for Texas wild rice (Table 3-3).
Habitat Suitability Analysis for Texas Wild Rice
Over the last 15 years, there have been several efforts to determine habitat suitability criteria for Texas wild rice (Bartsch et al., 2000; Hardy, 2009; Hardy et al., 2010). Factors such as water depth, substrate type, wa-
TABLE 3-3 Long-Term Average and Minimum Total San Marcos Spring Discharge Management Objectives. These apply not only to Texas wild rice but also to fountain darter and other species.
| Description | Total San Marcos Discharge (cfs)a | Time-step |
| Long-term average | 140 | Daily average |
| Minimum | 45b | Daily average |
aAssumes a minimum of a 50-year modeling period that includes the drought of record
bNot to exceed six months in duration followed by 80 cfs (daily average) flows for 3 months.
SOURCE: EARIP, 2012, Table 4-13.
ter velocity, canopy cover, and the concentrations of inorganic compounds including dissolved oxygen have been considered to influence Texas wild rice populations. The most relevant habitat suitability curves have been found to be those based on water depth and velocity, and most habitat suitability analyses for Texas wild rice have focused only on those two parameters. Texas wild rice data collected by the Texas Parks and Wildlife Department and by the FWS were used to generate very similar habitat suitability criteria, showing that the most suitable water depths for Texas wild rice range from about 1 to 3 feet, and the most suitable water velocities range from about 0.5 to 2 ft/sec (Hardy, 2009, Figures 26-27). Values for suitability, based on single or multiple parameters, vary from 0 to 1.
Habitat suitability criteria for water depth and velocity were used in the following equation to determine overall habitat suitability for Texas wild rice in various sections of the San Marcos River (Hardy, 2009):
Overall suitability = depth suitability × velocity suitability
where depth suitability and velocity suitability are determined by taking their respective values for the hydraulic simulation results at a node and using linear interpolation between the defined suitability values from the habitat suitability index curves. The suitability value determined for a computational cell is then multiplied by the cell area, generating a Weighted Usable Area for that cell. At a given simulated discharge, all Weighted Usable Area values are summed within a specific computational reach to generate a total quality-weighted area at the reach level.
Hardy (2009) provided results from multiple different habitat suitability analyses for Texas wild rice. Some of the later analyses benefitted from more precise physical modeling of the river system or from more recent data sets. Nonetheless, all of the analyses show the same basic trends, which are
that the most suitable habitat for Texas wild rice seems to peak around 150 cfs, and that suitable habitat begins to decline below discharge rates of 100 cfs and drastically declines at rates below 65 cfs (Hardy, 2009, Figure 45). Observed Texas wild rice data superimposed on the model predictions for areas of suitable habitat provided some support for the model’s ability to identify high and low quality habitat (see Figure 3-1). Many of the observed locations of Texas wild rice were in or near cells that were predicted to be high quality. Furthermore, the model predicted little to no Texas wild rice habitat in Spring Lake, which is expected because there is no flow in the lake above the threshold for Texas wild rice. Similarly, in the lower San Marcos River, the model predicted poor habitat because of deep water, which agrees with the lack of Texas wild rice in that area.
Several improvements were made in a subsequent habitat suitability analysis (Hardy et al., 2010). The two-dimensional hydrodynamic models and the QUAL2E models of the river systems were updated, and habitat criteria for Texas wild rice were updated based on more recent monitoring data (see Figure 3-2). Vegetation mapping was conducted in both river systems and integrated into the hydraulic modeling as spatially explicit roughness and in the habitat modeling as vegetation composition. The 2009 Texas wild rice monitoring data collected by the Texas Parks and Wildlife Department and FWS were combined with current vegetation maps.
The modeling approach was similar to previous analyses, in that depth and velocity were the two main controlling factors for determining habitat suitability for Texas wild rice, but the two factors were combined as a geometric mean rather than as a simple product:
Overall Suitability = (depth suitability × velocity suitability)1/2
The model was run for various fixed spring flows ranging from 30 cfs to 260 cfs. As expected, optimal habitat for Texas wild rice increased as discharge increased, until habitat began slowly decreasing as flows exceeded 150 cfs. Because low flows (30-80 cfs) are the focus of the HCP, and because the model predicted little variation in the optimal amount of habitat for Texas wild rice at such flows (see Figure 3-3), Hardy et al. (2010) concluded that “…the proposed flow regime within the San Marcos River being considered by the EARIP will provide adequate quantity and quality habitat to sustain this species during similar instances as the drought of record provided effective recreation control can be implemented.”
Interestingly, Texas wild rice currently occupies only a small percentage of its optimal habitat as defined by depth and velocity (see Figure 3-1; Hardy et al., 2010). There could be many reasons: non-optimal discharge, competition with other plant species, human disturbance, poor water quality, and other factors that limit Texas wild rice survival in these areas. There
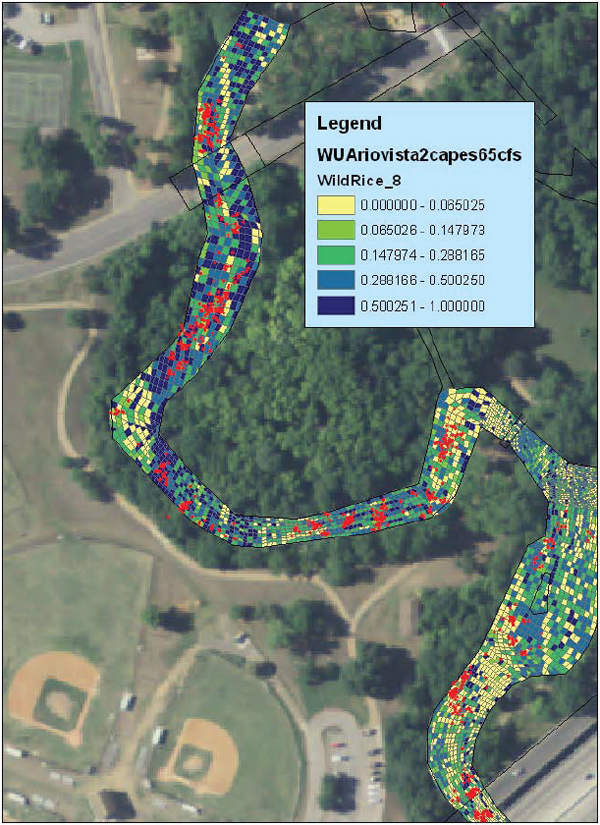
FIGURE 3-1 Spatial distribution of predicted Texas wild rice computational cell suitability ranges versus the 1989 to 2008 spatial distribution of Texas wild rice stands (red dots) in the Rio Vista to Cape’s Dam section. Simulated discharge is 65 cfs.
SOURCE: Hardy (2009).
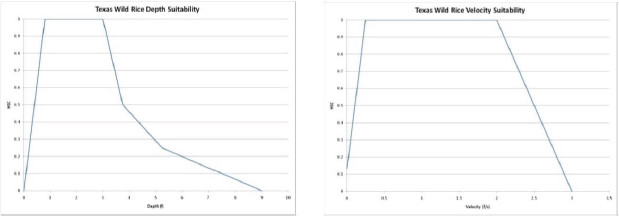
FIGURE 3-2 Updated habitat suitability curves for water depth in ft (left) and velocity in ft/sec (right) used in the Hardy et al. (2010) analysis.
SOURCE: Hardy et al. (2010).
are about 2,600 m2 of Texas wild rice in the entire San Marcos River, but there could be well over 35,000 m2 if the discharge was optimal and assuming only depth and velocity determined habitat quality. The Hardy et al. (2010) report mentions the possibility of expansion of Texas wild rice into areas that are optimal but not currently occupied by Texas wild rice as well as a 2-m buffer around existing stands.
Currently, the habitat suitability analysis is the only ecological model for Texas wild rice. Given the lack of plans for a more rigorous Texas wild rice ecological model, the Committee recommends continuing and improving upon the habitat suitability effort. The goal would be to better account for the areas predicted to be suitable habitat that, in fact, do not support Texas wild rice. That is, failure of Texas wild rice to establish in an area determined to be optimal based on the habitat suitability analysis could point to other important driving variables like competition from non-native species (see Chapter 1 page 22), recreation, and other human activities. It would also be useful to update the analyses to include the effects of restoration efforts for Texas wild rice. Specifically, it would be beneficial to quantify all recreation exclusion, replanting, and other minimization and mitigation activities, particularly as they relate to the assumed optimal habitat. As discussed in Chapter 5, such information could be gathered from targeted Applied Research projects. In general, data on the distribution of Texas wild rice could be used annually to help validate the habitat suitability analysis, which would also be improved by the inclusion of error estimation (e.g., in the hydrodynamics model).
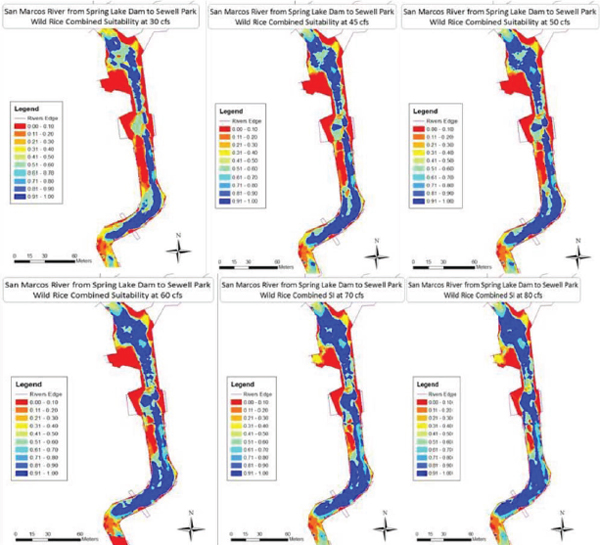
FIGURE 3-3 Combined suitability for Texas wind rice physical habitat for a range of discharge (30-80 cfs) within the Saltgrass to Sewell Park reach of the San Marcos River.
SOURCE: Hardy et al. (2010), Figure 29.
Fountain Darter
HCP Goals and Objectives for Fountain Darter
The long-term biological goals for the fountain darter are based on maintenance of preferred fountain darter habitat. Four representative reaches in Comal system (Upper Spring Run, Landa Lake, Old Channel, and New Channel), and three representative reaches in the San Marcos system (the Spring Lake Dam, City Park, and I-35 Reaches) (Figure 3-4) have been identified for achieving the goals. The goals consist of maintaining the areal coverage of aquatic macrophytes and algae, and the densities of fountain darters, at or above the median values observed for each
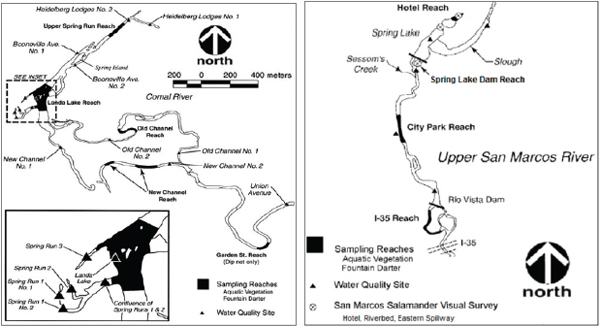
FIGURE 3-4 Schematics showing the reaches for Comal (left) and San Marcos (right) spring systems to be used in monitoring for fountain darter habitat and population densities.
SOURCE: EARIP (2012).
during the decade-long EAA Variable Flow Study (BIO-WEST, 2007; see Table 3-4). The approach to determining the vegetation areal targets was to use the spring and fall vegetation mapping in each representative reach and to couple the areal targets with defined darter densities (median values observed in the study) by vegetation type. Achieving both would then confirm that both habitat and darters were at their targeted values (habitat area and number of fountain darters per area).
The HCP does not state what actions will be taken if measured darter densities fall below the median density goals in certain vegetation types in certain reaches, nor is there any discussion of variability in the median values of darter densities.
The Edwards Aquifer Authority (EAA) has formulated two management objectives for achieving the fountain darter long-term goals: (1) restoration and protection of native vegetation and (2) maintenance of historical water quality. The native vegetation (also considered the preferred habitat of fountain darters) will be protected, and restored when damaged, to maintain species-specific areal coverages at or above the values shown in Table 3-4. Surface water quality will be maintained within a 10 percent deviation of all monitored parameters, except temperature and dissolved oxygen, from the average recorded water quality measured at 15 locations during the EAA Variable Flow Study. This water quality objective is based on the assumption that a 10 percent deviation in average conditions would
TABLE 3-4 Goals for Fountain Darter Habitat (Aquatic Vegetation Areal Coverage, m2) and Fountain Darter Density (Number/m2) for Each Habitat Type in Comal and San Marcos Springs
| COMAL SPRINGS | |||||||
| Coverage (m2) | Bryophytes | Hygrophila | Ludwigia | Cabomba | Fil. Algae | Sagittaria | Vallisneria |
| Upper Spring Run | 1,850 | 650 | 150 | 0 | 0 | 600 | 0 |
| Landa Lake | 4,000 | 250 | 900 | 500 | 0 | 1,250 | 13,500 |
| Old Channel | 150 | 200 | 1,500 | 0 | 300 | 0 | 0 |
| New Channel | 150 | 1,350 | 0 | 350 | 0 | 0 | 0 |
| Fountain darter (no./m2) | 20 | 4 | 7 | 7 | 14 | 1 | 1 |
| SAN MARCOS SPRINGS | |||||||
| Coverage (m2) | Hygrophila | Ludwigia | Cabomba | Hydrilla | Potamogeton | Sagittaria | Vallisneria |
| Spring Lake Dam | 50 | 200 | 25 | 100 | 1,000 | 100 | 125 |
| City Park | 200 | 1,000 | 50 | 500 | 2,000 | 300 | 50 |
| I-35 | 50 | 200 | 300 | 100 | 300 | 100 | 25 |
| Fountain darter (no./m2) | 4 | 7 | 7 | 5 | 5 | 1 | 1 |
SOURCE: EARIP (2012).
TABLE 3-5 Long-Term Average and Minimum Total Discharge Management Objectives for Comal and San Marcos Springs
| Description | Total Comal Spring Discharge (cfs) | Total San Marcos Spring Discharge (cfs) | Time-step |
| Long-term averagea | 225 | 140 | Daily average |
| Minimumb | 30 | 45 | Daily average |
aAssumes a minimum of a 50-year modeling period that includes the drought of record.
bNot to exceed 6 months in duration followed by 80 cfs (daily average) flows for 3 months.
SOURCE: EARIP (2012).
be suitable for the darters; however, more extensive work to assess water quality tolerances of fountain darters will be addressed as part of the HCP. Water temperatures less than 25°C and dissolved oxygen concentrations greater than 4.0 mg/L will be maintained to ensure fountain darter survival, reproduction, and recruitment.
As with Texas wild rice, along with the habitat-based long-term biological goals and the associated restoration and water quality management objectives, the HCP also identifies flow-related objectives to help ensure maintenance of fountain darter populations (see Table 3-5).
Habitat Suitability Analysis for Fountain Darter
Three habitat suitability analyses were performed for fountain darter, described very briefly below; the reader is referred to the original reports for more information. The first two analyses (Hardy, 2009; Hardy et al., 2010) used the output of hydrologic and temperature models that predicted depth, velocity, and water temperature in computational grid cells within segments of each of the two systems (see Box 3-1). The first report (Hardy, 2009) related fountain darter habitat suitability to vegetation type, depth, velocity, and temperature. The second Hardy analysis (2010) was similar but used updated hydrologic models, dynamic temperature simulations, and revised suitability functions. The third habitat analysis only appeared in the HCP itself and used a habitat-based approach that was different from the two Hardy analyses. The HCP analysis was done for each of the representative reaches only, and used the area of the dominant vegetation, adjusted for spring flow, multiplied by assumed darter densities by vegetation type, also adjusted for spring flow, to determine darter abundances by representative reach every 6 months for 9 years during the EAA Variable Flow Study.
Hardy (2009). In the first analysis, habitat suitability was computed as the product of the individual suitabilities for depth, velocity (water column or
0.5 feet off the bottom), vegetation type, and temperature (daily average or maximum). The curves were determined by examination of field data coupled with expert opinion. Dissolved oxygen simulations were considered questionable because sediment oxygen demand and plant respiration were not explicitly included in the model.
As for the Texas wild rice analysis, the predicted weighted usable areas by region (groups of segments) were plotted across the assumed constant spring flows for both the Comal and San Marcos systems. A second constant flow analysis done for Comal used more spring flows and New/Old Channel splits, focused in the lower segments only, and used maximum daily temperature rather than averaged daily temperature. The weighted usable areas reported for old results (e.g., Bartsch et al., 2000) were compared to new results for the Comal and San Marcos systems that used revised channel geometries and habitat suitability curves.
Hardy et al. (2010). In the newer Hardy analysis, the updated hydraulic and QUAL2E models were combined with the geometric means of new habitat suitability curves for depth, velocity, and vegetation type (but not temperature) to determine weighted useable areas for the fountain darter. Two of the habitat suitability curves are shown in Figure 3-5, which imply that habitat quality for the fountain darter increases with depth, and it decreases as velocity exceeds 0.5 ft/sec. Habitat suitability for each vegetation and substrate type is given in Table 3-6.
The weighted useable area based on physical habitat was computed for the series of fixed spring flows for each system. Weighted useable area increased steadily with increasing spring discharge for the San Marcos system (see Figure 3-6), while it showed a sharp increase between about 10 and 30 cfs in the Comal system (Figure 3-7).
Once weighted useable areas were computed, the effects of temperature were factored in, keeping in mind three critical temperatures for the fountain darter: lethality at 94.6 F, reproduction ceasing above 86 F, and increased larval mortality starting at 78.8 F (Hardy et al., 2010). For San Marcos, thermal limitations were most apparent at flows below 45 cfs, although Spring Lake would remain cool. Hardy et al. (2010) concluded that darter reproduction and larval survival would be sufficient above 45 cfs in the San Marcos system. In the Comal system, significant temperature limitations were noted below 30 cfs, but generally not above 80 cfs. [Not all of the report conclusions are included here; details can be found in Hardy (2009) and Hardy et al. (2010).]
HCP Habitat Analysis. A third habitat suitability analysis appeared in the HCP, which was labelled as a population model, although it does not meet the standard definition of such a model. This analysis used the predictions
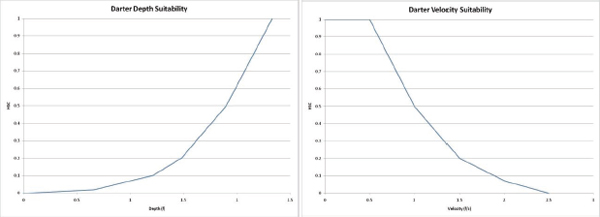
FIGURE 3-5 Habitat suitability curves for fountain darter as a function of water depth in ft (left) and water velocity in ft/sec (right).
SOURCE: Hardy et al. (2010).
TABLE 3-6 Habitat Suitability of Fountain Darter by Vegetation and Substrate Type
| Vegetation/Substrate classification | Code | HSI Value | Vegetation/Substrate classification | Code | HSI Value |
| Clay | 1 | 0.05 | Acmella oppositifolia | 27 | 0.25 |
| Silt | 2 | 0.05 | Arundo donax | 28 | 0.05 |
| Sand | 3 | 0.05 | Ceratopteris thalictroides 75-100% | 29 | 0.06 |
| Gravel | 4 | 0.05 | Ceratopteris thalictroides 50-75% | 29.1 | 0.06 |
| Cobble | 5 | 0.10 | Echinochloa sp | 30 | 0.05 |
| Small Boulder | 6 | 0.05 | Heteranthera dubia 75-100% | 31 | 0.80 |
| Large Boulder | 7 | 0.05 | Heteranthera dubia 50-75% | 31.1 | 0.80 |
| Bedrock | 8 | 0.05 | Hydrocotyle sp 75-100% | 32 | 0.20 |
| Large Woody Debris | 9 | 0.05 | Hydrocotyle sp 50-75% | 32.1 | 0.20 |
| Concrete | 10 | 0.05 | Juncus texanus 75-100% | 33 | 0.05 |
| Artificial Wood | 11 | 0.05 | Juncus texanus 50-75% | 33.1 | 0.05 |
| Metal | 12 | 0.05 | Justicia americana 75-100% | 34 | 0.00 |
| Hydrilla verticillata 75-100% cover | 13 | 0.29 | Justicia americana 50-75% | 34.1 | 0.00 |
| Hydrilla verticillata 50-75% cover | 13.1 | 0.29 | Iris pseudocoris | 35 | 0.60 |
| Hygrophila polysperma 75-100% cover | 14 | 0.93 | Ludwigia sp 75-100% | 36 | 0.56 |
| Hygrophila polysperma 50-75% cover | 14.1 | 0.93 | Ludwigia sp 50-75% | 36.1 | 0.56 |
| Colocasia esculenta 75-100% cover | 15 | 0.60 | Myriophyllum sp 75-100% | 37 | 0.80 |
| Colocasia esculenta 50-75% cover | 15.1 | 0.60 | Myriophyllum sp 50-75% | 37.1 | 0.80 |
| Potamogeton illinoensis 75-100% | 16 | 0.01 | Nasturtium officinale 75-100% | 38 | 0.00 |
| Potamogeton illinoensis 50-75% | 16.1 | 0.11 | Nasturtium officinale 50-75% | 38.1 | 0.00 |
| Zizania texana 75-100% | 17 | 0.11 | Nuphar advena | 39 | 0.20 |
| Zizania texana 50-75% | 17.1 | 0.11 | Nuphar advena | 39.1 | 0.20 |
| Zizania texana <50% mono with substrate | 17.2 | 0.11 | Ricinus | 40 | 1.00 |
| Sagittaria platyphylla 75-100% | 18 | 0.16 | Typha lattifolia | 41 | 0.60 |
| Sagittaria platyphylla 50-75% | 18.1 | 0.16 | Utricularia gibba | 42 | 0.00 |
| Cabomba caroliniana 75-100% | 19 | 0.54 | Vallisneria americana 75-100% | 43 | 0.13 |
| Cabomba caroliniana 50-75% | 19.1 | 0.54 | Vallisneria americana 50-75% | 43.1 | 0.13 |
| Ceratophyllum demersum 75-100% | 20 | 0.02 | Xanthosoma sagittifollium | 44 | 0.01 |
| Ceratophyllum demersum 50-75% | 20.1 | 0.02 | Cynodon dactylon | 45 | 0.05 |
| Submergent Vegetation Mix | 21 | 0.50 | Salix nigra | 46 | 0.05 |
| Emergent Vegetation Mix | 22 | 0.20 | Limnophila sessiflora | 47 | 0.20 |
| Submergent/Emergent vegetation mix | 23 | 0.25 | Chara sp | 48 | 1.00 |
| Floating vegetation | 24 | 0.00 | Algae | 49 | 1.00 |
| Floating/Submergent vegetation mix | 25 | 0.25 | Zizianopsis | 50 | 0.11 |
| Unclassified | 26 | 0.50 | Moss | 51 | 0.50 |
SOURCE: Hardy et al. (2010).
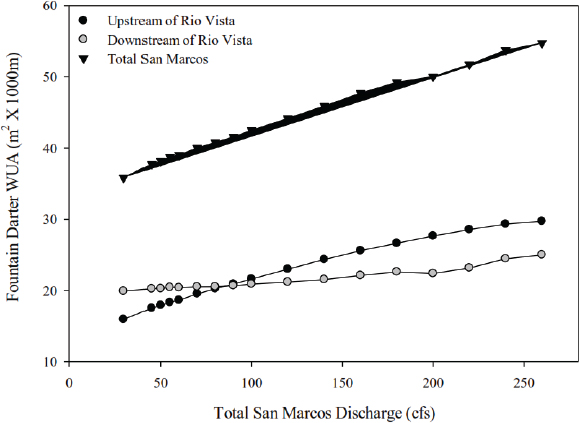
FIGURE 3-6 Relationship between the amount of fountain darter Weighted Usuable Area (m2 × 1000) upstream of Rio Vista (black dots), downstream of Rio Vista (gray dots), and total San Marcos River under various discharges.
SOURCE: Figure 40 from Hardy et al. (2010).
of spring flow generated by the MODFLOW model to determine fountain darter abundance under five scenarios: (1) no-action, where the HCP is not implemented (pumping of 527,000 ac-ft), (2) the existing baseline (pumping of 381,000 ac-ft), (3) the historical data (actual monthly flows), (4) implementation of the HCP-Phase 1, and (5) implementation of the HCP-Phase 2.
Unlike the Hardy efforts, habitat suitability in this analysis was related only to spring flows and vegetation type. First, a suitability function was defined for each vegetation type as a function of flow. Second, darter densities by vegetation type were estimated, and a habitat quality ranking (1–4) was defined that dictated which density value was used for that vegetation type. (A ranking of one means use the minimum density; a ranking of 3 means use the median density.) The goal of the analysis was to predict fountain darter densities and total darter abundance rather than a weighted useable
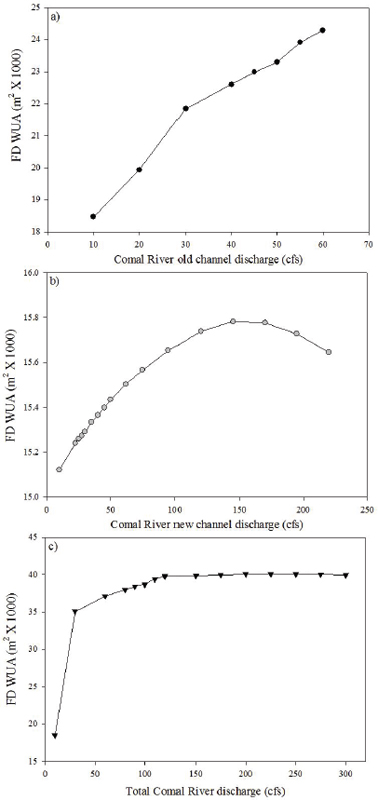
FIGURE 3-7 Weighted usable area (WUA) for fountain darter at various discharges within the Comal River.
SOURCE: Figure 48 in Hardy et al. (2010).
area (as was done in Hardy, 2009, and Hardy et al., 2010). The results of the analysis are presented in tables of darter abundance summed over the representative reaches. The results were also extrapolated to the entire river system, plotted as time series values, and interpreted as to whether the population would be extirpated or not. This third suitability analysis was not based upon standard and easily defensible methods and is not likely to be as useful as a predictive tool.
The first habitat analysis of fountain darter (Hardy, 2009) was admittedly pieced together from new and existing modeling results—issues that were mostly addressed in the second Hardy et al. (2010) habitat analysis. The models in the second analysis were standardized between systems and recalibrated, and the suitability functions were updated. While temperature was included as part of the first suitability analysis, temperature was treated separately, and in a less quantitative way, in the second analysis.
The HCP repeatedly refers to the two Hardy habitat suitability analyses with statements that are not easy to trace back to the reports. The first habitat suitability analysis was included as Appendix H of the HCP, while the 2010 analysis was well documented in a separate report and was referred to repeatedly in the main text of the HCP. An example of a statement that the Committee was unable to find supporting analyses for was “A review of the Hardy (2010) fountain darter modeling shows that there would be sufficient quality and quantity of habitat in all four reaches at long-term average flows (i.e., 225 cfs) to support the long-term biological goals for the fountain darter in the Comal system” (pp. 4-9, EARIP, 2012).
The HCP’s apparent reliance on the third habitat suitability analysis to assess the effects of various spring flow scenarios on fountain darter abundances is questionable because of methodological and interpretation issues. The third analysis would require major modification before it could be used further. Some of the underlying calculations are valid and useful, but the couching of the analysis as a population model and showing time series of predicted abundances connected together with lines (e.g., Figures 4-31 and 4-32 in EARIP, 2012) is wrong and can easily lead to misinterpretation of the results. Little or no justification was provided for the derivations of the vegetation suitabilities related to flow or for the assignment of rankings to use certain fountain darter densities.
One aspect of the habitat modeling that could be revisited is the estimation of the fountain darter suitability curves. Much has been done recently with statistically based fitting of suitability curves (e.g., Feyrer et al., 2011; Knudby et al., 2010; Zorn et al., 2012; Johnson et al., 2013), partially as a result of the interest in predicting climate change effects on habitat and development of new statistical methods. With the availability of the moni-
toring data and other information, a more formal estimation of the habitat suitability curves is warranted.
Comal Springs Riffle Beetle
HCP Goals and Objectives for CSRB
The long-term biological goals for the Comal Springs riffle beetle (CSRB) are maintenance of suitable silt-free habitat conditions and beetle population densities in representative reaches of Comal Springs (Spring Run 3, Western Shoreline, and Spring Island area). According to the HCP, silt-free habitat conditions will be maintained through continued spring flow at or above 30 cfs, protection of riparian vegetation in the areas adjacent to spring openings, and regulation of recreational activities throughout each of the three sample reaches. The CSRB population measurement goal is to maintain beetle densities greater than or equal to the median densities observed over the past 6 years of the EAA Variable Flow Study (i.e., ≥20 beetles per lure at Spring Run #3 and ≥15 beetles/lure on the western shoreline of Landa Lake and in the Spring Island area).
There are two management objectives designed for achieving the long-term goals for the CSRB. Silt-free habitat conditions will be maintained by protection and restoration of riparian vegetation in the areas adjacent to spring openings, particularly Spring Run 3 and Western Shoreline reaches, and regulation of recreational activities throughout each of the three sample reaches. The second management objective pertains to water quality and is the same as that for the fountain darter.
As with previously discussed species, to accompany the habitat-based biological goals and management objectives the HCP also specifies flow-related objectives (see Table 3-5), and it plans for further research to assess the CRSB’s water quality tolerances.
Unlike for fountain darter habitat, it is more complex to quantify the amount (or areal coverage) of high quality habitat for the CSRB, and measuring population densities has been a challenge. Major unknowns of the CSRB include any meaningful understanding of their life history, their true distribution, and their use of subsurface habitat. Because of this lack of information, the habitat-based component of this goal simply involves maintaining silt-free substrates (gravels and cobbles) at 90 percent or more of the area throughout the representative sample reaches.
Due to the paucity of data for CRSB in the San Marcos system, it is not possible to establish specific long-term habitat-based biological goals. As such, the HCP assumes that the flow-related goals presented in Table 3-5 would be protective of this species, until such time as additional information becomes available. The HCP argues that this is a reasonable assump-
tion because the CSRB inhabits similar areas to the San Marcos salamander and has similar habitat requirements, such that protection of the salamander and its habitat coupled with water quality protection of the aquifer should similarly protect CSRB. However, it is presently unknown to what extent these species actually overlap in the San Marcos system, as there has not been a quantitative study to determine the degree and variability in each species’ range.
The HCP considers the CSRB to be an indicator species whose protection could potentially cover other threatened or endangered species (see EARIP, 2012, pp. 4-38). Biological goals for these other species are described in Box 3-2. To date there are no empirical data available that can provide an objective assessment of how well the habitat requirements and population changes of the CSRB adequately represent these others species.
Habitat Suitability Analysis for CSRB
Hardy (2009) presents a habitat suitability analysis for the CRSB, with suitability being a function of water depth and velocity. This was followed by an updated analysis in Hardy et al. (2010). It is difficult to understand what information was actually used to determine the suitable habitat of the CSRB. For example, p. 36 of Hardy (2009) states: “Usual water depth in occupied habitat is 2 to 10 cm (1 to 4 inches) although the beetle may also occur in slightly deeper areas within the spring runs.” Yet there is no additional information given on these slightly deeper habitats in terms of their potential areal extent, and these areas of additional habitat are ignored from the equation used to model habitat. Other attempts to support the rationale for modeling CRSB habitat included a “modified random sampling technique” that indicated that the CSRB was restricted to the main spring runs at depths of up to 2.0 ft (0.61 m) and velocities of up to 2.0 ft/sec. In the final analysis, the suitable physical habitat of the CSRB was estimated simply as the total surface area of the main spring runs (Springs 1, 2 and 3) of Landa Lake where water depths were less than 0.02 feet (Hardy, 2009, p. 45).
Although this approach is conservative, it could underestimate the amount of suitable CSRB habitat, given that the beetle has been reported from additional major springs and spring orifices along the margins of and within Landa Lake (unfortunately depths have not been consistently reported). Interestingly, Hardy et al. (2010) discusses the fact that the main springs of Landa Lake ceased to flow for about 5 months in the early 1950s, but that CSRB populations were detected after flow resumed in these habitats, indicating that the populations in these springs can become reestablished after months of surface drying.
Given the limitations associated with sampling this species (see
Box 3-2
Biological Goals for Other Covered Species
Comal Springs Dryopid Beetle and Peck’s Cave Amphipod
The subterranean nature and restricted range of the Comal Springs dryopid beetle (to the headwaters of Comal Springs and spring upwelling areas) suggests that it does not require substantial surface discharge from the springs to survive. The HCP assumes that spring flow (of sufficient water quality) that continually covers spring orifices should prevent long-term damage to the population (EARIP, 2012). Similarly, the Peck’s Cave amphipod requirements include sufficient spring flow covering the spring orifices and adequate water quality to prevent long-term adverse impacts to the species. Also, like with other species, the HCP calls for more work within the Adaptive Management Program (AMP) to assess water quality tolerances of these species.
San Marcos Salamander
The long-term biological goals for this species are based on both qualitative habitat and quantitative population components, and they employ a representative reach approach similar to that of the CSRB. The population goal is to maintain equal or greater densities than the median observed density over the past 10 years of monitoring. Two management objectives are “aquatic gardening” (i.e., use of a harvester boat and hand cutting of vegetation by divers in the Riverbed area of Spring Lake) and recreational control similar to that used for Texas wild rice. These are to establish permanent access points along the banks of the San Marcos River and other areas as determined during the AMP, in addition to establishing State Scientific Areas.
Texas Blind Salamander
The HCP long-term biological goal for Texas blind salamanders is based only on water quality, with the same management objective as for the CSRB and other species (i.e., 10 percent deviation from historically recorded water quality), as well as a need for further research. Nevertheless, the HCP stipulates that previously discussed flow-related objectives are likely amenable to survival of this species.
Edwards Aquifer Diving Beetle, Comal Springs Salamander, and Texas Troglobitic Water Slater
These species are not presently on the federal endangered and threatened species list, but petitions have been filed. There are no explicit goals and objectives for these species in the HCP.
Chapter 4), it is not currently possible to model the true habitat availability or the occupied portion of the total available habitat. Until more quantitative sampling methods are developed and more is known about the beetle’s life history it will be difficult to model CSRB population or its preferred habitat and how these change in response to flow or sedimentation. Chapters 4 and 5 provide more detailed recommendations on how to improve these aspects of understanding CSRB.
A major activity of the HCP is the development of predictive ecological models for indicator species in the Comal and San Marcos Spring systems. The rationale given for the creation of these models is to be able “to investigate potential impacts to these ecosystems from extreme short-term and sustained long-term impacts from natural and anthropogenic factors, including local and regional groundwater withdrawals.” Although the HCP requires that the model(s) be capable of including plant, animal, hydrological, climatic, and management variables, and simulating interactions among all of these components, the only targets of modeling to date are the fountain darter and SAV, as discussed below. These models are significantly more complex than the habitat suitability analyses discussed in the preceding section because they consider many more of the factors and processes that control species abundance and they are capable of predicting species numbers under varying environmental scenarios, which is a goal of the HCP.
Submersed Aquatic Vegetation
There are six major types of SAV in the Comal system and seven in the San Marcos system, with four common to both rivers. The types and amount of SAV present in both systems change with season and annually. The modeling will need to take into account the variation among the SAV types in their growth dynamics and reproductive strategies, as well as their suitability for providing habitat for the endangered species such as the fountain darter. The goals of the SAV modeling appear to be two-fold: (1) provide habitat as input to the fountain darter ecological model, and possibly (2) predict SAV (and Texas wild rice) responses to changing environmental conditions.
The SAV modeling team is in the early phases of developing a spatially explicit biomass model of SAV. Because the modeling is still being planned, the following comments are based on the current plans and discussions with the model developers. It is not currently possible to provide comments
related to the details of the model’s structure or performance, which are likely to change as the modeling proceeds. The discussion below is based on a presentation made to the Committee at its second meeting and subsequent email exchanges and phone conversations with the modelers.
The present focus on SAV modeling is to provide dynamically varying habitat for the fountain darter individual-based model. The proposed SAV model is a somewhat simplified version of longstanding SAV models that have been developed for a single, well-mixed spatial box. The developers want to place the same type of model into a 2-dimensional spatial grid that matches the grid of the fountain darter model. By going from a point (single spatial box) to a spatially explicit version, representation of the processes of dispersal and recolonization becomes especially important. The modeling will focus first on the Old Channel reach of the Comal system. The grid will either be the same 2-dimensional grid that was used in the habitat suitability analyses (see Box 3-1) and is being used in the fountain darter model, or it will be an aggregated version of that grid (e.g., 0.25 m2 averaged for 1-m2 resolution). The spatial resolution needs to be appropriate for modeling SAV, while at the same time, also be appropriate for providing temporally and spatially varying habitat for the fountain darter model.
The model will simulate the processes of photosynthesis, respiration, mortality, dispersal, and recolonization. Photosynthesis, respiration, and mortality rates are likely to be computed daily and used to determine the change in biomass of the SAV in a cell due to intra-cell processes. Dispersal and recolonization are planned to be computed monthly and determine the exchange of biomass from the cell of interest to its neighboring cells (dispersal) and from neighboring cells into the cell of interest (recolonization). Multi-year simulations will be performed, and the model will generate the biomass (also converted to height and percent cover) for each cell for each day.
Photosynthesis, respiration, and mortality will likely use formulations adapted from existing SAV models. Some of the key existing models are CHARISMA (van Nes et al., 2003), which is 2-dimensional version of the MEGAPLANT model proposed by Scheffer et al. (1993a), a series of USACE models (Best and Boyd, 2007a,b), and similarly formulated species-specific SAV models described by others (Madden and Kemp, 1996; Best et al., 2001; Cerco and Moore, 2001).
There is some confusion about terminology used in the SAV modeling effort. The developers understandably referred to their model as agent-based, because that is what Wang et al. (2011) called their Chinese tallow tree model, which the developers cite as the source for their SAV recolonization formulation. Van Nes et al. (2003) also called their model individual-based, which is the same as agent-based, whereby plants are represented as individual units. In using the term “agent-based,” Wang et al. (2011) was
referring to the spatial aspect of their model (cells as agents), which is a non-standard use of the term. The proposed model would be best described as a biomass-based Eulerian model. While this does not affect the modeling itself, the fountain darter is truly individual-based and so use of clear terminology will help in communication.
Available inputs for the Comal SAV model include daily values of incident light (grid-wide), substrate type of each cell, and daily water temperature, depth, and velocity in each cell of the grid. Incident light is adjusted for its transmission through the water to the plant surface (i.e., via an extinction coefficient). Typically, light and temperature affect photosynthesis, temperature affects respiration, and mortality is often treated simply as a constant, but could also be dependent on substrate or other environmental variables.
The processes underlying dispersal and recolonization include fragmentation, seed release and subsequent development, and lateral growth. SAV employs a variety of mechanisms for dispersal and recolonization, including seeds, tubers, and fragments (Murray et al., 2009; Ailstock and Shaefer, 2004; Rybicki et al., 2001; Kautsky, 1988), which are affected by velocity, trapping, and viability of floral structure. One idea being considered is the use of a threshold biomass that, once exceeded, would trigger the dispersal and recolonization. Several options are then available for determining how much of the cell’s biomass goes to other cells and the amount of biomass that enters one cell from other cells. One option is simply to distribute the biomass randomly among cells; another option is to weight the destination cells by their quality (e.g., light, substrate, SAV biomass). One can use any number of functions to determine how much biomass leaves and where it goes to. The SAV modeling team indicated that it is exploring the use of the kernel function approach by Wang et al. (2011), as well as other functions.
A critical issue to address is the density-dependence of SAV growth and possibly also of mortality. At some point, SAV biomass cannot increase any further in a cell, as crowding will decrease growth or increase mortality. One approach being considered is to allow the formulations of photosynthesis and mortality to account for the effects of crowding. For example, light attenuation can be dependent on plant biomass so that eventually the plant biomass increases until light is too low for positive growth. Another approach being considered is based on the carrying capacity of each cell, in which the biomass relative to the carrying capacity would be used each day to adjust growth or change in biomass (e.g., like a logistic growth function). As biomass approaches the carrying capacity, the multiplier would act to reduce growth. Representing density-dependence realistically is important because it affects how SAV responds to changes in environmental conditions.
A second critical issue is the treatment of flow and water quality effects on SAV dynamics. Typically, one would specify how one or more of
the processes in the SAV model depends on flow directly and indirectly through changes in depth. For example, depth and turbidity would affect light availability. Presently, nutrient limitation is not included in the model formulation, but should be added if it is determined to be an important water quality factor affecting photosynthesis. (Indeed, some of the predecessor models include nutrient limitation.)
A third critical issue is deciding which taxa should be represented in the SAV modeling. One could develop a general SAV model, a model for certain SAV species (such as those preferred by the fountain darter like Ludwigia and bryophytes), or an SAV model for groups of species that have similar physical structure (i.e., functional groupings). There are advantages and disadvantages to each of these approaches. A general model enables use of information from multiple species but also approximates how any single species will respond. A model for each species requires the most information in order to specify parameter values and other modeling aspects, but is the easiest to interpret. A set of models based on structural similarity may be the best approach for generating habitat input to the fountain darter model, but may not be a good way to form functional groups to predict SAV responses to environmental variation. That is, the species lumped together may be structurally similar but respond very differently to other factors. Note that the model does not currently include filamentous algae, though it is a preferred habitat type for fountain darter.
Although there are system-wide vegetation maps, calibration and validation of the SAV model will be a challenge. An Applied Research project is currently being conducted to generate a conversion factor from percent cover of SAV recorded in the vegetation maps to biomass being predicted by the model. Accurate conversion is critical because model predictions of biomass will be compared to the spatial vegetation maps of coverage. If the modeling team takes the route of using a generic species or a functional grouping of species, it will not be straightforward to compare model predictions to species-specific field data. Also, the fine spatial scale thought to be needed for compatibility with the fountain darter model may not be ideal for simulating SAV biomass dynamics over seasons and among years. The small grid cells may not allow for accurate averaging of local conditions on a daily or monthly time step to enable the model to simulate 6-month changes in vegetation over multiple years.
While it is not yet possible for the Committee to rigorously evaluate the SAV modeling because of its early phase of development, the general approach is reasonable. Clear statement of the goals of the modeling (SAV dynamics or habitat for fountain darter) is critical. Too many compromises to achieve both goals with one model can result in a model that accomplishes neither goal adequately. We suggest a phased strategy of first testing each of the components under known and predictable environmental conditions
(e.g., growth under fixed light and temperature), then further testing each component under realistically varying conditions, and then finally calibrating and validating when combined with all of the other processes. Careful attention to formulating a calibration and validation approach that ensures confidence in model predictions for how they will be used in the fountain darter model, and that encompasses the range of conditions to be simulated in the fountain darter model, is needed.
Texas Wild Rice Model
There are no current plans to develop an ecological model for Texas wild rice, which would likely follow on the heels of the SAV ecological model. Rather, efforts are being made in areas of Texas wild rice restoration, such as re-vegetation, transplanting, and increasing the available habitat by controlling invasive species. Additionally, public awareness efforts are focusing on the detrimental aspects of trampling and other habitat destruction. These efforts have proven successful and have increased the total areal coverage of Texas wild rice in the San Marcos River (SWCA, 2014). The habitat suitability analyses can help to guide these efforts by, for example, suggesting what areas are most suitable for replanting. It is recommended that continued efforts focus on Texas wild rice restoration, mitigation, public awareness and improving the existing habitat suitability analyses.
Fountain Darter
The fountain darter modeling effort that is replacing the habitat suitability analyses is truly a population modeling approach. The population modeling approach will address the shortcoming of habitat-based analyses, which can only predict changes in habitat capacity and not fountain darter abundance. However, there is also the possibility that a true population model will not generate predictions with sufficient confidence for it to stand alone as the only quantitative tool to assess flow and habitat effects on fountain darter population dynamics.
The currently envisioned model would simulate individual darters initially in a small area of the Comal River (e.g., 400-500 meters of the Old Channel) on a 2-D grid. The grid would be thousands of horizontal cells, each with an area about 0.25 m2. Velocity and water depths would be obtained from the hydrodynamics modeling and inputted for each cell by converting the predictions from the hydrodynamic modeling grid to grid layout in the fountain darter model. Presently, hourly velocities and water depths for each cell in the individual-based model (IBM) would be obtained for steady-state hydraulic simulations of 1 cfs increments from 30 to about
80 cfs. The user would select a cfs value for the entire simulation or they could string together different fixed flows into a single time series (e.g., ten days at 31 cfs and then ten days at 40 cfs). Each cell in the IBM would also get assigned a vegetation type that would be updated three to four times per year (i.e., abrupt changes). Hourly water temperature, assumed uniform over the spatial grid, would also be inputted.
Individual growth, mortality, and reproduction would be evaluated daily, and the local population would be simulated for 10 or so years. Growth would be determined by the average duration an individual stays in a stage (i.e., age determines development). The underlying assumption is that while individuals may be food-limited (i.e., do not grow at their maximum possible rate), all individuals, regardless of their habitat and timing, grow at the same rate and that rate is what has been observed in the empirical data on stage durations. Mortality rate would depend on stage, and reproduction would generate eggs for the next generation. Movement would be evaluated hourly and individuals would stay in vegetated cells. If the cells became denuded of vegetation, then the fish move to vegetated cells within some neighborhood. There is presently a negative feedback (density-dependence) on recruitment to enable a stable population to be simulated. This is calculated for the entire model grid and the result is that the mortality rate increases as the number of vegetated cells in the system decreases. There are plans to use the new SAV ecological model for vegetation changes over time as input to the IBM. The model is in the planning stages and so some variables, like velocity and vegetation type, are inputted as placeholders for use later to relate to growth, mortality, reproduction, or movement.
The proposed approach uses a spatially explicit, individual-based methodology to simulate the growth, mortality, reproduction, and movement of individuals; the sum over individuals is then the population-level outputs. Individual-based modeling is seeing a rapid rise in use for fish and other taxa (DeAngelis and Mooij, 2005). Following individuals has several advantages over the more traditional state variable or age/stage structured approaches. The shift from Eulerian (change in mass at a location) to Lagrangian (tracking individuals) models enables explicit treatment of local environmental effects, easier simulation of movement, inclusion of all possible effects of variation in size and other traits, and tracking of individuals’ experiences as they move through time and space. The same factors and processes are considered in the more aggregated models but often are implicit. These features are highly desirable in a model of fountain darter to enable realistic simulation of how spatial and temporal variation in habitat affects their population dynamics.
An individual-based approach also has some critical challenges, especially when embedded into management decision-making situations. The
idea of following individuals through time and space is intuitively appealing but the confidence in model predictions relies on the availability of data and information to enable calibration and validation of both individual-level variables (e.g., movement tracks) and population-level variables (e.g., abundance, spatial distributions, density-dependence). The extensive data and information needed for model calibration and validation are rarely available for a species in a specific location. Thus, such analyses are better suited for predicting relative changes in population abundance and distribution under representative conditions, rather than absolute abundances for specific times (years) and locations. This should be kept in mind when making management decisions that require absolute numbers of individuals expected in the system in a given year.
Spatial modeling of population dynamics is increasing because the questions often involve spatial aspects that are difficult to treat implicitly in spatially aggregated models. The HCP is an excellent example where the questions being asked can be addressed more easily with explicit representation of space within the population model. While it is intuitive that spatial problems would benefit from a spatially explicit modeling approach, the use of a spatial grid also involves some additional effort. A spatially explicit model requires the data to be spatial in order to ensure that not only is the total population being simulated realistically, but also that the growth, mortality, and reproduction within different local regions, and movement among spatial areas, are also realistic. Modeling behavioral movement is receiving increasing attention (Watkins and Rose, 2013), but there is presently no generally accepted algorithm for simulating fish responses to changing environmental and habitat conditions.
Two additional aspects of the modeling are the decision to simulate the population over multiple generations and to simulate the fountain darter population rather than the food web. It is important to be able to simulate multiple years of darter population dynamics in a self-regenerating manner (adults give rise to the young who grow up to be adults). A major question to be addressed with this model that cannot be addressed with habitat suitability analysis is the decline and recovery of fish over multiple years given patterns of drought, flood, and other hydrological conditions. This is most effectively simulated with a population model that is self-regenerating. Focus on the population rather than on the food web is a pragmatic decision because, while food web interactions are very important, it can be difficult to quantify the many possible interspecific interactions typical of food webs.
In developing the fountain darter model, modelers should pay particular attention to the following topics:
- How movement is represented
- Clear documentation and justification for how flow, temperature,
-
and vegetation are included in the growth, mortality, reproduction, and movement relationships
- How density-dependence is included
- Using the model to generate predictions of the population responses to various combinations of years with scour events and droughts
- Bookkeeping in spatially explicit IBMs (either true individuals or super-individuals) can be tricky and the numerical precision of model simulations needs to be demonstrated
- Calibration and validation, which are needed to ensure sufficient model credibility
- Careful tracking of uncertainty
- Expectations are high because much discussion has pushed things to the ecological modeling and the term “predictive” has been used. Clarification of what the darter modeling can do and cannot do would be wise.
The model is being developed in Netlogo, with an option to move to a more primitive but faster language like C++. The development of the population model would also be an opportunity to revisit the influence diagrams found in the HCP and, as discussed later, develop more rigorous formal conceptual models for how factors affect darter population dynamics and how management actions directly and indirectly affect their vital rates.
The proposed modeling approach is a scientifically sound way to address the limitations of habitat suitability analyses, and a spatially explicit IBM has many attractive features, along with challenges in terms of model formulation, calibration, and validation. The modeling is in its initial stages with many details not yet available. The details in this type of modeling are very important because there is no standard method for specifying the processes and spatial and temporal scales in the model. One challenge is that population modeling is a scientific process that involves the judgment of the modeler. While this is true of all modeling, it is particularly apparent with population modeling like that being used for the fountain darter. For example, statistical modeling uses data to determine which model is best, and all hydrodynamics models solve the same basic set of fundamental physics equations (i.e., conservation of mass and continuity of momentum). Developer decisions focus more on details, such how to transform the data and outliers for statistical analysis, and how to set up the model grid and how to deal with subgrid scale processes (e.g., turbulence) for hydrodynamics. Fish population modeling does not have sufficient data to use the statistical modeling approach of data determining the best model. Also, population modeling cannot rely on fundamental equations like hydrodynamics modeling can. Thus, decisions about model structure and what to include and exclude in fish models get pushed more towards the judgment of the modeler (i.e., “the art of modeling”). The strong role of the modeler’s
judgment in population modeling does not weaken its power and utility, but it does make model selection and implementation more difficult to document and justify.
The fountain darter modeling would benefit from proceeding in a stepwise, transparent, and modular manner with intermediate products that could eventually be used to build the full-fledged individual based model. This includes the reporting of analyses that support each of the major sub-models of growth, mortality, reproduction, and movement. Such analyses should discuss how the effects of flow, temperature, and structural habitat on each of these major processes will be represented in the model. Such a stepwise approach would also allow for model evaluation and reflection. Second, it would also be worthwhile to evaluate whether the fine-scale spatial resolution currently being considered (0.25 m2) for the model is really needed. Third, careful design of a strategy for calibration and validation is needed that includes both classical predicted-versus-observed comparisons (Stow et al., 2009), pattern-oriented evaluations (Grimm et al., 2005), and uncertainty analysis. The developers may also want to consider isolating the population dynamics in a simplified model version without explicit space, and expanding the population model to include the dynamics of plankton, SAV, and darter (i.e., create a very simplified food web or multi-species model). Many of these suggested steps in the development of the fountain darter model could be viewed as their own products that would expand the modeling toolbox for the fountain darter.
Comal Springs Riffle Beetle
In 2013, the HCP Ecosystem Modeling Team completed a literature review of the CSRB and other riffle beetle species (EA HCP Ecosystem Modeling Team, 2013) with the intention of determining what is known about these species and how it could be used for exploring new modeling approaches for the CSRB and its habitat. This document also provides a short review of several modeling approaches that have been used more generally for aquatic macroinvertebrates. The limitation is not in the availability of modeling approaches but rather that relatively little is known about the basic biology and natural history of the CSRB. Indeed, much of the literature review was for related beetle species that are found in the Comal Springs region; how well these species may represent the CSRB is unknown.
The report authors eliminated from consideration those modeling approaches that require intense data incorporation because they perform poorly outside of the range of conditions represented by such data. Two generalized modeling approaches, the Bayesian Belief Network analysis and Fuzzy Logic modeling, were identified as possibilities because they can be used when there is large uncertainty in the input data and they can also
incorporate best professional judgment. Given the current understanding of the basic biology and ecology of CSRB, the Committee agrees that these modeling approaches are appropriate starting points for providing more robust and quantitative projections of CSRB habitat that could serve to inform long-term population-based modeling efforts. The Committee recommends that the Applied Research Program explicitly seek to provide essential data required by the models and that the HCP include an aquatic entomologist or freshwater invertebrate ecologist to help guide this research.
The HCP acknowledges that habitat requirements for the CSRB, particularly regarding subsurface habitats, are unknown. Also, the HCP states that more extensive work is required to evaluate and assess water quality tolerances of the CSRB. At the present time, the primary measure of habitat quality for the beetle found in the HCP is qualitatively (and possibly only anecdotally) linked to silt deposition. Additional field studies are warranted to assess more quantitatively the negative effects of increased siltation and how these effects interact with changing flow conditions. Further, critical life history information and better surveys for additional CSRB habitat are needed. Answering the following questions would provide information needed for using the proposed modeling approaches from the 2013 literature review.
- What is the basis for the assumption that silt deposition represents an important environmental effector of CSRB population densities?
- How does siltation quantitatively affect the known habitats of CSRB, and are there habitats that may act as refugia during times of heavy deposition?
- Are there quantitative relationships between silt-free gravel and cobble area with beetle population densities?
- How many generations occur throughout the year for the CSRB and how does variable flow and sedimentation affect food availability and the beetle’s population biology?
- Are there invasive predators or competitors in these systems that might apply biotic control on the population numbers?
- What other factors are likely to affect the population biology and ecology of CSRB?
- How reliable is the cotton lure sampling method for quantitatively estimating densities of both adult and immature life stages of the CSRB?
The population measurement goal for CSRB is to maintain greater than or equal to the median densities observed over the past six years of EAA Variable Flow Study. Some of the research ideas above might become the focus of projects under the Applied Research Program, as discussed in Chapter 5.
A CONCEPTUAL MODEL OF THE COMAL AND SAN MARCOS ECOSYSTEMS
This chapter has discussed the current status of and future efforts to model the indicator species in the Edwards Aquifer system, including the fountain darter, Texas wild rice, and the Comal Springs riffle beetle. Regardless of whether the habitat suitability analyses or the ecological models are chosen going forward, there would be substantial benefit to gaining a more holistic understanding of the spring and cave species as members of communities of organisms interacting with each other and with the environment. There is evidence that the EAA would like to move in this direction. For example, already the HCP monitors fountain darters both by darter abundances and darter habitat. Clearly, the habitat measure is an indirect composite assessment that includes factors such as availability of food, mating partners, nursery grounds, predator refuge, etc. However, there appears to be little knowledge of bottlenecks and other limiting factors that ultimately affect darter survivorship during low spring flow rates. That more darters are found in bryophyte beds could reflect food availability or predator avoidance, but other habitats could be more important with respect to mating, egg attachment and recruitment, and survivorship during low flow rates. The snapshots of darter location that show high densities in bryophyte patches and lower densities elsewhere might be artifacts of a dynamic pattern in which darters migrate between habitats differing in quality and availability of prey, mates, spawning, and other habitats. While much important information is known about fountain darters, particularly compared to the other endangered and threatened species, and the EAA and their scientists might be able to answer the above questions knowledgably, it is unclear how that knowledge will ultimately contribute to maintenance and recovery of the endangered species because there is no apparent structural mechanism for prioritizing data needs and knowledge gaps. Similar issues and concerns could be raised for all species, target and non-target.
One approach to prioritizing and focusing EAA’s monitoring and research efforts would be for EAA to develop a series of conceptual models, perhaps with increasing resolution, to highlight the important and potential drivers of population regulation in the covered and indicator species. The current species-centric approach (i.e., individual conceptual models for each species) is important for the population-level analyses, but does not allow for an easily articulated and communicated ecosystem view, both within each system and across the two systems. The EAA should strive for producing a general model in which all covered species, their important driving factors (both abiotic and biotic), and all available management actions are linked within a common framework. It is timely to assess the state-of-knowledge about the Comal and San Marcos ecosystems, given the new
data and information becoming available as a consequence of the HCP and the Applied Research Program. The development of a series of conceptual models would also be an opportunity to get feedback from, and create common understanding among, stakeholders, scientists, and the general public and hence broaden the scientific pool of experts knowledgeable about the systems. This is especially important if the presently held views of how the systems will respond to changes in flow turn out to be incorrect.
Examples of systems where conceptual models have been developed include such large-scale systems as (1) the Sacramento Bay Delta, where conceptual models for fish habitat, riparian vegetation, and other elements of the natural system help guide restoration activities (DiGennaro et al., 2012; NRC, 2012; Baxter et al., 2015; http://www.science.calwater.ca.gov/drerip/drerip_index.html), (2) the Chesapeake Bay, where oxygen and harmful algal bloom dynamics are a major concern (http://ian.umces.edu/ecocheck/); and (3) the St. Johns River in northeastern Florida where water diversions from the river are being evaluated for their impact on macroinvertebrates, SAV, fish and other wildlife (NRC, 2012). More generalized conceptual models have been used in the study of alternate stable states in shallow lakes (Scheffer et al., 1993b; Drenner and Hambright, 2002), trophic dynamics within ecosystems (Carpenter et al., 1985; Oksanen, 1991), the organization and structure of communities along a riverine gradient (Vannote et al., 1980), and metabolic and physiological scaling within ecosystems (Brown et al., 2004).
It should be a top priority for the EAA to develop a conceptual model, or a series of models of increasing resolution, that show how water quality and quantity, other biota, and restoration and mitigation activities are expected to interact with the indicator species, as well as with all covered species. Within the conceptual model, boxes could be used to represent targets of the monitoring program, while arrows linking the boxes could represent quantitative or empirically derived relationships between the boxes based on research. Such interactions for which too little data are available to establish empirical relationships could be targeted for modeling and further research during the permit period. Conceptual models could be based loosely on the influence diagrams in Hardy (2009). In addition to considering each species individually and being based on different forcing factors, composite ecosystem-level diagrams for each spring that include known and hypothesized interactions of both biotic and abiotic driving and response factors could help provide a means of focusing and prioritizing EAA funding, monitoring, and research. For example, not only would it be informative to combine Figures 4 to 7 (Hardy, 2009), it would be very informative to see how flow quantity and quality were linked to all three indicator species (and the food web in general) within the same conceptual model. In other words, where are there expected to be common, comple-
mentary, synergistic, and contradictory effects of environmental forcing factors across the species of concern and how might species interactions vary with these forcing factors?
The overall HCP is based on the assumption that a minimum spring flow (of acceptable quality) will be good for all species concerned. In other words, if there is spring habitat, spring species will survive, which is a logical assumption. The conceptual model could provide an overall view of how flow relates to population sizes. On the other hand, minimization and mitigation measures may not carry equal or similar benefits to all species, or at least this seems less likely. Manipulations of habitat (restoration of native vegetation, reduction of siltation) and nutrients (isolation of the golf course and other forms of runoff) could affect food availabilities for grazers, which could in turn affect grazer populations, and these effects could reverberate up through the food web.
Another assumption of the HCP is that protection of the three indicator species will be sufficient to protect all covered species, as well as all species that have not been included as covered species in the HCP. The conceptual model should demonstrate the basis for this assumption, highlighting where knowledge exists to support the assumption, but also where information may be needed.
The external review (EARIP, 2012, Appendix I) of Hardy (2009) points out that ultimately ecosystem function may depend on factors (e.g., nonnative fishes) not included in the habitat suitability analysis, especially over a longer term, as several years to decades may be required for their roles to become evident. They stated that “for the target organisms and the habitats within which they live to achieve recovery and persist over the long term, additional information is needed to understand, anticipate, and manage these factors as much as possible.” An added benefit of the conceptual models would be to highlight these other important factors, determine whether and how they can be incorporated into the ongoing ecological models for SAV and the fountain darter, and allow the EAA to prioritize the research and monitoring required to support model development.
The assembled suite of conceptual models, from population dynamics of key species to ecosystem dynamics of each spring, would provide a foundation for the ongoing data collection and modeling activities and also for communicating data analyses, modeling output, and decisions to collaborators and stakeholders. The development of effective conceptual models is not trivial and should include broad participation from researchers and stakeholders to ensure support. It would also be advisable for the EAA to devise a mechanism for periodic review and refinement of all conceptual models and their various components as monitoring and research provide new insights.
CONCLUSIONS AND RECOMMENDATIONS
The approach to ecological modeling taken in the HCP of combining field data, habitat suitability analysis, and modeling of population dynamics is appropriate and can support the management decisions that will need to be made as the HCP proceeds. There are, however, several aspects of the analyses to date that should be adjusted to ensure that robust conclusions are obtained. Recommendations about the field data are found in Chapter 4 and the Committee’s evaluation of the Applied Research projects is the subject of Chapter 5. The conclusions and recommendations below focus on the habitat suitability analyses and the planned ecological modeling.
The goal of the SAV modeling, which is in its early stages, should be clarified. Whether the goal is to simulate SAV biomass dynamics or to simulate habitat for the fountain darter model will affect how many models are needed and how each model is formulated and tested. Similarly, key issues about spatial resolution and whether to model specific species or a generic SAV species depend on the goals of the modeling. Once the goal is determined, a strategy for model design, calibration, and validation should be developed.
Given the absence of a planned ecological model for Texas wild rice, the current habitat suitability analysis should be treated as an hypothesis and tested for robustness throughout the San Marcos River. The EAA should consider designing minimization and mitigation measures for Texas wild rice in a manner to provide experimental analysis of the habitat suitability results. For example, the minimization and mitigation activities could be used to test the validity of using water depth and velocity as the only predictive variables for optimal habitat for Texas wild rice. Similarly, one could use replicated reference and control areas to provide explicit tests of the efficacy of replanting and to quantify the roles of discharge, competition, and other factors that may limit Texas wild rice growth and survival.
The ongoing effort to build an individual-based model for fountain darter is a scientifically sound approach for modeling population dynamics that will require extensive data for model formulation, calibration, and validation. Ensuring that the model results are properly interpreted (i.e., viewed with appropriate confidence) will be critical to the success of these efforts. Fortunately, the model is being developed with a healthy mix of modelers and field ecologists who know the system, there are well-defined questions that are answerable by the modeling, and there is an opportunity to influence data collection to get specific information needed for the modeling. Some of the interactions between key players that should be expanded and
strengthened include (1) hosting workshops at key times (to define the questions, formulate the model, and present preliminary results), (2) making clearer links between the monitoring data and the Applied Research projects and how both will be used to inform the modeling, and (3) engaging modelers with experience in developing similar individual-based models.
The habitat suitability analyses done for the fountain darter could act as a “back-up” to the individual-based modeling and provide additional quasi-independent results to support a weight of evidence approach for the fountain darter. Habitat suitability analyses are tied closely to data, they are easy to explain, and the reporting of the amount of high quality habitat has intuitive appeal. Although the habitat suitability approach does not convey fish abundance like the population modeling, the latter requires more data, greater mechanistic understanding, and is more challenging to explain. Thus, pursuing both approaches has merit, as has been borne out in the Everglades restoration efforts, which started with habitat suitability analyses, went to population and community modeling, and then either maintained or re-started the habitat suitability analyses. The habitat-based analysis for fountain darter reported in the HCP (not the two Hardy analyses) should not be used without significant revision.
If the CSRB is to be an adequate indicator of some of the other ESA-listed species, it is critical to have a much deeper understanding of the spatial distribution, range of potential habitats, and natural history of the CSRB. This natural history includes understanding the number of generations per year, cohort synchrony or asynchrony, the times of year for reproduction, and the biotic and abiotic variables that influence these dynamics. Furthermore, a better understanding of the optimal CSRB habitat is needed to understand how changing flow conditions will impact CSRB. Details about how to explore the degree to which CSRB is a reliable indicator of other species are provided in Chapter 4.
It is recommended that as a top priority the EAA develop an ecosystem-based conceptual model, or a series of models of increasing resolution, that show how water quality and quantity, other biota, and restoration and mitigation activities are expected to interact with the indicator species, as well as with all covered species. Boxes in the conceptual model would represent targets of the monitoring program, while arrows linking the boxes would represent quantitative or empirically derived relationships between the boxes based on research. Such interactions for which too little data are available to establish empirical relationships could be targeted for monitoring and further research during the permit period.
Ailstock, S., and D. Shafer, D. 2004. Restoration potential of Ruppia maritima and Potomogeton perfoliatus by seed in the mid-Chesapeake Bay. Report ERDC/TN SAV-04-02. US Army Corps of Engineers, WES, Vicksburg, MS.
Bartsch, N. R., T. B. Hardy, J. A. Shoemaker, and P. J. Connor. 2000. Development and Application of an Instream Flow Assessment Framework for the Fountain Darter (Etheostoma fonticola) and Texas Wild Rice (Zizania texana) in Spring Lake and the San Marcos River System.
Baxter, R., L. R. Brown, G. Castillo, L. Conrad, S. Culberson, M. Dekar, F. Feyrer, K. Gehrts, L. Grimaldo, T. Hunt, J. Kirsch, A. Mueller-Solger, M. Nobriga, S. Slater, T. Sommer, and K. Souza. 2015. An Updated Conceptual Model for Delta Smelt: Our Evolving Understanding of an Estuarine Fish. Interagency Ecological Program Technical Report 90. California Department of Water Resources, Sacramento, CA.
Best, E. P., and W. A. Boyd. 2007a. Expanded Simulation Models “Version 3.0” for Growth of the Submerged Aquatic Plants American Wildcelery, Sago Pondweed, Hydrilla, and Eurasian Watermilfoil (No. ERDC-TN-SWWRP-07-10). Engineer Research and Development Center, Vicksburg, MS.
Best, E. P., and W. A. Boyd. 2007b. Carbon-Flow-Based Modeling of Ecophysiological Processes and Biomass Dynamics of Submersed Aquatic Plants (No. ERDC/EL-TR-07-14). Engineer Research and Development Center, Vicksburg, MS.
Best, E. P. H., C. P. Buzzelli, S. M. Bartell, R. L. Wetzel, W. A. Boyd, R. D. Doyle, and K. R. Campbell. 2001. Modeling submersed macrophyte growth in relation to underwater light climate: modeling approaches and application potential. Hydrobiologia 444:43-70.
BIO-WEST, Inc. 2007. Variable Flow Study: Seven Years of Monitoring and Applied Research. Prepared for Edwards Aquifer Authority, August 2007, 70 pp.
Brown, J. H., J. F. Gillooly, A. P. Allen, V. M. Savage, and G. B. West. 2004. Toward a metabolic theory of ecology. Ecology 85:1771-1789.
Carpenter, S. R., J. F. Kitchall, and J. R. Hodgson. 185. Cascading trophic interactions and lake productivity. BioScience 35:634-639.
Cerco, C. F., and K. Moore. 2001. System-wide submerged aquatic vegetation model for Chesapeake Bay. Estuaries 24:522-534.
DeAngelis, D. L., and W. M. Mooij. 2005. Individual-based modeling of ecological and evolutionary processes. Annual Review of Ecology, Evolution, and Systematics 147-168.
DiGennaro, B., D. Reed, C. Swanson, L. Hastings, Z. Hymanson, M. Healey, S. Siegel, S. Cantrell, and B. Herbold. 2012. Using conceptual models and decision-support tools to guide ecosystem restoration planning and adaptive management: an example from the Sacramento–San Joaquin Delta, California. San Francisco Estuary and Watershed Science 10(3).
Drenner, R. W., and K. D. Hambright. 2002. Piscivores, trophic cascades and lake management. The Scientific World JOURNAL 2:284-307.
EA HCP Ecosystem Modeling Team. 2013. Literature Review: Invertebrate Modeling Framework and Modeling Approaches for the Comal Riffle Beetle. Prepared by the EA HCP Ecosystem Modeling Team, October 2013.
EARIP. 2012. Habitat Conservation Plan. Edwards Aquifer Recovery Implementation Program.
Feyrer, F., K. Newman, M. Nobriga, and T. Sommer. 2011. Modeling the effects of future outflow on the abiotic habitat of an imperiled estuarine fish. Estuaries and Coasts 34:120–128.
Grimm, V., E. Revilla, U. Berger, F. Jeltsch, W. M. Mooij, S. F. Railsback, H. H. Thulke, J. Weiner, T. Wiegand, and D. L. DeAngelis. 2005. Pattern-oriented modeling of agent-based complex systems: lessons from ecology. Science 310:987-991.
Hardy, T. B. 2009. Technical Assessments in Support of the Edwards Aquifer Science Committee “J Charge” Flow Regime Evaluation for the Comal and San Marcos River Systems. River Systems Institute, Texas State University.
Hardy, T. B., K. Kollaus, and K. Tower. 2010. Evaluation of the Proposed Edwards Aquifer Recovery Implementation Program Drought of Record Minimum Flow Regimes in the Comal and San Marcos River Systems. River Systems Institute, Texas State University.
Johnson, A. F., S. R. Jenkins, J. G. Hiddink, and H. Hinz. 2013. Linking temperature demersal fish species to habitat: scales, patterns and future directions. Fish and Fisheries 14:256-280.
Kautsky, L. 1988. Life strategies of aquatic soft bottom macrophytes. Oikos 53:126-135.
Knudby, A., A. Brenning, and E. LeDrew. 2010. New approaches to modelling fish-habitat relationships. Ecological Modelling 221:503-511.
Madden, C. J., and W. M. Kemp. 1996. Ecosystem model of an estuarine submersed plant community: calibration and simulation of eutrophication responses. Estuaries 19:457-474.
Murray, L., W. M. Kemp, D. Hinkle, and D. Shafer. 2009. Production and Field Planting of Vegetative Propagules for Restoration of Redhead Grass and Sago Pondweed in Chesapeake Bay. U.S. Army Corps of Engineers. Tech Notes.
NRC. 2012. Sustainable Water and Environmental Management in the California Bay-Delta. Washington, DC: National Academies Press.
Oksanen, L. 1991. Trophic levels and trophic dynamics: a consensus emerging? Trends in Ecology and Evolution 6:58-60.
Rybicki, N. B., D. G. McFarland, H. A. Ruhl, J. T. Reel, and J. W. Barko. 2001. Investigations of the availability and survival of submersed aquatic vegetation propagules in the tidal Potomac River. Estuaries 24:407-424.
Scheffer, M., A. H. Bakema, and F. G. Wortelboer. 1993a. Megaplant—a Simulation-Model of the Dynamics of Submerged Plants. Aquatic Botany 45:341-356.
Scheffer, M., S. H. Hosper, M.-L. Meijer, B. Moss, and E. Jeppesen. 1993b. Alternative equilibria in shallow lakes. Trends in Ecology and Evolution 8:275-279.
Stow, C. A., J. Jolliff, D. J. McGillicuddy, S. C. Doney, J. Allen, M. A. Friedrichs, K. A. Rose, and P. Wallhead. 2009. Skill assessment for coupled biological/physical models of marine systems. Journal of Marine Systems 76:4-15.
SWCA. 2014. Edwards Aquifer Habitat Conservation Plan USFWS Permit No. TE63663A-0. 2013 Annual Report.
USFWS. 1996. San Marcos and Comal Springs and associated aquatic ecosystems (revised) recovery plan. Department of Interior, Fish and Wildlife Service.
van Nes, E. H., M. Scheffer, M. S. van den Berg, and H. Coops. 2003. Charisma: a spatial explicit simulation model of submerged macrophytes. Ecological Modelling 159:103-116.
Vannote, R. L., G. W. Minshall, K. W. Cummins, J. R. Sedell, and C. E. Cushing. 1980. The river continuum concept. Canadian Journal of Fisheries and Aquatic Sciences 37:130-137.
Wang, H. H., W. E. Grant, T. M. Swannack, J. Gan, W. E. Rogers, T. E. Koralewski, J. H. Miller, and J. W. Taylor. 2011. Predicted range expansion of Chinese tallow tree (Triadica sebifera) in forestlands of the southern United States. Diversity and Distributions 17:552-565.
Watkins, K. S., and K. A. Rose. 2013. Evaluating the performance of individual-based animal movement models in novel environments. Ecological Modelling 250:214-234.
Zorn, T. G., P. W. Seelbach, and E. S. Rutherford. 2012. A regional-scale habitat suitability model to assess the effects of flow reduction on fish assemblages in Michigan streams. Journal of the American Water Resources Association 48(5):871-895.


