
Highlights from the Speaker’s Presentation*
- Measuring the changes produced by an initiative requires a logic model that connects inputs to short-term, intermediate, and long-term outcomes. Long-term changes in health outcomes can be difficult to create and measure; therefore, more immediate outcomes must be assessed and linked to population health improvements.
- One approach to evaluation is through “dose,” which combines reach, or the number of lives affected by an intervention, and the strength of that effect.
- The effects of an intervention (single interventions and/or a collection of interventions targeting the same outcome) can be estimated through a combination of effect sizes derived from the scientific literature, evaluations of individual strategies, and dose estimates based on reach and strength.
- Estimated effects of interventions compared with surveys of the target population then can reveal associations between estimated and observed impacts.
______________
*Highlights identified during the presentation and discussion attributed to Pamela Schwartz of Kaiser Permanente.
____________________
1The term “measurement” in this chapter includes consideration of assessment, surveillance, monitoring, and summative evaluation efforts as described in the Institute of Medicine report Evaluating Obesity Prevention Efforts: A Plan for Measuring Progress (IOM, 2013b).
Kaiser Permanente’s Community Health Initiative (CHI) is an obesity prevention initiative aimed at creating opportunities for safe physical activity and healthy eating in communities across the nation. There are more than 50 CHI sites, including Healthy Eating, Active Living zones in California (see Chapter 4), LiveWell in Colorado, and joint efforts across the nation, and the initiative is continuing to grow.
Throughout its first decade, CHI has had a rigorous evaluation process in place, noted Pamela Schwartz, director of program evaluation at Kaiser Permanente. “We have taken that evaluation very seriously, taking an honest look at what has worked and what hasn’t worked and making course corrections along the way—trying to be brutally honest with ourselves and using the evaluation to improve our investments.” Schwartz provided several key lessons learned from the evaluation, with a particular emphasis on the challenges posed by measurement.
Discussion of measurement requires a logic model, said Schwartz. The cross-site logic model for CHI begins with inputs that are converted through various processes into short-term, intermediate, and long-term outcomes (see Figure 5-1). “We’re interested in understanding the community changes and how those changes are impacting behavior and eventually health.”
About 5 years into the program, the evaluators realized that the initiative was unlikely to reach its goal of population health improvement if it did not make two key course corrections. First, they concluded that the interventions needed to be more impactful. Second, they realized that the initiative needed to focus more on intermediate outcomes. Long-term changes in health outcomes can be difficult to create and measure; therefore, more immediate outcomes must be assessed and linked to population health improvements.
These two conclusions led to several adjustments in CHI. First, the initiative began to emphasize what Schwartz and her colleagues call “dose,” which is the product of how many lives an intervention is affecting (i.e., reach) and how strong that effect is (i.e., strength). The concept of dose resonated with funders, practitioners, researchers, and community partners, said Schwartz, but it has not been easy to operationalize. Doing so requires working with the community to create dose and devising ways of measuring the effects of a single intervention and a collection of interventions targeting the same outcomes. With healthy eating, for example, calculations of dose might involve the percentage of healthy options in vending machines, the kinds of food offered in cafeterias and other school-related outlets, the establishment of community gardens, and reforms in corner stores
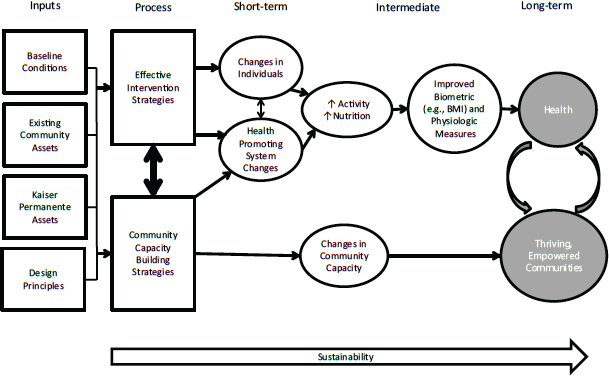
FIGURE 5-1 The logic model for the Community Health Initiative connects inputs to short-term, intermediate, and long-term outcomes.
NOTE: BMI = body mass index.
SOURCE: Kaiser Permanente, 2014. Reprinted with permission from Pamela Schwartz.
and other sectors. With physical activity, dose could involve the number of students who walk to school, changes in the community to encourage walking, revamping of the physical education curriculum, and increased physical activity in the classroom. “This is about starting where the community is and continually asking the question, ‘Can we reach more people, more times, more often, for a longer period, throughout the year, and [do] it in any sector?’” Schwartz said.
Another adjustment involved improved measurements. The evaluators sought new ways of quantifying the impact of individual strategies. They also worked with communities to understand more about the opportunities for better measurement, partly because communities were asking for improved metrics for what they were doing.
A ROADMAP TO APPROACHING EVALUATION
The above adjustments led to several important results. The evaluation of a Safe Routes to School program among 13 schools in a community, all implementing some combination of efforts such as safety enhancements, infrastructure changes, and walk-to-school days increased the number of children walking to school from 24 percent to 36 percent over the course of 2 years. In another program, installing a salad bar in an elementary school cafeteria in Colorado increased students’ consumption of fruits and vegetables by 13 percent. These and other similar results, provided a sense that “dose mattered,” said Schwartz.
Because CHI is a multisectoral initiative, however, it was necessary to find ways of quantifying the collective impact of multiple strategies being implemented at the same time. To meet this challenge, the evaluators used dose as a common metric across interventions. For example, one community in Colorado focused on a strong physical activity intervention in the school setting. The community worked to revise the physical education curriculum, increase walking to school and physical activity in the classroom, and promote physical activity through wellness policies and after-school programs. The evaluators took three approaches to measuring the effect sizes of each strategy:
- They surveyed the scientific literature to identify evidence of effect sizes.
- Where evidence did not exist, they performed evaluations of individual programs such as those described above.
- Where both the literature and evaluations were lacking, they estimated the dose of each individual strategy based on the combination of reach and strength.
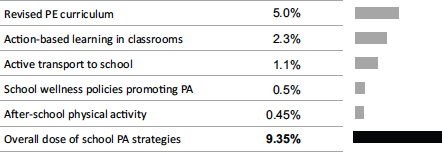
FIGURE 5-2 Calculations of dose for multiple physical activity–focused interventions yielded a large overall estimated effect size for a Colorado community.
NOTE: PA = physical activity; PE = physical education.
SOURCE: Schwartz, 2014. Reprinted with permission.
Using these three approaches, “we were able to add up the apples and oranges,” Schwartz said. The cumulative estimated effect was 9 percent, which Schwartz described as “very high” (see Figure 5-2). This effect would justify a prediction that the community would see improved population health.
The evaluators then compared the predicted estimated effect with changes in population health derived from pre- and post-intervention surveys of students at the school. The surveys found a 4 percent increase in students reporting more minutes of physical activity, which is also high. To understand secular changes, the evaluators compared their findings with data from the Youth Risk Behavior Surveillance Survey, which showed just a 0.5 percent increase in a widely used measure of physical activity among Colorado youth during the same time period (see Figure 5-3).
The association between estimated and measured impacts provided confidence that the changes seen in population health could be attributed to the interventions. “This supported our hypothesis that if you have a strong intervention, you can move population health,” said Schwartz. “It reinvigorated our belief that we need to create dose and we need to measure it.”
This approach still leaves some questions unanswered, Schwartz acknowledged in response to a question, such as whether interventions are additive or synergistic. But the associations found indicate that change is heading in the right direction.
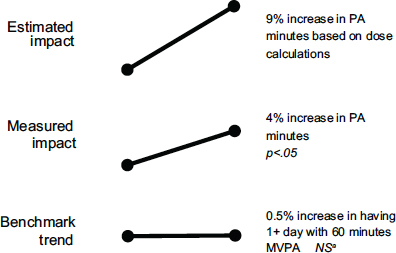
FIGURE 5-3 Example comparing estimated dose with actual population health impact.
NOTE: MVPA = moderate- to vigorous-intensity physical activity; NS = not statistically significant; PA = physical activity.
aYouth Risk Behavior Surveillance Survey data, Colorado, 2009–2011.
SOURCE: Schwartz, 2014. Reprinted with permission.
CONSIDERATIONS IN COMPARING DOSE WITH POPULATION-LEVEL CHANGES
To compare the dose of interventions with changes in population-level behavior and health, Schwartz emphasized, measures of population health are important. These measures can take a long time to create and collect, “and sometimes you can’t measure it, even when you have a strong intervention, due to power or other problems with the data,” Schwartz observed. “But even small changes are very meaningful. If you can detect small changes, it’s over a population, so it’s a big deal.”
Other forms of evaluation also can be valuable. For example, one strategy Schwartz and her colleagues have used is PhotoVoice, which entails giving people cameras and having them take pictures related to barriers to health in their community, and then write captions to describe those barriers and how they can be overcome. “We have seen huge results there,” she said, “and meaningful changes created and documented by residents . . . advocating their needs through their voice and a photo.”
Evaluations also need to provide immediate feedback for program improvement, Schwartz said. Communities and programs need to know that they are on track. When a program can be improved, the evaluation should provide information that can lead to revised strategies that enhance impact.
The concept of dose is exciting, Schwartz concluded, but it also is a new concept that needs to be further developed and tested. To date, it appears to be a valid and useful measure, “but we’re early on in our learning,” she said. In addition, while behavior change at the population level can be measured more easily in schools, its measurement is more difficult in the community at large. Still, the concept of dose can help identify promising interventions and give priority to those that work.
“Everyone is willing to contribute a piece to the solution. Everyone has a part to play, and we need to think creatively of how we can synergize those parts to work together for the greater good.”
—Amelie G. Ramirez of Salud America!


