
Appendix C
The Role of Research, Learning, and Technology Deployment in Clean Energy Innovation
“To avoid the most harmful effects of rising greenhouse gas concentrations while still meeting the growing demand for affordable and reliable energy services, nothing less than a fundamental transformation of current patterns of energy production, delivery, and use on a global scale will be required” (Lester and Hart, 2012, p. 2).
“The chances are slim that technology can do the job without government policies mainly because the required changes are so large.…Achieving the emissions reductions contemplated by U.S. policy and consistent with the Copenhagen 2° C temperature target would require more rapid technological shifts than have been seen in almost any industry.” (Nordhaus, 2013, p. 276)
“Accelerating innovation so as to decarbonize one of the least innovative sectors of the entire economy is a major policy challenge” (Grubb et al., 2008, p. 333).
SCALE OF THE CHALLENGE AND NEED FOR CORRESPONDINGLY SCALED INNOVATION EFFORT
The scale of the challenge to develop and deploy clean energy technology underscores the importance of investment in research and development (R&D) to discover and develop transformative innovations. Deployment of viable existing technologies is important, but will be far from enough to meet the
global challenge, particularly in controlling the concentrations of greenhouse gases in the atmosphere.
A portfolio of public policies will be needed to support innovation at all stages of the process. An aspect of the necessary portfolio is the balance of effort among several types of initiatives to support innovation. These initiatives include everything from basic research on risky but potentially transformative technologies to support for deployment of clean technologies that may not yet be commercially viable. The purpose here is to address basic elements of the policy balance between R&D and large-scale uptake and deployment of more expensive technologies, and the interactions with pricing of carbon and other pollutant emissions.
MARKET FAILURES AND EXTERNALITIES
A primary argument for public policy in clean energy innovation is to overcome market failures and to internalize the costs of major externalities (Popp et al., 2010). There are many externalities in energy production and use. The most significant are the emissions of criteria pollutants, especially for small particulates, and the emissions of carbon dioxide and other greenhouse gases (Muller et al., 2011). The treatment of emission externalities interacts with the recognition of other market failures (NRC, 2010b). An example of an overview of market failures and the associated policy instruments appears in Table C-1 (Gillingham and Sweeney, 2010).
Although not exhaustive, this overview illustrates the interaction of policies and problems. On some dimensions, such as regulation or the treatment of market power, the policies may be considered relatively independently. On other dimensions, there is a strong interaction. For instance, the policy for internalizing the cost of carbon emissions has a major impact on the scope and design of policies for supporting technology innovation and deployment of clean energy technologies that address the problem of global warming.
A particular focus is on the benefits of early deployment. It is clear that investment in R&D, to include everything from discovering new technologies to deployment of first-of-a-kind plants, presents a requirement for public support to overcome the traditional market failures associated with spillover effects (Nadiri, 1993). What is not as clear, however, is how much public policy should go beyond this traditional realm of R&D to support large-scale deployment of clean energy technologies that would not be adopted absent public support. There is a widely accepted view that deployment produces the benefits of learning and subsequent cost reduction for new technologies, and this learning benefit can be difficult for investors to capture in the market (Popp et al., 2010, p. 895). In principle, the learning spillover is a type of externality that justifies a policy to support deployment. The issue is how much, and how the learning benefit interacts with other policies.
TABLE C-1 Sources of Market Failure and Some Illustrative Potential Policy Instruments
 |
Direct regulation | Direct government-sponsored R&D | Competions, such as X prize | R&D Tax Incentive | Excise taxes | Production Subsidies | Feed-in tariffs | Information programs | Product standards | Cap-and-trade | Marketable Market-Wide Standers | Transparency Rules | Macroeconomic Policy | Corporate Taxation Reform | Competition Policy/Laws | Restructured Regulation | Intellectual Property Law |
|---|---|---|---|---|---|---|---|---|---|---|---|---|---|---|---|---|---|
| Labor supply/demand imbalances | T | T | |||||||||||||||
| Environmental externalities | p | p | p | p | p | p | p | p | p | p | p | p | |||||
| National security externalities | p | p | p | p | p | p | p | p | p | p | p | p | |||||
| Information market failures | p | p | p | ||||||||||||||
| Regulatory failures | p | ||||||||||||||||
| Too High Discount Rates | p | P | p | ||||||||||||||
| Imperfect foresight | p | ||||||||||||||||
| Economies of scale | T | T | p | ||||||||||||||
| Market power | p | p | p | ||||||||||||||
| R&D Spillovers | p | p | p | p | p | ||||||||||||
| Learning-by- Doing | T | T | |||||||||||||||
| Network Externalities | T | p |
NOTE: “P” indicates permanent change or instrument; “T” indicates transient instrument.
SOURCE: Gillingham and Sweeney, 2010, p. 81.
LEARNING AND INNOVATION
The extensive literature on learning incorporates a variety of pathways for innovation. These pathways touch the innovation stages in different ways and have different policy implications. Figure C-1 shows the stages of the innovation process and key obstacles to accelerating innovation at each stage that are important policy targets.
For example, at the earliest stages of fundamental research and proof of concept, there is a consensus that research has both very large spillover externalities and very large social returns (Popp et al., 2010, pp. 896-898). The policy implication calls for a variety of ways to provide public support for
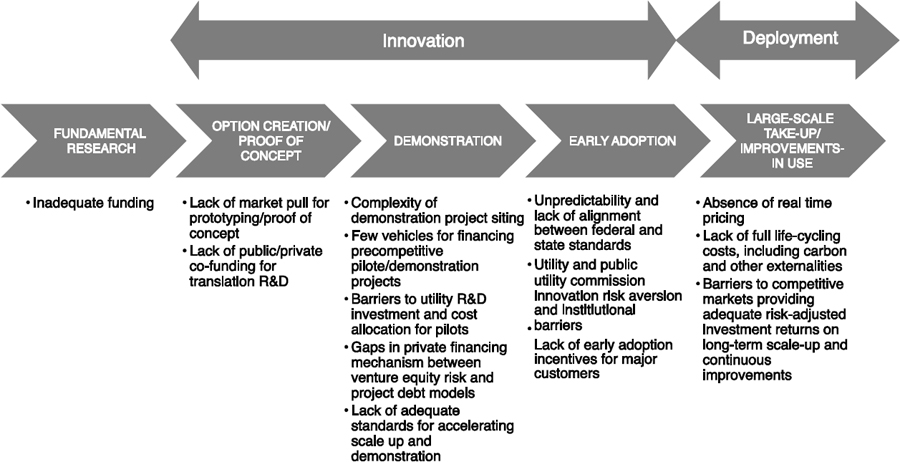
SOURCE: Adapted from Lester and Hart, 2012, Figure 2.1, p.33.
fundamental research and proof of concept. In the energy context, government support of basic research and programs such as the Advanced Research Projects Agency-Energy (ARPA-E), pursuing risky innovations with potentially high payoffs and large spillovers, fits naturally at this early stage of R&D.
The more expensive “muddle in the middle” for demonstration and first-of-a-kind commercial projects presents a bigger challenge. The costs and risks of the individual efforts at this stage are much larger, and the inevitable failures can be more visible and controversial. Furthermore, the incentives for early adoption are in part connected to the incentives for large-scale take-up/improvements in use. Absent a sufficient ultimate market, even a market with very risky payoffs, the normal model for venture capital to take projects beyond proof of concept and demonstration would not apply. The venture capital firm is a for-profit activity, and without a high potential market, there is not enough profit to match the risk in innovation. Thus there is another area in which there may be high social returns where the spillovers and risks call for government support in the middle stages to include the first few plants of a new and unproven technology that have a low probability of success. For these stages before large-scale deployment, innovation is the product, and clean energy is the by-product.
A related but different question addresses the degree to which there should be public policy support, and the form of policy most likely to produce results, at the later stage of large-scale market penetration, where clean energy is the principal product, and innovation through cost reduction is a by-product. How large and of what types are the aggregate social returns for diffusion of innovative clean energy technologies? How much of this benefit can be captured by market participants, and how much spills over and leaves a market failure amenable to government policy intervention?
Abstracting from many of the details of the innovation process, the focus here is on models used to quantify the benefits of research and learning and the interaction with large-scale uptake of clean technology. The literature includes a variety of frameworks for addressing these questions. The terminology is not fully settled, but the basic ideas have been widely discussed (Junginger et al., 2010). For present purposes, the arguments for learning and the connection with large deployment make distinctions about different types of cost reductions or possible spillover effects:
- Learning by (re)searching (LBS): This is R&D broadly writ. The most important features include an intentional and costly effort to develop innovations. Typically, the R&D is risky, and there are large spillover effects. The goal is to develop the innovation until it is at or near the stage of large-scale deployment.
- Economies of scale: This represents the standard argument about decreasing unit production costs as a production plant reaches an efficient size. In the energy market, this is unlikely to be a market-
-
wide phenomenon—i.e., the case of natural monopoly—but may be relevant at the firm level (Gillingham and Sweeney, 2010).
- Learning by doing (LBD): Early production produces new information that reduces the cost of future production. Critical characteristics include that LBD is passive (Thompson, 2010) in the sense that it is treated as a free by-product of deployment rather than an explicit costly product of the deployment. There can be significant spillover effects.
- Learning by using (LBU): This is the demand-side counterpart of LBD, often not treated separately from LBD.
- Learning by waiting (LBW): The spillover effects from other industries, technologies, or countries are essentially exogenous—i.e., developed from outside—from the perspective of the firm in the present industry (Thompson, 2010). The resulting benefits from the innovative technology will appear over time and can be exploited by waiting.
This list is not exhaustive, but it covers enough of the aggregate pathways to characterize some of the key features of policy trade-offs. The focus is on the long-term character of the learning process. For example, there is no doubt that there can be a great deal of learning during the early shakeout period of any new production facility. There is evidence, for instance, of significant learning in the early stages of production of new cars, but the learning quickly reaches a sustainable cost level (Levitt et al., 2013; Thompson, 2010).
Similarly, economies of scale are not likely to produce the type of externality that justifies a policy intervention:
The distinction between learning-by-doing and economies of scale may seem minor, but the implications for public policy are immense. If one firm can drive down its costs by producing at large scale in its factory or its installation operation, those benefits are highly appropriable by that large firm. Smaller firms are not likely to experience a cost decline because a competitor is enjoying economies of scale. Thus, significant economies of scale in any industry, short of creating a natural monopoly, are not generally seen as a basis for government intervention. (Borenstein, 2012, p. 83)
While an important benefit, the economies of scale apply only for very early deployment, and there may be little or no spillover effect that creates a market externality or a justification for public policy.
Hence, the relevant question is the degree of learning after the initial R&D stages, where the major benefits of initial shakeout of the first-of-a-kind plants have already been achieved, and production economies of scale are already
being exploited. The immediate task is to integrate the roles of the other forms of learning and consider the implications for public policy.
LEARNING BY WAITING AND DOING
A key feature of LBD is the requirement of large-scale penetration of the market. LBS may occur with or without accompanying large-scale deployment. There may be important feedback effects between deployment and active research initiatives. For the present discussion, however, the focus is on the independent effects of LBD (and LBU). From this perspective, the impacts of LBS and LBW share the common feature that they do not depend on large-scale deployment of the innovative technology.
The importance of LBD has long been recognized (Arrow, 1962). “The empirical literature on firm progress curves is distressingly large…” (Thompson, 2010, p. 446). A standard model incorporates an experience curve that relates cumulative production to the cost of new production. As new production occurs, there is a knowledge by-product that reduces the cost of future capacity. The lower cost of the future production is the premium associated with LBD. If there is a great deal of learning, then the premium may justify early large-scale deployment.
A Learning Curve Model
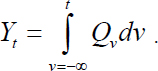
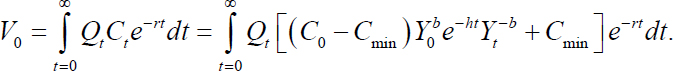
In Nordhaus (2014), a representative version of an experience or learning curve model for a given technology, for a firm or an industry, illustrates the central components and key parameters. New production of clean energy in period t is Qt. The associated cost of production is simplified to a constant marginal cost Ct. Cumulative production is Yt, where
Nordhaus includes the effect of all learning that does not require deployment as represented in an exogenous trend where costs decrease at rate h. This exogenous trend provides benefits by waiting until costs come down before undertaking large-scale deployment.
The learning effect appears as the elasticity b that captures the percentage reduction in costs associated with an increase in experience, measured as cumulative production. Nordhaus effectively normalizes units so that Y0 = 1; here it is convenient to retain Y0 as a scaling factor. Hence, the stylized model of LBD represents the marginal cost of new production as
![]()
This is the experience or learning curve model, which has a long history. Without the effect of the exogenous rate h, this would be the original single-factor experience curve (Thompson, 2010). Including a possible nonzero exogenous rate makes this the simplest two-factor experience or learning model.
The model is linear in logarithms of cost, a time trend for exogenous change, and cumulative experience that drives LBD.
ln Ct = ln C0 + bln Y0 − ht − bln Yt.
The description of learning can be summarized by the progress ratio (PR), which is the ratio of costs after a doubling of cumulative production.
PR = 2−b.
The related learning rate (LR) is one minus the PR.
LR = 1− PR = 1− 2−b.
Hence, with an LR of 20 percent, a doubling of cumulative production results in a 20 percent reduction in future production cost, or a PR of 80 percent. Table C-2 summarizes the connection between learning rates and the associated cumulative output elasticity b.
TABLE C-2 Learning Curve Rates
| LR (%) | PR (%) | b |
|---|---|---|
| 5 | 95 | 0.07 |
| 10 | 90 | 0.15 |
| 15 | 85 | 0.23 |
| 20 | 80 | 0.32 |
| 25 | 75 | 0.42 |
| 30 | 70 | 0.51 |
| 35 | 65 | 0.62 |
| 40 | 60 | 0.74 |
| 45 | 55 | 0.86 |
| 50 | 50 | 1.00 |
SOURCE: Nordhaus, 2014.
Single-factor models across a range of industries yield LRs dispersed around 20 percent (Thompson, 2010). However, the dispersion of LRs across industries is wide, and within industries and technologies, the LR can vary over time and be quite different for technologies of different types and stages of development. Early adoption may even show increasing costs for first-of-a-kind plants (Rubin et al., 2007b). Consistent with this literature, EIA assumes cost increases for the first-four-of-a-kind plants (EIA, 2014b). Figure C-2 provides the best graphic illustration of both phenomena from a study that examined LRs for a range of energy technologies, including the prominent sources of clean energy. LRs can appear to be negative at certain stages. And the relative cost of a prominent competing fossil fuel technology creates a receding target for clean energy technologies.
Nordhaus describes the problem of separating out the effect of accumulating experience from independent factors that change over time (Nordhaus, 2014). In an important and oft-cited paper (Nemet, 2006), Nemet provides a disaggregated study of the development of photovoltaic (PV) technology. Nemet separates PV costs into several components and addresses the evidence for cost reduction in each of the components: “The evidence presented here indicates that a much broader set of influences than experience alone contributed to the rapid cost reductions in the past” (Nemet, 2006, p. 3230). A similar result for Chinese experience in producing wind generators
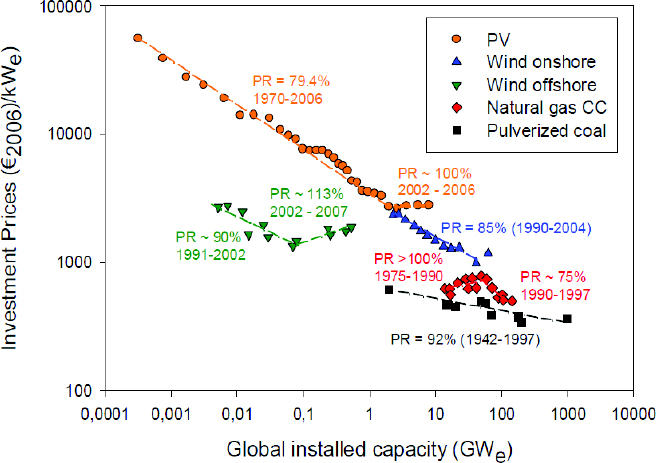
SOURCE: Junginger et al., 2008, p. 10.
appears in Qiu and Anadon (2012), where there were large cost reductions over time, but the LBD rate estimate is only 4 percent.
As is usual with effects of compound growth, extrapolations of learning benefits are sensitive to small initial rate errors. “However, especially for long-term forecasts, small variations in PRs can lead to significantly deviating cost reductions in scenarios or completely different model outcomes in energy and climate models” (Junginger et al., 2008, p. 13; see also Wiesenthal et al., 2012). Nordhaus builds on related observations to make the point that small errors in the estimated LR can produce large biases in the forecast of future costs and the associated premium that might be the target of a deployment subsidy motivated by LBD. Furthermore, and importantly for present purposes, Nordhaus finds that reasonable LRs imply relatively small learning premiums.
The problem of empirical estimation complicates any application of the resulting model for the forecast of costs of deployment (Söderholm and Sundqvist, 2007). Furthermore, even if the estimation problems are set aside, translating LR estimates into policy prescriptions requires a better understanding of the impacts of the key assumptions. How large is the learning premium? And how does the learning premium interact with other policies?
Fixed Clean Deployment
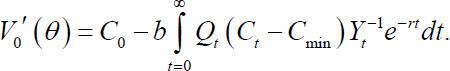
Following Nordhaus (2014) in an application of simplicity to improve insight, a basic model provides a pedagogical tool. The purpose is to understand the primary elements of an estimate of any learning premium. The basic model employed by Nordhaus starts with an exogenous forecast of future clean technology production, Qt. Implicitly, the analysis treats the cost of capacity increases as the present value of all future output of that capacity. Given this fixed trajectory of output, with discount rate (r), the present value of the future clean production is given by
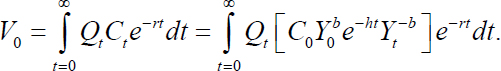
Hence, with an immediate production increment of Ɵ,
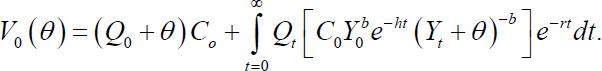
With exogenous Qt, the resulting marginal cost of the incremental production is
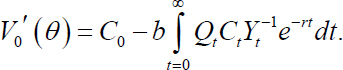
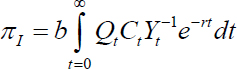
The resulting difference between the current marginal cost (C0) and the total marginal cost is the learning premium:
This result shows that the premium is declining in cumulative production and increasing in the volume of future production. Using a further simplification by assuming a constant growth in the rate of deployment, the model yields a convenient closed-form solution. See Nordhaus (2014) for details. With a 3 percent deployment growth rate and zero exogenous reduction in cost, the Nordhaus solution provides a learning premium summarized here as a percentage of the marginal cost of clean production, C0. The Nordhaus learning premium as a function of the assumed discount rate and LR is shown in Table C-3.
Table C-3 illustrates that the LBD premium is sensitive to the LR and discount rate assumptions, and the premium is relatively low. Clean energy subsidies justified as necessary to jump start deployment and bring the cost down have often been much higher. Subsidies set high enough to make clean technologies competitive with dirty technologies that cost half as much or less would require a premium of more than 50 percent of the clean technology cost.
Variable Clean Deployment
The Nordhaus model provides an important set of insights, but raises immediate issues that appear to be relevant to an evaluation of the future role of LBD. First, the illustrative calculation assumes zero exogenous technological change or other improvements that are independent of cumulative production, which is not consistent with both conventional logic and available empirical
TABLE C-3 Learning by Doing (LBD) Premium
| LR | Discount Rate (%) | ||
|---|---|---|---|
| 3% | 5% | 10% | |
| 0 | 0 | 0 | 0 |
| 10 | 13 | 8 | 4 |
| 20 | 24 | 16 | 9 |
| 30 | 34 | 24 | 13 |
SOURCE: Nordhaus, 2014.
work. Second, the single-factor experience curve does not incorporate the lesson that different components of the technology may have different LRs. Third, the model does not connect to the other benefits of clean technology, most notably in reducing or eliminating the environmental externality of the competing dirty technologies. Fourth, the assumption of constant growth of future production is convenient analytically but not likely to be a good description of the rate of diffusion, which could have faster growth rates once the technology became commercial. Fifth, the difference between social cost and current marginal cost may in part be subject to capture by firms; only the spillover that cannot be captured is an externality that could be the target for a policy intervention. Each of these issues could have a material impact on the estimation of the LBD premium.
Addressing these issues allows for a minimal extension of the Nordhaus model without losing too much transparency. The premium calculations can be done with a nonzero assumption about the rate of exogenous technological change. This is straightforward but has an important interaction with the analysis of the rate of clean technology diffusion. In particular, with a nonzero rate of exogenous technological change (or R&D investments in LBS), the best policy might be to learn by waiting; that is, wait until the costs have declined enough to make the other premiums justify large-scale deployment (Montgomery and Smith, 2007; Santen et al., 2014).
The simple learning model implies that with enough cumulative production, the unit cost of new production will be driven to zero. Although going this far would be extreme, as will be seen, this is not an innocuous assumption. Clearly there is some positive lower bound on the cost. This could be included as a simplified version of a component model where the total cost is divided into two parts, one of which is amenable to technological change and learning, and the other of which is the long-run lower bound on the total cost, Cmin (Manne and Richels, 2004; Neuhoff, 2008).
The treatment of the benefits of substitution for dirty technologies could be incorporated by assuming an exogenous growth rate for the total new technologies and allowing introduction of the clean technology when it is competitive, including accounting for the effect of the negative dirty technology externality and the positive clean technology learning externality. This could be seen as a cost-effectiveness analysis for the electricity sector, without accounting for any impacts of higher electricity prices and reduced electricity consumption.
Some of the benefits of learning can be captured by those deploying the technology. For example, the common argument about improved international competitiveness through early deployment is implicitly an argument that a large portion of the benefits is captured and does not spill over to others. The capture of learning benefits can be set as a parameter ρ. The component that is a spillover is 1−ρ, following Fischer and Newell (2008).
With these extensions, the experience curve for clean technologies would modify the Nordhaus model to yield
![]()
The present value of future costs is
Therefore, the marginal cost of an immediate increment of production becomes
Incorporating the uncaptured spillover effect, the corresponding LBD premium becomes
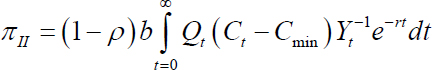
The assumption of exogenous deployment of clean technology can be replaced with a dynamic optimization model. For instance, let the exogenous growth of total power demand be Dt. Although learning is not confined to new or clean technologies (Ordowich et al., 2012), for simplicity the dirty technology represented here has no learning and is described by an exogenous price Pt and an externality cost Et. Again, for simplicity, assume that there is no emission externality cost for the clean technology. Ignoring uncertainty and all the other constraints in the market, the minimalist deterministic discrete dynamic optimization finds the deployment of clean and dirty technology to minimize the total social costs of a given growth path for new capacity production.
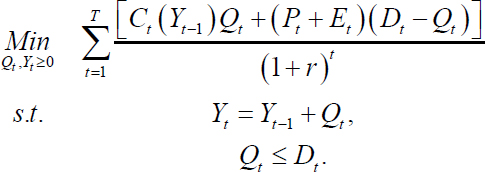
This model allows for learning by waiting, wherein clean technology production is deferred until the costs have declined enough or the dirty externality cost has increased enough to make the clean technology efficient. Given the resulting now-variable deployment of clean technology, the LBD premium πII can be calculated. The externality cost of the dirty technology is a parameter that allows for sensitivity analysis.
The optimization model has a straightforward implementation. The advantage of a closed-form solution, as in the Nordhaus model, is lost. In exchange, at the cost of a modest computation, the model addresses the interactions of LBD, waiting, and the role of dirty technology externalities. Different sets of the key input parameters needed to benchmark the model can provide alternative sensitivity analysis of the learning premium and optimal waiting times before deployment.
Learning Premium
Application of the simple benchmark model produces estimates of the immediate size of the learning premium, the optimal waiting time before large-scale deployment of the clean technology, and the maximum size of the learning premium at the time of first deployment. Figure C-3 illustrates the results for a representative wind-type technology (where the initial cost is 75 percent higher than the price of the dirty technology, and the learning rate is 10 percent) and a representative solar PV-type technology (where the initial cost is 140 percent higher than the price of the dirty technology, and the learning rate is 20 percent). A “no fossil externality policy” case assumes the dirty externality cost is zero. A “fossil externality policy” case assumes an initial dirty externality cost of 20 percent of the price of the dirty technology that grows at the discount rate. The results appear in Figure C-3.
Without a fossil externality price, an assumed 5 percent rate of exogenous technological change means a very long time is required to make the clean technologies competitive. The wait is essentially 35 years for wind and 40 years for solar PV before costs come down enough and deployment begins. Hence, without material deployment, the initial LBD premium is essentially zero. The premium becomes larger in the distant future and reaches its maximum when deployment begins, but the maximum learning premium is still relatively small. The maximum LBD premium is 1.96 percent of the cost for wind and 4.22 percent for solar PV.
With a fossil externality, it is still optimal to wait. The immediate premium is larger and the optimal waiting period is shorter for the wind-type technology than for the PV-type technology. The waiting period reduces to 9 and 12 years for wind and solar PV, respectively. The maximum premium rises to 4.76 percent for wind and 11.01 percent for solar PV. But in all cases, the size of the learning premium is small compared with the benefits of internalizing the dirty technology externality.

These illustrative calculations relate directly to an interpretation of the definition of the learning premium. Repeating the definition from above:
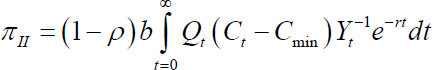
The level of learning benefit captured by firms (ρ) has a proportional effect in reducing the learning premium. The premium is directly proportional to the learning elasticity (b), but a higher elasticity tends to reduce the cost disadvantage (Ct − Cmin) and make the premium correspondingly smaller. When costs are high and declining because of other factors, such as a trend, it pays to wait, which further discounts the immediate learning premium. Higher levels of deployment (Qt) occur when costs are lower, which dampens the learning premium, and the higher deployment depresses the premium by the increase in cumulative output (Yt). The large indirect effect of the dirty technology externality (Et) increases the value of the clean technology and therefore increases deployment and makes future cost savings more valuable. With the exception of the important dirty externality impact, most of the elements of the learning premium interact in offsetting ways, and this helps explain why the value of the learning premium is relatively low.
Sensitivity Cases
Looking at the PV case with a carbon policy, eliminating the exogenous growth rate almost doubles the waiting period until the dirty technology externality costs have increased enough to justify deployment. But in this instance, the costs are so high that the learning premium increases by a factor of 1.5.
Setting the minimum cost bound Cmin to zero reduces the PV deployment waiting period from 12 to 3 years and changes the deployment learning premium from 11 percent to 20 percent. Apparently, the assumption about the minimum cost level is important.
Surprisingly, changing the discount rate over the range 3 percent to 10 percent has only a modest effect on the size of the learning premium or the waiting time to deployment. The implementation here assumes the dirty technology externality grows at the rate of discount. The higher discount rate lessens the value of the future, but the costs in the future are correspondingly higher. The same offset occurs in the opposite direction with a lower discount rate.
The assumption of constant real dirty technology prices, albeit with increasing externalities, is an assumption distinctly influenced by the shale revolution. For example, in a preshale revolution model of LBD for prospective PV installations in California, van Bentham and colleagues (2008) assume high and increasing real natural gas and conventional electricity prices such that LBD dominates even the environmental benefits. The forecast implies PV prices below those of conventional dirty technology even without a carbon policy (van Benthem et al., 2008). With 3 percent growth of costs of dirty technologies due to fossil fuel shortages, the relative competitiveness of clean technologies would improve, the waiting period would fall, and the immediate learning premium for PV would nearly double. Essentially, the higher fossil fuel cost assumptions mean that in a few years, the PV technology would reach the holy grail of the Google mantra “RE <C”—clean renewable technology that costs less than carbon-based fuels.
POLICY MODELING FOR ENDOGENOUS TECHNOLOGICAL CHANGE
The importance of identifying the multiple factors driving innovation is clear from the empirical literature (Lindman and Söderholm, 2012). The single-factor experience models confound the effect of LBD with the separate impacts of LBS and exogenous change that support LBW.
In relation to the invention-innovation-diffusion paradigm, single-factor learning curves amount to leaving out the effect
of R&D on technical change as well as the main aspect of technology diffusion—i.e., the effect of cost reduction on higher technology adoption. The effect of cumulative capacity on the unit cost of technology as in single-factor learning by doing models is only a secondary effect of technology diffusion. Therefore, single-factor learning curves are not suitable for analysis of technologies that are in early stages of progress. A possible response to these shortcomings is to extend learning models to include R&D expenditures in addition to capital investment. (Jamasb and Kohler, 2008)
“Multi-factor models of this type offer improved explanations of the processes that contribute to cost reductions for the technology under study, and thus arguably provide more accurate assessment about the magnitude of investments or subsidies needed to bring down the cost of technology” (Yeh and Rubin, 2012, p. 768). EIA uses multifactor models with different LRs for different technology components and declining LRs with increased deployment (EIA, 2014b).
Distinct treatment of the factors is important because they each have different policy implications. Factors such as scale economies, when fully internalized by the private sector, may be important for the economy but do not require any public policy solution. A high level of exogenous technological change, whether from general technology trends or spillover effects from other industries, would imply waiting until costs decline before investing heavily in large-scale deployment. A high premium for LBS would imply a policy of investing in upstream research and small-scale deployment to niche markets to provide feedback and interaction with the directed research. A high LBD premium could imply policies to support large-scale take-up of otherwise expensive clean technologies. And, of course, the benefits of reduced dirty emissions would imply direct use of policies to create a market price for emissions.
In Fischer and Newell (2008), the analysis of technology change incorporates a learning premium within a two-period model that includes a representation for both intentional research (LBS) and learning through deployment of the clean technologies (LBD). The model includes multiple types of energy supply technologies and an aggregate model of electricity demand. There is an explicit analysis of subsidy policies for new technologies, learning capture, research subsidies, and caps on carbon emissions with associated prices. The model is simple enough to see and explain what is happening but includes more complicated trade-offs and benchmark calculations.
The Fischer and Newell (2008) technology learning model is a single-component model, i.e., Cmin = 0, and treatment of future production and learning benefits includes output from both new and existing capacity, which should increase the implied learning premium. However, the main conclusions are
consistent with the discussion above. “The underlying process of technological change, be it through learning by doing or R&D, turns out to be far less important than the incentives to use technology efficiently to reduce emissions. Nonetheless, the nature of technological change and the degree of knowledge spillovers do have discernable effects on the relative cost of alternative policies, which have differential effects on knowledge investment and how it occurs” (Fischer and Newell, 2008, p. 160).
An extension of this model to include energy efficiency appears in Fischer et al. (2013). For this expanded model, the authors conclude that “…it is telling that even with more refined representations of electricity generation options and market failures, emissions pricing still remains the single most cost-effective option for meeting emissions reduction goals. Technology policies are very poor substitutes, and when they overreach, they can be poor complements too” (p. 31).
The importance of active research (LBS), rather than passive learning (LBD), is intuitively plausible. Other things being equal, direct is better than indirect learning. Both can be valuable, and both types of investment face diminishing marginal returns. There is a consistent conclusion with two-factor models that represent LBS and LBD, and that “…examine the relative importance of R&D and capacity deployment for different technology categories. The results generally show higher learning by research than learning by doing rates. We do not find any technological development stage where learning by doing is the dominant driver of technical change” (Jamasb, 2007, p. 52). “An implication of devising policies based on overestimated learning by doing rates is that they can shift the scarce resources earmarked for innovation resources from more productive R&D activities to less productive and more costly capacity deployment policies” (Jamasb, 2007, p. 66). “The lesson from these observations is to be cautious in interpreting the policy conclusions of models that assume only a single source of technological progress or that neglect critical factors such as spillovers” (Clarke et al., 2006, p. 593).
The logical extension of these arguments points to multifactor models that include at least LBS, LBD, and exogenous technological change (Qiu and Anadon, 2012). The importance of controlling for the many factors is obvious for empirical work. However, the same conclusions apply to models of innovation used to prepare forecast simulations to estimate learning premiums and evaluate policies going forward (Clarke et al., 2008; DOE, 2014a).
A natural and relatively simple extension of current applications would be to modify the cost model to include a representation of a time trend, cumulative production, and knowledge (t,Yt,Kt). This would yield a simulation model of the form
![]()
The accumulation of knowledge could include a representation of the depreciation of knowledge found important in some studies (Nemet, 2012). Benchmarking the multiple components of the model would give attention to the differences between experience in and outside the market of interest (van Benthem et al., 2008). A more detailed simulation model would allow for more detailed representation of the technologies to consider portfolio effects (Neuhoff and Twomey, 2008) and constraints on rates of penetration (Manne and Richels, 2004; Neuhoff, 2008).
In forecasts over the long run, the two-period model of Fischer and colleagues (2013) provides insight. But a multiperiod model would be necessary to track vintages of technologies and the trade-offs of waiting for costs to decline or externality benefits to grow.
Over a long time horizon, and with opportunities to change policies given new information, the use of deterministic models cannot fully capture the dynamic paradigm of act-learn-act that incorporates uncertainty and hedging strategies. Although a full dynamic optimization model under uncertainty is challenging, both to implement and to interpret, the application of Santen and Anadon (2014) includes use of approximate dynamic programming techniques to investigate optimal innovation policies. The treatment of uncertainty affects the innovation strategy. “Results show that under a carbon constraint, the optimal investment strategy includes lower solar PV RD&D spending upfront but more RD&D spending later—and sometimes higher spending overall—when compared to a strategy under perfect foresight about RD&D outcomes, or based on single-shot decision-making under uncertainty without learning” (Santen and Anadon, 2014, p. v).
POLICY FOR INNOVATION
This overview of different types of learning supports a view that LBD is relevant, but the impact implies a relatively small premium that could be the focus of public policy. More important is LBS, through R&D, and waiting to get the costs for clean energy technology close to being commercially competitive. The horizon for deployment depends critically on the size of the fossil fuel externality cost. A policy needs to focus on the interactions of the market externalities and market failures. The learning premium is material, but cannot carry much of the burden of supporting large-scale deployment of expensive clean energy technologies.
Public policy needs to address the carbon price and the costs of other emissions, then invest in upstream R&D, the muddle in the middle, and initial limited deployment. The remaining LBD incentives for early large-scale uptake are likely to be small. This view of the proper balance of public policy is at odds with current conditions. There is too little attention to fundamental innovation and too much emphasis on deploying clean energy technologies that cannot
meet the challenge (Zachmann et al., 2014). “The fundamental problem for cost-effective GHG [greenhouse gas] controls keeps coming back to the externality associated with R&D, and the unique degree to which solving the GHG externality depends on effective technological change. Until the R&D externality is resolved, there is almost no case to be made for starting to control the environmental externality” (Montgomery and Smith, 2007, p. 339).
As found by many others, the implications for the form of public support lean toward LBS and away from reliance on LBD. Furthermore, the basic model discussed above employs a simplifying assumption that a subsidy for clean technology leads to substitution for the dirty technology. In reality, this is not true when there are many different technologies. For example, the effect of the U.S. production tax credit for wind has been to substantially impair the economics of nuclear power rather than to solely substitute for fossil fuel production. Compared with the direct effect of a carbon price, indirect deployment subsidies for clean energy technology tend to be ineffective in addition to being unsupported by the small LBD premium:
Subsidies for green power (or mandated utility offer prices for power generated in this way, known as “feed-in tariffs”) have been portrayed as nearly equivalent to pricing externalities, but more politically acceptable. This approach, however, is very problematic for three closely related reasons.
First, subsidizing green power for reducing pollution (relative to some counterfactual) is not equivalent to taxing “brown” power to reflect the marginal social damage. If end-use electricity demand were completely inelastic and green and brown power were each completely homogeneous, they would have the same effect; the only effect of the subsidy would be to shift the production share towards green and away from brown power. But the underlying market failure is the underpricing of brown power, not the overpricing of green power, so subsidizing green power from government revenues artificially depresses the price of power and discourages efficient energy consumption. As a result, government subsidies of green power lead to overconsumption of electricity and disincentives for energy efficiency. In addition, for any given level of reduction, it will be achieved more efficiently by equalizing the marginal price of the pollutant across sectors as well as within sectors. This is not achievable through ad hoc subsidies to activities that displace certain sources of emissions.…
Second, subsidizing green power generally fails to recognize the heterogeneity within the green power sector and among the brown power sources that are being displaced. Solar power that reduces coal-fired generation lowers greenhouse gas emissions by about twice as much on average as if it reduces natural-gas-fired generation. Assuming that the marginal generation displaced is equal to the average generation mix in the system can be a poor approximation.…The problem arises because subsidizing green power is an indirect approach to the pollution problem, and the relationship between green power and emissions avoided is not uniform. It would not arise with a direct tax (or pricing through tradable permits) on pollution (Borenstein, 2012, pp. 79-80).
Nordhaus (2013, p. 266) makes a similar point:
Subsidies pose a more general problem in this context. They attempt to discourage carbon-intensive activities by making other activities more attractive. One difficulty with subsidies is identifying the eligible low-carbon activities. Why subsidize hybrid cars (which we do) and not biking (which we do not)? Is the answer to subsidize all low-carbon activities? Of course, that is impossible because there are just too many low-carbon activities, and it would prove astronomically expensive. Another problem is that subsidies are so uneven in their impact. A recent study by the National Academy of Sciences looked at the impact of several subsidies on GHG emissions. It found a vast difference in their effectiveness in terms of CO2 removed per dollar of subsidy. None of the subsidies were efficient; some were horribly inefficient; and others such as the ethanol subsidy were perverse and actually increased GHG emissions. The net effect of all the subsidies taken together was effectively zero! So in the end, it is much more effective to penalize carbon emissions than to subsidize everything else.
The optimal policy portfolio includes many instruments. It is important to note, however, that not all policies are equal:
Some clear principles emerge. We find that when the ultimate goal is to reduce emissions, policies that create incentives for fossil-fueled generators to reduce emissions intensity, and for consumers to conserve energy, perform better than those that rely on incentives for renewable energy producers alone. Overall, we find that the nature of knowledge accumulation is
far less important than the nature of the policy incentives.…For the type of moderate emissions targets we explore, a renewable energy R&D subsidy turns out to be a particularly inefficient means of emissions reduction, since it postpones the vast majority of the effort to displace fossil-fueled generation until after costs are brought down.…This requires very large R&D investments and forgoing near-term cost-effective abatement opportunities. While climate change is a long-term problem, the results for mid-term strategies emphasize the important role for policies that encourage abatement across all available forms and timeframes, as well as the limitations of narrowly targeted policies—particularly those focused solely on R&D.
Nonetheless, given the presence of more than one market failure—an emissions externality and knowledge spillovers—no single policy can correct both simultaneously; each poses different trade-offs. The presence of knowledge spillovers means that separate policy instruments are necessary to optimally correct the climate externality and the externalities for both learning and R&D. In fact, we find that an optimal portfolio of policies can achieve emissions reductions at a significantly lower cost than any single policy, although the emissions reductions continue to be attributed primarily with the emissions price.
Together, these results illuminate some of the arguments in Montgomery and Smith that R&D is the key for dealing with climate change and that an emissions price high enough to induce the needed innovation cannot be credibly implemented. We show that an emissions price alone, although the least costly of the single policy levers, is significantly more expensive alone than when used in combination with optimal knowledge subsidy policies. Although a high future emissions price may not be credible, with the combination policy the required emissions price is much more modest. However, if one believes that even a modest emissions price is not politically feasible, an R&D subsidy by itself is not the next best policy, and the costs of that political constraint are likely to be quite large and increasing with restrictions on the remaining policy options. It should be kept in mind, however, that we focus on reductions over the near-to-mid-term and incremental improvement of existing technology, rather than breakthrough technologies that might achieve deep reductions.
It seems likely that R&D policies have greater salience in the latter context, although this lies beyond the scope of the current paper. (Fischer and Newell, 2008, pp. 143-144)
The optimal portfolio will address both the structure and the targets for policy support (Kriegler et al., 2014). A real carbon price on carbon emissions is better than searching for an equivalent subsidy for the right clean energy technology, particularly when the right technology may not yet be known. Estimating the appropriate price of carbon is a challenge, but it is a challenge that has already been undertaken by the U.S. government (Interagency Working Group on Social Cost of Carbon, 2013). And not all subsidies are the same. For example, an investment tax credit can affect the economics of wind without the perverse collateral effects of a production tax credit in lowering the perceived variable cost of wind from zero to minus the value of the credit. Given the low value of the LBD premium and the high value of reducing costs before large-scale deployment, a direct expansion of government support for upstream transformational R&D would be better than a broad subsidy for deploying existing clean energy technology.
The spillover effects of LBD can be invoked as a reason for public support for deploying expensive clean energy technologies. There are clear empirical difficulties in estimating the size of the appropriate LRs and implied premiums. The collective results support the view that the LBD premium is small. Much more important is the price on carbon and related fossil fuel externalities. Given the scale of the clean energy technology challenge and the state of current technology, greater emphasis is warranted on the earlier stages of the innovation process in the search for truly transformative technologies that would be cheap enough to be deployed with the market incentive of a price on carbon.
The implication for clean energy innovation policy is that the most important priorities are identifying and creating new options, demonstrating the efficacy of these options, and setting the stage for early adoption of those that are most promising. Although there are policies that would improve the conditions for eventual large-scale take-up and improvements in use, these policies are likely to be expensive and ineffective without a substantial investment in the earlier stages of the innovation process. The emphasis needs to be on developing technologies that can truly compete with incumbent energy sources. These technologies are not in hand today, and efforts to create these technologies for the future need to be expanded and accelerated. There is no guarantee of success, but the effort is worth a major investment with a clear view of the difficulties ahead. This challenge creates an opportunity and a need for governments at all levels, keeping an eye on the prize of expanding the innovation machine.


