
2
NFIP Procedures for Analyzing Flood Hazard and Calculating Insurance Rates
Under the National Flood Insurance Program (NFIP), engineers carry out hydrologic and hydraulic analyses to describe flood hazard, calculate flood elevations, delineate floodplain boundaries, and designate flood zones for insurance rating. The results of the flood studies are summarized in reports and portrayed graphically on Flood Insurance Rate Maps (FIRMs). The NFIP, Write Your Own Companies, and insurance agencies use the maps to determine whether a structure being insured is located in a Special Flood Hazard Area, and, if so, its elevation relative to the base flood elevation. This information is combined with additional information about the flood hazard, exposure to the hazard, structure characteristics, expenses, and other factors to determine insurance rates. This chapter provides an overview of NFIP flood studies, Flood Insurance Rate Maps, and methods for calculating flood insurance rates.
FLOODPLAIN ANALYSIS AND MAPPING
NFIP flood study methods and maps were reviewed in detail in Mapping the Zone: Improving Flood Map Accuracy (NRC, 2009), and are summarized below.
Flood Studies
The type of flood study depends on the type of flood hazard, primarily riverine or coastal. Riverine flood studies focus on the river’s watershed, precipitation, the topography along the river and adjacent floodplain, and the hydraulic characteristics of the river and floodplain. The studies involve the following steps, which are illustrated in Figure 2.1:
- Hydrologic analyses are conducted to estimate the river discharge rate with 1 percent annual chance of exceedance. Depending on data availability, the discharge rate is estimated using (a) statistical analyses of historical annual maximum discharges measured at stream gages; (b) regression equations derived from observations at similar locations in the region to estimate the 1 percent annual chance exceedance discharge as a function of drainage area and other river basin characteristics; or (c) precipitation-runoff models, which convert rainfall and snowmelt to stream discharge rates. These calculations are based on past events and do not account for changing hydrologic conditions resulting from watershed development, increased storm intensity, or other factors.
- Hydraulic modeling is carried out to determine the depths that correspond to the river discharge rates estimated in the hydrologic analyses. Software applications such as HEC-RAS are commonly used to model the movement of water. HEC-RAS simulates flow that is predominantly parallel to the channel, based on the geometry of the channel and floodplain, the slope of the channel and ground, the resistance to flow due to channel roughness and bridges and obstructions, and ponding and pooling of water in the channel and on the floodplain. In
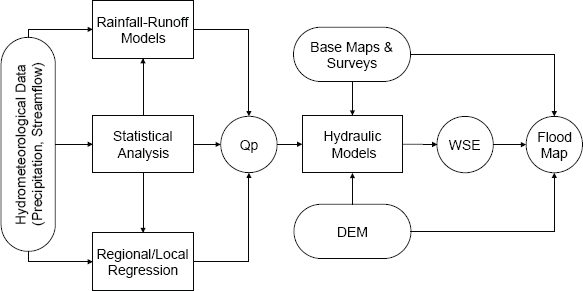
FIGURE 2.1 Schematic of an idealized riverine flood study showing the data inputs (rounded boxes), models and methods used in the hydrologic and hydraulic analysis (boxes), and outputs (circles), including the flood discharge (Qp) and the water surface elevation (WSE). Note: DEM = digital elevation model. SOURCE: NRC (2009).
the analysis, levees that meet NFIP standards are modeled as blocking flow onto the floodplain, and levees that do not meet the standard are modeled as if they fail to protect. This model accounts for the loss of natural water storage in the floodplain. The result of the computation is an estimated base flood elevation for a cross section of the channel and floodplain. When flow patterns are more spatially variable, a two-dimensional hydraulic model is used to compute the maximum water surface elevation for cells or polygons that represent the channel and floodplain geometry.
- Comparisons of estimated water surface elevations at river cross sections (or cells or polygons) to the ground elevations along the river are made to define the extent and properties of the inundated floodplain. If the computed water surface elevation for a point or cell is greater than the ground elevation, then the point or cell will be inundated by the 1 percent annual chance exceedance flood and the difference between the two elevations is the inundation depth. Ground elevations are estimated using topographic data collected in field surveys or taken from digital elevation models derived from aerial surveying (photogrammetry) or, since the early 2000s, from remote sensing technologies, such as lidar (light detection and ranging).
The same process is followed for the 0.2 percent annual chance exceedance flood and delineation of the moderate flood hazard area. The studies also establish the floodway—the stream channel and adjacent part of the floodplain that must remain open to permit passage of the 1 percent annual chance exceedance discharge, and thus prevent an increase in flood levels.
Coastal flood studies are similar to riverine flood studies, but they also assess the effects of storm surge (water piled up against the shore during a storm) and tidal- and wind-driven wave action. The studies use data on fetch (the distance over water that the wind blows in a single direction), near-shore terrain and
water depths, and wind speed to predict storm surge properties. Data on past storms from gages and historic high water marks are used with statistical and conceptual models to determine the storm surge elevations that have a 1 percent chance of being exceeded annually. Next, transects perpendicular to the shoreline are surveyed to determine onshore and offshore ground elevations. The elevations are then used to compute the height of wave crests and wave run-up (the rush of waves up a slope or structure). For coastal flooding, the base flood elevation is the stillwater elevation plus wave run-up, or the wave crest elevation, whichever is greater (FEMA, 2011).
Flood studies can be expensive (up to a few tens of thousands of dollars per stream mile; NRC, 2009), so the NFIP strategy is to carry out the detailed studies described above in densely populated areas. In relatively unpopulated areas, the NFIP generally conducts approximate studies, which use existing flood data and floodplain information (e.g., historic high water marks, aerial photographs of previous floods, empirical information on stream characteristics) to generate an approximate outline of the Special Flood Hazard Area. Because detailed hydraulic analyses are not performed, base flood elevations are generally not determined in approximate studies.
Flood Insurance Rate Maps
Results from flood studies are portrayed graphically on FIRMs, which show flood hazard areas and flood zones, and may also show base flood elevations, floodways, and other data. An example of a FIRM in a riverine area is shown in Figure 2.2. FIRMs are used for a variety of purposes, including rating flood insurance policies; regulating new development in floodprone areas; determining whether flood insurance must be purchased as a condition of a loan; and local flood mitigation planning, evacuation, and infrastructure design.
About one-third of the nation’s 3.5 million miles of rivers and coasts has been mapped, covering more than 90 percent of the U.S. population (NRC, 2009). Only about half of those maps have flood elevations. Moreover, the age and quality of these maps vary. In 2008, half of the NFIP’s map panels were more than 15 years old, and 8 percent were 10 to 15 years old (GAO, 2008; Michel-Kerjan, 2010). Flood study results are
presumed representative of current flood hazard for 5 years, after which time they are examined and identified as representative and appropriate or in need of updating.1 Current funding levels are sufficient to update existing flood studies, but not to map new areas or to increase the number of miles with base flood elevations.
FIRMs delineate areas of high, moderate, and minimal flood hazard. These areas are labeled as particular flood zones based on the type of flooding (e.g., riverine, coastal, shallow), whether detailed hydraulic analyses were performed (and thus whether base flood elevations were calculated), and the presence of flood protection measures. These zones, which are described in Table 2.1, are used in the insurance rate setting process. Some of the zones have been renamed (e.g., Zone X [shaded] has replaced Zone B) or grouped into larger categories (e.g., Zone AE has replaced zones A1–A30). Because it can take many years to carry out the engineering studies needed to create a new FIRM or revise an existing FIRM, the older zone designations are still found on some flood maps.
The National Flood Insurance Act of 1968 established two broad categories of insurance rates for the NFIP:2
- risk-based rates (also called actuarial rates), based on flood risk and accepted actuarial principles (e.g., premium income covers losses and costs of providing insurance; rates are fair, reasonable, and not unfairly discriminatory; Mathewson et al., 2011); and
- subsidized rates for certain older structures, based on considerations that would yield reasonable premiums while encouraging floodplain management and the widespread purchase of flood insurance.
An overview of how rates are determined for these two categories is presented below.
______________
1 Presentation to the committee by Doug Bellomo, Director, Risk Analysis Division, FEMA, on January 6, 2014.
2 Public Law 90-448.
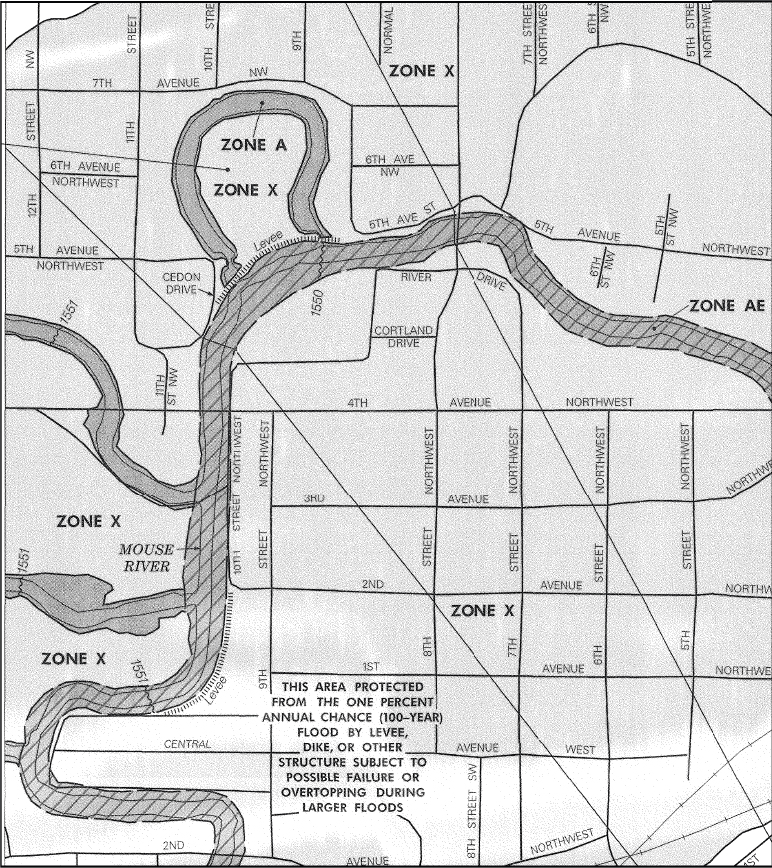
FIGURE 2.2 Portion of a Flood Insurance Rate Map of Ward County, North Dakota, which flooded in 2011 (see Figure 1.1). Dark gray areas denote the Special Flood Hazard Area (AE and A zones), and light gray denotes areas of moderate flood risk (shaded X zone). Levees along portions of the river (dotted lines) are credited as protecting areas from the 1 percent annual chance exceedance flood. Diagonal lines show where cross sections were taken. SOURCE: FEMA Map Service Center (map item ID 38101C0781D).
TABLE 2.1 NFIP Flood Zones
| Hazard Leve | Zone | Description | |
| Special Flood | Hazard Areas | ||
| High | A | Areas subject to inundation by the 1 percent annual chance exceedance flood. Because detailed hydraulic analyses have not been performed, no base flood elevations (BFEs) or flood depths are shown. | |
| AE, A1–A30 | Areas subject to inundation by the 1 percent annual chance exceedance flood determined by detailed methods. BFEs are shown within these zones. Zone AE is used on new and revised maps in place of zones A1–A30. | ||
| AH | Areas subject to inundation by 1 percent annual chance exceedance flood (usually areas of ponding) where average depths are 1–3 feet (shallow flooding). BFEs derived from detailed hydraulic analyses are shown within this zone. | ||
| AO | Areas subject to inundation by 1 percent annual chance exceedance flood (usually sheet flow on sloping terrain) where average depths are 1–3 feet (shallow flooding). Average flood depths derived from detailed hydraulic analyses are shown within this zone. | ||
| AR | Areas that result from the decertification of a previously accredited flood protection system that is determined to be in the process of being restored to provide base flood protection. | ||
| A99 | Areas subject to inundation by the 1 percent annual chance exceedance flood, but which will ultimately be protected upon completion of an under-construction federal flood protection system. In these areas, enough progress has been made on the construction of a protection system, such as dikes, dams, and levees, to consider it complete for insurance rating purposes. Zone A99 may be used only when the flood protection system has reached specified statutory progress toward completion. No BFEs or flood depths are shown. | ||
| V | Areas along coasts subject to inundation by the 1 percent annual chance exceedance flood with additional hazards associated with storm-induced waves. Because detailed coastal analyses have not been performed, no BFEs or flood depths are shown. | ||
| VE, V1–V30 | Areas along coasts subject to inundation by the 1 percent annual chance exceedance flood with additional hazards due to storm-induced velocity wave action. BFEs derived from detailed hydraulic coastal analyses are shown within these zones. Zone VE is used on new and revised maps in place of zones V1–V30. | ||
| Other Areas Moderate | B, X (shaded) | Moderate risk areas within the 0.2 percent annual chance exceedance floodplain, areas of 1 percent annual chance exceedance inundation where average depths are less than 1 foot, areas of 1 percent annual chance exceedance inundation where the contributing drainage area is less than 1 square mile, and areas protected from the 1 percent annual chance exceedance flood by a levee. No BFEs or flood depths are shown. Zone X (shaded) is used on new and revised maps in place of Zone B. | |
| Minimal | C, X (unshaded) | Minimal risk areas outside the 1 percent and 0.2 percent annual chance exceedance floodplains. No BFEs or flood depths are shown. Zone X (unshaded) is used on new and revised maps in place of Zone C. | |
| Undetermined | D | Unstudied areas where flood hazards are undetermined, but flooding is possible. | |
SOURCE: FEMA Map Service Center.
Risk-Based Rates
Risk-based rates are charged for post-FIRM structures in all flood zones and for pre-FIRM structures in areas of moderate and minimal flood hazard (Hayes and Neal, 2011). Rates are calculated by estimating the average annual loss (in dollars) from flooding, then adjusting for program costs (Box 2.1). NFIP estimates of average annual loss are made using the NFIP hydrologic method, which has two components (FEMA, 2013d):
BOX 2.1
NFIP Formula for Calculating Risk-Based Rates
The NFIP actuarial rate formula for calculating risk-based rates is as follows:
![]()
where
PELV is the annual probability that flood waters will reach or exceed a given depth relative to the base flood elevation
PELVi is the incremental probability that the flood water depths are in a certain interval
DELV is the damage to the property, expressed as a percentage of the total property value (replacement value for structure, actual cash value for contents), resulting from that level of flood water
DELVi is the average damage within a certain depth interval corresponding to PELVi
Min is the minimum elevation relative to the lowest floor at which flood damage occurs
Max is the elevation relative to the lowest floor at which flood damage approaches a maximum
LADJ is a loading factor to account for loss adjustment expenses
DED is a factor to eliminate that portion of the loss that will be borne by the policyholder through his or her deductible
UINS is a factor to adjust for how much a policyholder has underinsured his or her property
EXLOSS is the expected loss ratio, which serves as a loading for underwriting expenses, a contingency factor, and other factors
___________
SOURCE: FEMA (2013d).
- a description of the hazard that estimates the probability of various depths of flood water in the structure (denoted PELV in the rate formula), based on selected NFIP hydrologic and hydraulic analyses; and
- a description of exposure and vulnerability that estimates the damage that flood water depths would cause (denoted DELV), based on NFIP claims from similar inundation depths.
The average annual loss is calculated by summing the probability-weighted estimate of damage amounts for each possible inundation depth within the structure.
The average annual loss is converted into an insurance rate by adjusting for expenses and other factors (the second term of the formula in Box 2.1). Rates are adjusted upward (loaded) to account for loss adjuster fees and claims investigations costs (LADJ) as well as agent commissions and acquisition expenses and contingencies (EXLOSS). The rates are also adjusted upward to account for underinsurance (UINS; i.e., the insured value is less than the full value of the property). Rates are adjusted downward to account for the portion of the claim that will not be covered because of the policy deductible (DED). It should be noted that the rate formula presented here is a simplification useful for illustrating the concepts. The actual rate formula employed by the NFIP contains more complicated terms for adjusting for underinsurance and for computing rates for basic and additional limits of insurance coverage (see Hayes and Neal, 2011).
Application of the rate formula yields a price per unit of insurance for each $100 of property coverage. The rate is multiplied by the amount of insurance being purchased to determine the premium a policyholder pays. In Community Rating System communities, policyholders receive premium discounts for mitigation actions taken to reduce flood risk in the community, such as improving drainage systems (see Chapter 1, “National Flood Insurance Program”). Individual policyholders can also reduce their premiums through mitigation, for example, by elevating their home or business. In such cases, the average flood losses will be lower, and the insurance rating will be redone using the revised rating elements. The effect of most substantive mitigation actions can be accommodated in the current rate setting process. The impact on rates and the costs of mitigation actions, including those not covered in
current rate setting and underwriting processes (e.g., residential floodproofing), are being investigated by the NFIP (FEMA, 2015).
The hydrologic method is used to determine risk-based rates in Special Flood Hazard Area zones, where the most detailed engineering studies are carried out and base flood elevations are established. About one-third of the risk-based insurance policies cover structures in other zones (e.g., Zone X; Hayes and Neal, 2011).3 In these zones, the NFIP has determined that the costs to develop flood magnitude and probability functions are too high relative to the program’s floodplain management benefits (Hayes and Neal, 2011). Consequently, risk-based rates in these zones are based on extrapolations of the hydrologic method, along with other actuarial and engineering judgments and underwriting experience.
The insurance premium paid by a flood insurance policyholder depends on the flood zone, occupancy (e.g., single family, nonresidential), construction (e.g., no basement), the location of contents (e.g., lowest floor, above the lowest floor), the number of floors, the type of supporting foundation, and the structure’s elevation relative to the base flood elevation (FEMA, 2013b). The NFIP uses these factors to group structures into classes, then determines the average annual loss and insurance rates for each class, rather than for individual structures. Consequently, a policyholder will pay an amount averaged over the pool of all other policyholders in a given class of structures, which may be somewhat higher or lower than the premium would be if it were based on his or her individual flood risk (e.g., see Michel-Kerjan et al., 2015). Grouping insureds into classes is a standard industry practice.
Subsidized Rates
Subsidized rates are available by statute for older structures built before floodplain maps were issued and adopted by the community (pre-FIRM structures) as well as for certain newer (post-FIRM) structures, such as those with protective structural measures under construction. Pre-FIRM subsidized rates do not depend on the structure elevation. Rather, the insurance rate is based on the flood zone, occupancy, construction, and contents location (FEMA, 2013b). Pre-FIRM subsidized rates are employed primarily in Special Flood Hazard Areas where insurance purchase is mandatory. Subsidized rates for structures that are not primary residences or that suffer severe repetitive losses are beginning to be phased out (see “National Flood Insurance Program” in Chapter 1).
Subsidized rates are based both on subjective (e.g., political, public policy) considerations and objective processes, including comparisons with the amount needed to meet NFIP premium income targets. Prior to 2005, the NFIP total annual premium income was targeted so that the combination of subsidized and risk-based premiums would be at least sufficient for the historical average loss year, based on losses and associated expenses since 1978, and corrected for inflation and changes in coverage and mix of policy holders. However, catastrophic flood losses to the NFIP in 2005 (from hurricanes Katrina, Rita, and Wilma) raised the historical average loss year so much that using it to set NFIP premium income targets would have required the elimination of subsidized premiums. Consequently, the NFIP gives only partial weight to the 2005 losses in establishing the historical losses benchmark (Hayes and Neal, 2011), which reduces, but does not eliminate subsidies.
Pre-FIRM subsidized premiums are about 55–60 percent lower than warranted by their true flood risk (Hayes and Neal, 2011). However, the average subsidized premium being paid is still significantly higher than the average risk-based premium being paid, because the flood risk to pre-FIRM structures is generally so much higher than the flood risk to structures that comply with modern floodplain management ordinances.
Rating for Negatively Elevated Structures
The vast majority of negatively elevated structures in Special Flood Hazard Areas are pre-FIRM structures eligible for subsidized rates and post-FIRM structures grandfathered into rates that are lower than indicated by new mapping. Of the approximately 1 million negatively elevated structures in the NFIP portfolio, only about 240,000 have structure elevation data and have been actuarially rated.4 These structures are mainly post-
______________
3 Personal communication from Andy Neal, FEMA, on March 3, 2014.
4 Personal communication from Andy Neal, FEMA, on July 9, 2014.
TABLE 2.2 Comparison of Subsidized and Risk-Based Premiums for a Single Family Home in an AE Zone
| Type of Rating | Difference between lowest floor elevation and base flood elevation | Premium for Type of Structurea | |
| 2 or more floors with basement, no machinery or equipmentb | 1 floor, non-elevated, no basement or crawlspacec | ||
| Subsidized rating | Not applicable | $4,203 | $3,600 |
| Risk-based rating | +4 feet | $553 | $553 |
| +3 feet | $572 | $591 | |
| +2 feet | $604 | $667 | |
| +1 feet | $712 | $931 | |
| +0 feet | $1,090 | $1,815 | |
| –1 feet | $2,610 | $5,642 | |
| –2 feet | $2,764 | $6,443 | |
| –3 feet | $2,894 | $8,589 | |
| –4 feet | $3,035 | $10,723 | |
| –5 feet | $3,574 | $13,081 | |
| –6 feet | $4,169 | $15,184 | |
| –7 feet | $4,970 | $17,215 | |
| –8 feet | $5,977 | $19,382 | |
| –9 feet | $7,200 | $21,467 | |
| –10 feet | $8,814 | $23,496 | |
a Premium calculation includes coverage of $250,000 for the structure and $100,000 for its contents, a standard deductible, federal policy fee and reserve, and no Community Rating System discount.
b Limited basement coverage generally means lower premiums.
c All habitable space at ground level increases the premium.
SOURCE: Presentation to the committee by Joseph Cecil, Insurance Examiner, FEMA, on January 6, 2014.
FIRM construction built out of compliance with the base flood elevation standard. An example comparing subsidized and risk-based premiums for a single family home in an AE zone is given in Table 2.2. The premiums for negatively elevated structures are shaded gray.
The process for setting risk-based rates for negatively elevated structures is similar to that used for structures built at or above the base flood elevation, although additional underwriting procedures are required. In particular, the valuation of machinery, equipment, and appliances in basements, enclosures, and crawlspaces is factored into the rate; and additional information is collected on the construction and use of crawlspaces. Policy applications for structures that are more than 1 foot below the base flood elevation in an AE zone or more than 3 feet below the base flood elevation in a VE zone receive a more detailed review (FEMA, 2013c). In some cases, a local building official, engineer, or architect must validate assertions about the construction of the structure and enclosures below (e.g., crawlspaces, garage), as well as how a structure is elevated off the ground (e.g., foundation walls, piles). These additional procedures are intended to determine the vulnerability of negatively elevated structures to damage and how that vulnerability might affect the potential for damage to upper portions of the structure.
The additional underwriting procedures described above provide a means to set risk-based rates for negatively elevated structures without adjusting the terms of rate formula to accommodate the flood conditions and drivers of damage and loss that affect these structures. The following chapters examine the terms in the actuarial rate formula in more detail, and discuss how they can be adjusted to develop fair and credible rates for negatively elevated structures.


