
3
Methods for Assessing Flood Risk
A key to informed decision making on risk management and risk transfer (insurance) is an accurate assessment of risk. In the context of this report, flood risk refers to the magnitude of economic flood loss and the probability that losses of that magnitude will occur. Flood risk assessments focus on four main components:
- Flood hazard—the probability and magnitude (e.g., depth, velocity, discharge) of flooding
- Exposure—the economic value of assets subjected to flood hazard
- Vulnerability—the relationship of flood hazard properties to economic loss
- Performance—the effectiveness and behavior of flood protection and damage mitigation measures that modify the flood hazard, the exposure, or the vulnerability
This chapter describes how these four flood risk components are commonly assessed and discusses variations in assessment approaches used by government agencies and private companies to carry out their particular flood risk management or flood insurance responsibilities.
ASSESSING THE COMPONENTS OF FLOOD RISK
Assessing Flood Hazard
Flood hazard assessment estimates the probability of different magnitudes of damaging flood conditions, such as the depth of inundation, duration of inundation, velocity of moving water, quality of water, debris content of water, or the wave height in addition to still water level. For example, in many urban riverine settings, the most important flood condition is the annual maximum depth of inundation at the location of an insured structure. The depth of inundation is computed as the difference between the annual maximum water surface elevation and a reference elevation at the structure (commonly the lowest floor elevation of the structure, because this is the elevation above which water ponding will cause damage). The hazard in that location can be represented as a water surface elevation–exceedance probability function, as shown in Figure 3.1a. This function represents the probability that the annual maximum water surface elevation at a specified location will equal or exceed a specified magnitude.1 Greater water surface elevations have lesser probability of exceedance. The magnitudes for the various probabilities depend on meteorological, hydrological, hydraulic, and topographic properties of the watershed, channels, and floodplains at and upstream of the location of interest. These magnitudes can be determined for current conditions or for future conditions (e.g., extreme precipitation as a result of climate change, urban growth in floodplains).
The water surface elevation–exceedance probability function may be derived through statistical analysis of observations of annual maximum water surface eleva-
______________
1 In this report, probability is expressed as a percent chance exceedance, which is probability × 100. For example, a 10 percent annual chance exceedance event has an annual exceedance probability of 0.10.
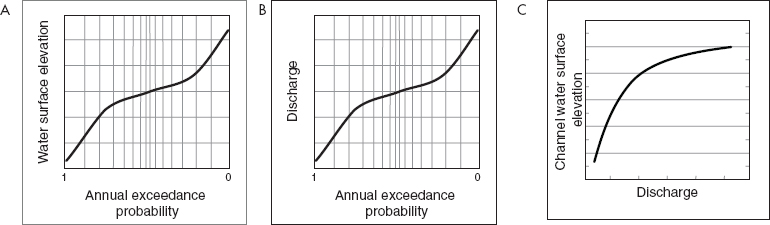
FIGURE 3.1 (a) Flood hazard for riverine systems may be represented with a water surface elevation–exceedance probability function, usually derived from flood studies. Alternatively, the function may be derived from a discharge–exceedance probability function (b), transformed with a discharge–water surface elevation function (c). The annual exceedance probability means the same thing as the annual chance of exceedance. SOURCE: Courtesy of David Ford, David Ford Consulting Engineers, Inc.
tions at a location if an appropriate sample of historical values is available from a stream gage at or near the insured structure. However, historical data are limited, and so the water surface elevation–exceedance probability function is usually derived using conceptual and empirical models of hydrologic and hydraulic processes. For riverine systems, analysts commonly develop a discharge–exceedance probability function (Figure 3.1b), then transform that with a discharge–water surface elevation function (Figure 3.1c) to derive the water surface elevation–exceedance probability function. The discharge–exceedance probability function for a stream may be developed by correcting for stream regulation then carrying out a statistical analysis of historical discharge observations or, if these data are not available, by using models of the watershed response to precipitation and channel behavior.
In floodplains with relatively uniform terrain, such as that shown in the cross section in Figure 3.2a, the water surface elevation at a structure in the floodplain is not significantly different from the water surface elevation in the channel. In such cases, a discharge–water surface elevation function (e.g., Figure 3.1c) is used to determine the channel water surface elevation, and a simple channel–floodplain water surface elevation function (e.g., Figure 3.2b), developed using an open-channel hydraulics model, is used to determine the floodplain water surface elevation.
If the terrain in the floodplain is complex—because of variable topography; flow entering and leaving the floodplain at different locations; or the presence of roadways, waterways, or impediments to flow—then inferring the floodplain water surface elevation from the channel water surface elevation may introduce significant error in the hazard description. In such cases, floodplain flow may be modeled with a two-dimensional hydraulics model. For example, the floodplain may be represented as a grid of linked cells, with the movement of water modeled from the channel to grid cells adjacent to the channel, then from cell to cell (e.g., Figure 3.3). The result is a unique water surface elevation–exceedance probability function that describes the hazard for each cell in the grid.
Assessing the Performance of Flood Protection and Damage Mitigation Measures
Flood hazard may be reduced through structural measures, such as building reservoirs, levees, or floodwalls. For example, reservoirs store water, altering the magnitude of downstream discharges, thus changing the form of the discharge–exceedance probability function (Figure 3.1b) and reducing the discharge rates for rarer events. The performance of the reservoir system during flood events is accounted for in the hazard analysis by adjusting the discharge– or water surface elevation–exceedance probability functions, although the potential for uncontrolled release of water (e.g., dam breach, gate failure) is commonly not considered.
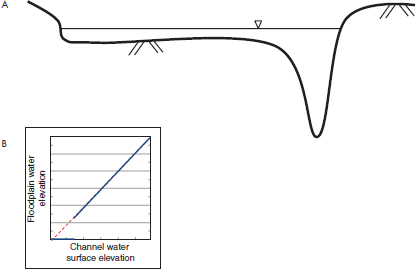
FIGURE 3.2 Water surface elevations on the floodplain adjacent to a river may be inferred from the elevation at a cross section of the river using a floodplain–channel water surface elevation function. (a) A cross section of the river and adjacent floodplain. In (b), the floodplain depth is zero until the capacity of the channel is exceeded and water moves onto the floodplain. SOURCE: Courtesy of David Ford, David Ford Consulting Engineers, Inc.
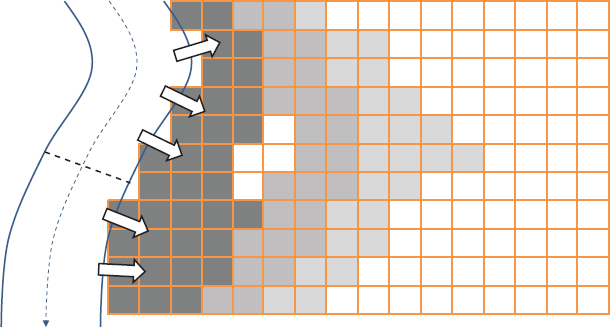
FIGURE 3.3 For complex floodplains, water surface elevations on the floodplain may be computed with a two-dimensional model. SOURCE: Courtesy of David Ford, David Ford Consulting Engineers, Inc.
A levee or floodwall constructed adjacent to a channel would also alter the relationship between the channel and the floodplain water surface elevation, and hence the floodplain water surface elevation–exceedance probability function. When the levee provides the anticipated protection, water will not inundate the floodplain and so the water depth will be zero. When the levee is overtopped by rising flood water or when it breaches as a result of structural instability, under- or through-seepage, or other factors, water will move onto the floodplain (i.e., the water depth will be greater than zero) and losses will result. This condition may be represented with a function such as Figure 3.1b, where the jump in floodplain water surface elevation coincides with levee over-topping or breaching.
To represent levee reliability (or the probability of failure of the levee to protect), a fragility function is developed to capture aleatory uncertainty (natural variability). Figure 3.4 shows the likelihood that a levee will fail to function as designed (breach), conditioned on channel water surface elevation. Similar functions can be developed to describe the likely performance of flood proofing or other local mitigation measures designed to reduce vulnerability. Fragility functions can be developed for each of the floodplain protection measures in place (e.g., levees, floodwalls, culverts, pumping stations) are included in the assessment.
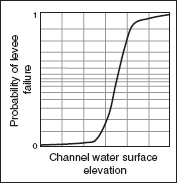
FIGURE 3.4 Variability in the performance of flood protection systems, such as levees, is represented with a fragility function, which is included in the risk assessment. SOURCE: Courtesy of David Ford, David Ford Consulting Engineers, Inc.
Assessing Exposure and Vulnerability
Exposure and vulnerability analysis examines the value of an asset and the relationship between the flood hazard and damage to the asset. This information may be represented with an inundation depth–damage function for the structure, as illustrated by Figure 3.5a. The inundation depth–damage function may be developed from a detailed valuation and investigation of the potential damage to the insured structure and/or statistical analysis of reports of damage and coincident inundation depths for similar structures. A typical approach is to determine the total value of the structure and its content; to categorize the structure according to its construction type, use, or other characteristics; and then to predict the damage corresponding to specific water depths. The damage predictor for the category is developed with a conceptual or empirical model,
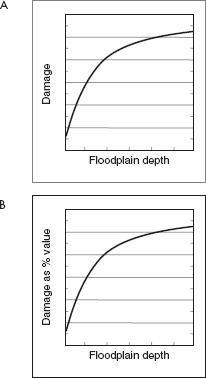
FIGURE 3.5 Exposure and vulnerability are represented with an inundation depth–damage function (a), which may be developed from a generic inundation depth–percent damage function, scaled by the total value of the asset (b). SOURCE: Courtesy of David Ford, David Ford Consulting Engineers, Inc.
and is expressed as a percentage of the total structure and content value. An inundation depth–percent damage function is illustrated in Figure 3.5b.
Assessing Risk
The consequence of flooding is assessed by transforming the water surface elevation–exceedance probability function (Figure 3.1a) with a channel–floodplain water surface elevation function (Figure 3.2b), a levee fragility function (Figure 3.4), and a floodplain inundation depth–damage function (Figure 3.5a). The result is a damage–exceedance probability function (Figure 3.6), which describes the risk. Common amounts of damage are near the center of the diagram, with probabilities near 0.50. Greater damage is less likely, with probabilities approaching zero.
The damage–exceedance probability function shown in Figure 3.6 represents the flood damage that can occur for each flood over the range of possible floods. This function can be developed for an individual structure category or for an entire portfolio of structures. The function is integrated to compute the expected annual damage for the full range of floods, also known as the average annual loss. The average annual loss is the basis for setting risk-based rates (see “NFIP Insurance Rates” in Chapter 2).
The following sections summarize risk assessment approaches used by organizations with responsibility for flood risk management or flood insurance.
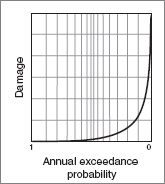
FIGURE 3.6 Flood risk is commonly represented with a damage–exceedance probability function. SOURCE: Courtesy of David Ford, David Ford Consulting Engineers, Inc.
The National Flood Insurance Program (NFIP) assesses flood risk for insurance purposes using a hydrologic method developed in the 1960s (HUD, 1966). The method derives a water surface elevation–exceedance probability function to describe the flood hazard in a geographical area, then transforms that function to an inundation damage–exceedance probability function using a model of damage as a function of depth of inundation (Box 2.1). The damage–exceedance probability function is then integrated to compute the average annual loss.
Flood Hazard Description: PELV Curves
The water surface elevation–exceedance probability function illustrated in Figure 3.1a, referred to in the NFIP hydrologic method as the PELV curve, represents the natural flood hazard as well as the performance of engineering measures designed to manage the hazard in Special Flood Hazard Areas. A PELV curve shows the relationship between annual exceedance probabilities and flood depths relative to the base flood elevation, representing implicitly all relevant meteorological, topographical, hydrologic, hydraulic, and performance conditions. Flood depths shown include stillwater and increases due to wind-driven and tidal-driven waves.
The PELV curves were derived in the early 1970s from a sample of water surface elevation–exceedance probability functions developed from detailed studies in communities nationwide. Analysts parameterized these water surface elevation–exceedance probability functions using the difference between the 1 percent annual chance exceedance elevation (100-year elevation) and the 10 percent annual chance exceedance elevation (10-year elevation) (MacFadyen, 1974). Next, the water surface elevation–exceedance probability functions were grouped, averaged, and smoothed to create 30 zones covering the range of hazard conditions. In each successively numbered A zone, the difference between the 1 percent and 10 percent annual chance exceedance water surface elevation increases, with differences ranging from 0.5 feet for Zone A1 (broad, shallow floodplains) to 20 feet for Zone A30 (narrow, steep mountainous valleys). Note that the classification
by flood zone is not spatially or geographically oriented. Rather, it focuses on common hazard properties. Different locations in the United States will fall within the same zone if they have the same difference between the 1 percent and 10 percent annual chance exceedance water surface elevations without regard to the underlying causes of the hazard.
For each zone, a PELV curve is described with a fourth order polynomial of the form:
![]()
where elev is the water surface elevation with exceedance probability p(elev), and C1, C2, C3, C4, C5 are coefficients given in FEMA (2013d). The PELV curve is used in the rate formula in Box 2.1.2 In application, NFIP analysts would determine the difference between the 1 percent and 10 percent annual chance exceedance water surface elevations for a structure from flood studies of an area, find the corresponding numbered A zone, and then derive the appropriate PELV curve with the appropriate equation for the zone.
Development and use of a nationwide set of 30 PELV curves, instead of site specific, unique water surface elevation–exceedance probability functions, allowed a workable nationwide set of rate tables to be developed. However, reviews of NFIP insurance loss experience in the early 1980s revealed inconsistencies in losses among the 30 flood zones, in part because of inherent uncertainties in the flood hazard analysis and variations in hazard conditions (e.g., a debris jam could increase local water surface elevations). At the same time, the complexity associated with determining the appropriate zone for a structure and then using that in the rate setting increased the likelihood of error by agents, who were using paper maps and rating manuals. Consequently, for rating purposes, the NFIP collapsed the 30 numbered flood zones into a smaller set of zones and weighted the resulting set in areas where NFIP policies were written (circa 1980s) for the computation of average annual loss.
Performance of Levees and Flood Storage and Diversion
The NFIP accounts for the reduction of flood hazard attributable to flood storage and diversion and to the presence of accredited levees. The impact of flood storage and diversion measures is simulated using detailed studies.3 Reductions in inundation depth that are attributable to these measures are reflected conceptually in adjustments to the base flood elevation and, through that, to the PELV curve.
The NFIP does not set standards for building levees. However, if a levee is designed, constructed, and maintained according to U.S. Army Corps of Engineers (USACE) engineering criteria, the NFIP credits the levee with eliminating inundation and corresponding damage caused by events more frequent than the 1 percent annual chance exceedance flood. Until 2013, levees that fell short of the standard were considered “non-accredited” and assumed not to reduce flood hazard. However, under the Levee Analysis and Mapping Procedure (LAMP) for non-accredited levees, the NFIP is analyzing individual sections of levees (FEMA, 2013a). Sections that meet design, construction, and maintenance standards will be credited with providing protection and eliminating damage from the 1 percent annual chance exceedance flood and more frequent events. For sections that do not meet standards, floodplain depths will be computed using models appropriate for the relevant deficiency. For example, levees with structural deficiencies are analyzed as if they will breach in multiple locations, but will provide some hazard reduction.
Exposure and Vulnerability: DELV Curves
To assess exposure and vulnerability, the NFIP employs inundation depth–percent damage functions (referred to as DELV curves), such as the one illustrated in Figure 3.7a, based upon the type of occupancy, type of construction, and location of contents in the structure. The percent damage values are converted to monetary values by multiplying by the value of the structure (ideally the replacement value) in the final step of rate setting. The depth for assessing damage
______________
2 Note that p(elev) is the same as PELV, with rounding resulting from an imperfect polynomial fit.
3 See http://www.fema.gov/guidelines-and-standards-floodrisk-analysis-and-mapping.
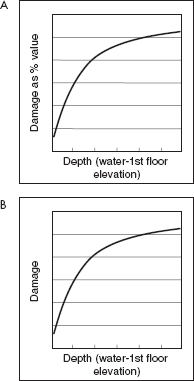
FIGURE 3.7 NFIP DELV curves predict damage as a function of depth of water relative to the lowest floor elevation of the structure. SOURCE: Courtesy of David Ford, David Ford Consulting Engineers, Inc.
is found by adjusting the inundation depth–damage function to correspond to the elevation of the structure.
Flood Risk
The NFIP expresses flood risk in terms of loss and corresponding probability. To assess risk, the DELV curve is matched with the PELV curve, which results in a damage–exceedance probability function. This damage–exceedance probability function is integrated to compute the average annual loss portion of the insurance rate (Box 2.1).
Calculations of average annual loss include the incremental contribution of losses due to the entire range of flood events, including floods less frequent than those with a 1 percent annual chance of exceedance. For the PELV curves currently used by the NFIP, the relationship between the exceedance probability and the water surface elevation is assumed to be a smooth, monotonically decreasing function.4 Extrapolating these curves to estimate water surface elevations with less than 0.2 percent annual chance exceedance (500-year flood) is considered by the NFIP to be unreliable. Consequently, when deriving the tail of the damage–exceedance probability function, the NFIP doubles the 0.2 percent annual chance exceedance depth to estimate the associated damage from the DELV curve. For example, if the PELV curve shows a 0.2 percent annual chance exceedance depth of 1.8 feet, the NFIP will assign damage corresponding to 3.6 feet of inundation for all the depths less frequent than 0.2 percent annual chance exceedance, and will include the result in the average annual loss calculation.
U.S. ARMY CORPS OF ENGINEERS METHOD
The USACE assesses flood risk following analysis procedures laid out in Engineering Manual 1110-2-1619 (USACE, 1996). Flood damage reduction analysis software (HEC-FDA) uses methods from the engineering manual with results of traditional hydrologic engineering and economic analyses to assess flood risk.5
The USACE approach is similar to the NFIP’s, but includes the results of site-specific flood hazard assessment and an evaluation of uncertainties in the assessment of flood hazard and levee fragility. The USACE method begins with deriving a discharge–exceedance probability function for a particular location using statistical analysis of available records or precipitation–runoff modeling of the contributing watershed. The function includes discharge values for a range of probabilities, commonly between 50 percent and 0.2 percent annual chance exceedance. The discharge–exceedance probability function is transformed to a water surface elevation–exceedance probability function using hydraulic model studies based on the best available bathymetric and topographic information. Applications are site specific, with hydraulic modeling methods selected as appropriate for the channel and floodplain properties. If levees or other water control features alter the hazard, then their performance is assessed, and uncertainty about their performance is represented with a fragility function.
______________
4 Personal communication by Andy Neal, FEMA, on April 28, 2014.
Vulnerability and exposure are assessed using the depreciated replacement value of assets and inundation depth–percent damage functions developed by the USACE (2000, 2003). The inundation depth–damage functions are consistent with, but not identical to, those used by the NFIP. Moreover, the NFIP uses the replacement value of the structure in its calculation of average annual loss, rather than the depreciated replacement value. The USACE estimates the depreciated replacement value by first estimating the replacement value, then reducing that value using the results of a site inspection to account for the condition and remaining useful life of the structure. The expected annual damage (average annual loss) is computed by integrating the damage–exceedance probability function.
The USACE risk analysis method considers the aleatory uncertainty in the assessment of flood hazard and levee performance, and in the estimation of water surface elevations from river discharges. Consideration is also given to selected sources of epistemic uncertainty. For example, the method uses probability distributions to describe the uncertainty about inputs, including uncertainties about (a) the discharge–exceedance probability function, (b) the discharge-to-water surface elevation transformation, (c) the lowest floor elevation of a structure, and (d) the values of assets. Monte Carlo sampling is used to develop the required damage–exceedance probability function and the uncertainty distributions. Results are reported with levels of significance attached.
Many private insurers use catastrophe models to assess the risk of natural hazards, including wind, earthquakes, wildfire, and, more recently, floods (e.g., see Grossi and Kunreuther, 2005). These models are generally developed for large or geographically diverse insurance portfolios for which it is important to assess the likelihood of catastrophic losses. The models can be used to assess individual or aggregated risk (e.g., entire insurance portfolios).
Catastrophe models developed by private companies share common modules and characteristics (see Grossi and Kunreuther (2005), although details of the different models are proprietary (Czajkowski et al., 2013). In general, catastrophe models include the risk assessment components described above: a probabilistic description of flood hazard; a probabilistic description of how hazard is modified by mitigation and management measures, including a representation of the likelihood of success or failure of the measures; and a mathematical description of exposed assets and a model of their vulnerability to the hazard. As with other risk assessment methods, catastrophe models develop a representation of the likelihood of damage over time, which is analyzed statistically to compute an average annual loss.
Unlike the NFIP hydrologic method—which transforms a PELV curve with a DELV curve to derive a damage–exceedance probability function (as illustrated in Figure 3.8a–c)—catastrophe models develop and analyze long time series of flood events (Figure 3.8d), including historical events, extremely rare but physically possible events, and future flooding scenarios that account for global environmental changes. The models then use a function that relates damage to depth or other drivers (Figure 3.8e) to estimate the loss incurred with each flood event, creating a series of damage values (Figure 3.8f). The resulting series of hypothetical floods and associated damages are analyzed to compute average annual loss and other relevant metrics of hazard and consequence.
Private insurers often collect detailed construction and occupancy information to develop loss estimates for anticipated flood events. This information can then be used to develop site-specific predictors (similar to Figure 3.8e) for use in a catastrophe model. In the absence of site-specific information, classes of risk are determined and available information used to assign the structure to a class.
Catastrophe models are developed for and fitted to conditions for the floodplain of interest, and therefore do not need to average hazard, performance, exposure, or vulnerability over time or space. Instead, site-specific detailed meteorological, hydrological, hydraulic, and consequence models can be developed and applied. For example, the loss calculations (using a function such as shown in Figure 3.8e) may include one or more drivers of damage beyond water depth, such as duration, velocity, quality of flood waters, season of flooding, or other factors.
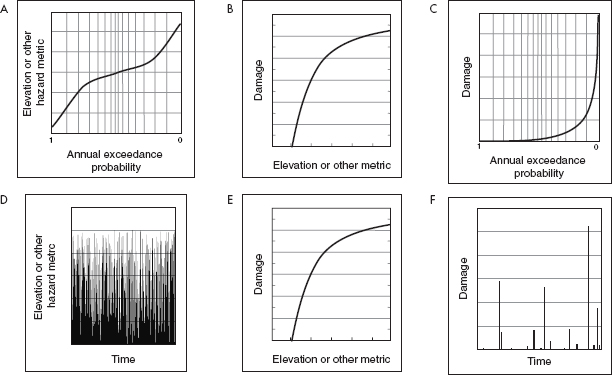
FIGURE 3.8 Comparison of the NFIP hydrologic method (a–c) with the event-based approach used in cat modeling (d–f), which creates a long history of flood events, then estimates and averages the damage associated with each to compute average annual loss. SOURCE: Courtesy of David Ford, David Ford Consulting Engineers, Inc.
REFINEMENTS TO CURRENT METHODS
North Carolina Flood Risk Information System
The North Carolina Floodplain Mapping Program is assessing certain components of flood risk as a part of a statewide program to provide seamless, accurate, statewide modeling and mapping of flood hazards.6 To assess flood hazard, North Carolina developed site-specific water surface elevation–exceedance probability functions using hydrologic and hydraulic studies carried out by the state7 and by the NFIP, and high-resolution airborne lidar terrain data. The state’s 3 meter lidar data is being replaced with quality level 2 lidar data (see Dewberry, 2011, for a description), which is similar to high precision survey data. This information has been used to determine base flood elevations for more than 300,000 locations in the state. In addition, the state has determined water surface elevations and flood depths for five flood probabilities: 10 percent (10-year depth), 4 percent (25-year depth), 2 percent (50-year depth), 1 percent (100-year depth), and 0.2 percent (500-year depth) annual chance exceedance. The 1 percent annual chance exceedance depths along a portion of a North Carolina river are illustrated in Figure 3.9. North Carolina is the first state to have performed such an analysis and to acquire high-resolution lidar statewide.
North Carolina is currently computing the annual probability of any depth of flooding for every structure in the state using information collected on building footprints (identified using remote sensing, high-resolution aerial images, and geographic information system technology) and elevations of individual structures (determined using high-resolution lidar). The exposure and vulnerability of identified struc-
______________
6 See http://fris.nc.us/fris.
7 North Carolina has generated and incorporated more than 300,000 base flood elevations on Flood Insurance Rate Maps for the state. See the presentation to the committee by John Dorman, North Carolina Floodplain Mapping Program, on May 12, 2014.
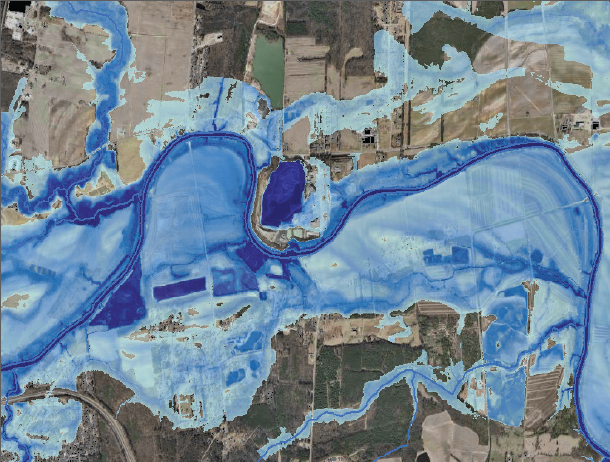
FIGURE 3.9 One percent annual chance exceedance depth grid along a reach of the Tar River in Rocky Mount, North Carolina. Darker blues represent greater flood depth between the base flood elevation and the terrain elevation. SOURCE: Courtesy of John Dorman, North Carolina Floodplain Mapping Program.
tures are quantified using tax records to establish the value and characteristics of the structures. Inundation depth–damage functions similar to the NFIP DELV curves are derived from the NFIP HAZUS software application (Scawthorn et al., 2006).8 Average annual loss is computed for individual properties in floodplains statewide, and publicly available databases and visualization tools provide easy access to these estimates, as well as to the underlying reports of hazard, exposure, vulnerability, and consequence.
NFIP Multi-Frequency Depth Grids
The NFIP has been developing multi-frequency depth grids to analyze flood risk since 2009. The multi-frequency depth grids are intended to provide a platform for NFIP hydrologic and hydraulic analyses and to help individuals better understand and visualize their flood hazard. The NFIP analyzes flood depth at the same flood probabilities as North Carolina’s (10 percent, 4 percent, 2 percent, 1 percent, and 0.2 percent annual chance exceedance), and uses similar methods for producing the depth grids (FEMA, 2014). Depths for the grids are currently determined using spatial interpolation schemes, which estimate grid cell water
____________________________
8 See also http://www.fema.gov/hazus.
The 2013 NRC report Levees and the National Flood Insurance Program: Improving Policies and Practices recommended and summarized the advantages of the NFIP moving toward a more comprehensive approach to risk analysis that builds on current USACE and catastrophe model methods. As described in the NRC report, a comprehensive risk assessment (1) derives a site-specific water surface elevation–exceedance probability function to represent hazard; (2) takes into account the performance and reliability of flood protection measured aimed at reducing inundation depths, as well as the effect that their failure may have on flooding and, ultimately, damages; (3) determines inundation depths throughout a floodplain with appropriate hydraulic analyses; (4) estimates the damage to exposed assets as a consequence of the inundation (or other relevant drivers), which is necessary for developing the damage–exceedance probability function; and (5) evaluates the aleatory and epistemic uncertainty (natural variability and knowledge uncertainty) in each of the elements of the analysis and propagates them through the estimate of risk. The elements of the flood risk model are combined to derive the frequency distribution of the flood damage for individual structures or for a community as well as the uncertainty in these estimates. From these results, the average annual loss can be computed for a structure or a group of structures. The comprehensive risk assessment method has been applied in at least two large-scale flood studies (see URS/JBA, 2008; IPET, 2009).
All four of the flood risk assessment approaches described in this chapter (NFIP hydrologic method, USACE method, catastrophe models, and comprehensive risk assessment) address the main components of risk (i.e., flood hazard, the performance of flood protection measures, exposure, and vulnerability) using methods tailored to each organization’s needs. Each of the flood risk assessment methods describes flood hazard using hydrologic and hydraulic models that represent the watershed, channel, and tidal behavior for the entire range of possible events. The NFIP hydrologic method, the USACE method, and the comprehensive risk assessment recommended in NRC (2013) use an inundation depth–exceedance probability function to describe flood hazard, whereas catastrophe models typically use Monte Carlo sampling to generate a long series of synthetic stream flows or ocean tides derived from a probability function. A critical difference among the methods is the extent to which the hazard description represents the unique conditions at a site. The NFIP PELV curves are spatial averages that do not represent unique weather, watershed, or channel features. Other methods capture those unique features.
The performance of flood protection measures is represented in all the methods, albeit in different ways. The USACE method, the comprehensive risk assessment, and catastrophe models explicitly account for uncertainty about levee performance with fragility functions. In contrast, the NFIP treats certified and accredited levees as preventing damage from floods more frequent than the 1 percent annual chance exceedance event, and treats nonaccredited levees (or levee segments) as providing lesser or no flood protection. Both the NFIP and USACE methods account for the performance of flood storage and diversion, although in a simplistic and somewhat optimistic manner. For example, both presume that reservoir water control manuals will be followed exactly; in practice such adherence is difficult.
All risk assessment methods described in this chapter model exposure and vulnerability in a similar manner. The methods predict damage as a function of inundation depth, typically using damage ratio models. All methods require estimates of the value of a structure and its contents to calculate damage, and these esti-
______________
9 Personal communication by Paul Rooney, FEMA, on May 13, 2014.
mates are made in a variety of ways. The USACE commonly uses building unit cost information and structure type and size to estimate replacement value, which is then adjusted to account for depreciation. The NFIP uses replacement cost values. Detailed information about construction and occupancy collected by private insurers can be used to develop site-specific inundation depth–damage functions for use in a catastrophe model. If this detailed information is not available, then inundation depth–damage functions are developed for classes of structures.
A significant difference among the risk assessment methods is that the NFIP method was developed to assess flood losses for individual structures, whereas the USACE, comprehensive risk assessment, and catastrophe modeling methods can assess individual or aggregated risk (e.g., a community or an entire insurance portfolio). Assessing aggregated risk is useful for determining the financial soundness of the insurance portfolio.
Another significant difference among the methods is the treatment of aleatory and epistemic uncertainties about the hazard, performance, exposure, and vulnerability inputs to flood loss calculations. Although some aleatory uncertainties are considered in the NFIP hydrologic method, epistemic uncertainties are not explicitly considered or integrated into the risk assessment. Instead, in the average annual loss calculation, the NFIP relies on judgments and empirical adjustments to accommodate uncertainties in the flood risk analyses and underwriting process (Hayes and Neal, 2011). In contrast, the comprehensive risk assessment, catastrophe models, and, to a lesser extent, the USACE method account for both aleatory and epistemic uncertainty about the various inputs to the average annual loss calculation. For example, the NFIP mathematically treats the water surface elevation–exceedance probability function as if quantiles were known with certainty. In contrast, with the comprehensive risk assessment and, to a lesser degree, the USACE method, epistemic uncertainty about the water surface elevation–exceedance probability function is described with a probability distribution about the mean value of elevation predicted for a specified probability. Similarly, the NFIP rate formula mathematically treats the inundation depth–damage functions as known with certainty, whereas the USACE method, catastrophe models, and comprehensive risk assessment consider the impact of small samples and imperfect knowledge on relationships to predict damage associated with depth. These three methods then derive sample probability distributions that describe variations from the average values predicted in the hazard, performance, exposure, and vulnerability models.
The appropriate method for assessing risk depends on the application. Possible changes in methods for improving flood insurance rates are described in Chapters 4 and 5.


