
5
Alternative Approaches and Implementation
National Flood Insurance Program (NFIP) methods for calculating risk-based premiums balance statutory requirements, actuarial principals, and practical considerations, such as feasibility, cost, and ease of implementation. Much of this balancing was based on the data and technology that were available in the early years of the program. However, expected statutory changes (i.e., a shift from subsidized to risk-based rates for negatively elevated structures) and concerns raised in program reviews (e.g., GAO, 2014) are driving a change in NFIP methods. In addition, technological advances (e.g., increased computing power; availability of lidar and web-based mapping; new techniques for providing greater spatial resolution in hazard modeling) are enabling analyses that were not practical in the early 1970s, when NFIP methods were developed. This chapter presents the committee’s primary conclusions about calculating risk-based rates for negatively elevated structures, organized around the study tasks (Box 1.1).
The first task of the committee was to review current NFIP methods for calculating risk-based premiums for negatively elevated structures, including risk analysis, flood maps, and engineering data (see Box 1.1). NFIP methods for setting risk-based rates were developed for rating post-FIRM structures (i.e., those complying with NFIP construction standards), and their use has been tailored for structures with lowest floor elevations at or above the base flood elevation.
The methods have also been applied for setting rates for about one-quarter of the negatively elevated structures in the NFIP portfolio (see “NFIP Insurance Rates” in Chapter 2).
Overall, the committee found that current NFIP methods for setting risk-based rates do not accurately and precisely describe critical hazard and vulnerability conditions that affect negatively elevated structures, including very frequent flooding, a longer duration of flooding, and a higher proportion of damage from small flood events. In addition, many NFIP methods were developed decades ago and do not take full advantage of modern technological and analysis capabilities. Specific conclusions about NFIP methods are summarized below.
The second task of the committee was to evaluate alternative approaches for calculating risk-based premiums for negatively elevated structures. The committee considered both incremental changes to current NFIP methods and different approaches, which would require research, development, and standardization; new data collection; and user training.
Incremental Changes to Current NFIP Methods
Conclusion 1. Careful representation of frequent floods in the NFIP PELV curves is important for assessing losses for negatively elevated structures. The shape of the PELV curve depends primarily on the
difference between the 1 percent and 10 percent annual chance exceedance depths. However, a significant portion of potential losses to negatively elevated structures are caused by depths exceeded more frequently than once in 10 years on average (those with a 10 percent annual chance of exceedance). A short-term step to address this problem is to use information from existing detailed flood studies to refine the PELV curves so that they define more accurately the water surface elevations for frequent floods. If a flood study developed the flow frequency information needed to determine a base flood elevation (1 percent annual chance exceedance elevation), then it could easily be expanded to determine more frequent water surface elevations. The incremental cost to extract this information from existing studies and to use it to refine the PELV curves is small compared to the cost of carrying out a new detailed flood study (typically $13,000 per mile in riverine areas and $9,300 per mile in coastal areas; see NRC, 2009).
Conclusion 2. Averaging the average annual loss over a large set of PELV curves leads to rate classes that encompass high variability in flood hazard for negatively elevated structures, and thus the premiums charged are too high for some policyholders and too low for others. An incremental change is to calculate the average annual flood loss component of the premium rate using a PELV curve that represents the flood hazard at the structure’s location, rather than basing the calculation on the 30 PELV curves that represent flood hazard nationally. Local meteorological, watershed, and floodplain properties (e.g., terrain, presence of levees) could be used to guide the selection of the appropriate PELV curve or to develop new PELV curves using longer records and modern analysis techniques. This adjustment would lead to more narrowly defined rate classes and premiums that better reflect the local flood hazard.
Conclusion 3. NFIP claims data for a given depth of flooding are highly variable, suggesting that inundation depth is not the only driver of damage to structures or that the quality of the economic damage and inundation depth reports that support the insurance claims is poor. Investigating the relationship between claims and the depth and duration of inundation is particularly important for negatively elevated structures, which are inundated by a flood longer than structures above the base flood elevation. An incremental improvement is to develop new classes of damage prediction functions that capture key damage drivers (e.g., depth and duration of inundation, flow velocity, water contamination, debris content) and use the appropriate function in the rate calculation. Research and new data collection would be required to determine which drivers for estimating flood damage are important. The incremental costs for collecting additional data on structure characteristics is likely to be low, and the cost for carrying out the research is likely to be moderate. The contribution of data quality to the variability in claims data is discussed below (see “Supporting Data”).
Conclusion 4. When the sample of claims data is small, the NFIP credibility weighting scheme assumes that U.S. Army Corps of Engineers (USACE) damage estimates are better than NFIP claims data, which has not been proven. With almost 50 years of NFIP claims data, it may no longer be necessary to incorporate USACE damage models of unknown origin and quality into NFIP damage estimates. Instead, the NFIP could rely on improved damage models (see Conclusion 3) and its own and other flood damage reports (including damage reports from USACE, the National Weather Service, and state and local agencies involved in post-flood damage assessments) to adjust the DELV curves annually. This approach would take advantage of better models, a larger dataset, and multiple sources of damage data, which would provide an independent check on NFIP data quality. Smaller improvements could be made by determining the quality of the USACE data—a difficult task given the lack of documentation—and revising the NFIP credibility scheme to weigh the two datasets appropriately.
Conclusion 5. Levees may reduce the flood risk for negatively elevated structures, even if they do not meet NFIP standards for protection against the 1 percent annual chance exceedance flood. An incremental step is to modify the Levee Analysis and Mapping Procedure (LAMP) to assess the ability of nonaccredited levees to prevent inundation of negatively elevated structures by events more frequent than the 1 percent annual chance exceedance flood. LAMP implementation has only recently begun, and so the
cost of application is uncertain. Much of the effort focuses on developing and calibrating models that can be used for floods with various exceedance probabilities. The effort to modify the procedure and use the results in the average annual loss calculation is likely to be moderate. The procedure is already being applied for the 1 percent annual chance exceedance flood, and so the incremental cost to apply it for more frequent events will likely be low. However, the cost to collect the data necessary to assess the levee performance and reduction of flood risk may be high, especially for levees that have never been certified.
Conclusion 6. When risk-based rates for negatively elevated structures are implemented, premiums are likely to be higher than they are today, creating perverse incentives for policyholders to purchase too little or no insurance. As a result, the concept of recovering loss through pooling premiums breaks down, and the NFIP may not collect enough premiums to cover losses and underinsured policyholders may have inadequate financial protection. A short term solution for discouraging the deliberate purchase of too little insurance, and to fairly compensate for it, is to tie the underinsurance adjustment to the ratio of the amount of insurance purchased to the replacement cost value of the structure, as is currently done for structures in the VE zone. Alternatively, the NFIP could reduce loss payments or impose other penalties for severely underinsured structures, although public policy issues may also have to considered. The cost to implement these changes will likely be low.
Conclusion 7. Adjustments in deductible discounts could help reduce the high risk-based premiums expected for negatively elevated structures. Premium discounts are currently based on the dollar amount of the deductible chosen and whether the structure is pre- or post-FIRM. However, more refined PELV curves and more accurate replacement cost information in rating policies can be used to structure deductible discounts that are more appropriate to individual expected annual losses. Minimum deductibles could also be increased, which would reduce premiums as well as NFIP expected claims payouts overall. The costs to implement these changes are likely to be low.
New Approach: A Comprehensive Risk Assessment
Conclusion 8. Modern technologies, including analysis tools and improved data collection and management capabilities, enable the development and use of comprehensive risk assessment methods, which could improve NFIP estimates of flood loss. A comprehensive risk assessment would describe risk over the entire range of flood hazard conditions and flood events, including the large, infrequent floods that cause substantial losses to the NFIP portfolio, and the smaller, frequent floods that make up a significant portion of loss to negatively elevated structures. It would also describe the various levels of protection offered by all elements of a flood protection system (e.g., reservoirs, levees, floodwalls, diversions and bypasses, channels, warning systems) and mitigation measures (e.g., elevating structures) through the entire range of flood events. Finally, a comprehensive risk assessment would account explicitly for uncertainty and changing conditions. Epistemic and aleatory uncertainties are accounted for through the risk analysis, including uncertainty about current and future flood hazard; structure value, vulnerability, and elevation; and current and future performance of flood protection measures. The results of a comprehensive risk assessment would improve the accuracy, precision, and robustness of flood loss estimates. It would also provide additional information to support management of the NFIP portfolio.
The NFIP already has taken some steps toward a comprehensive risk assessment (e.g., by developing multi-frequency depth grids). In addition, the NFIP is collaborating with the USACE to align methods. For example, a joint USACE–Federal Emergency Management Agency (FEMA) task force recommended the following for the NFIP (USACE and FEMA, 2013, p. 14):
Eliminate the concept of levee system accreditation and instead implement a risk-informed suite of NFIP actions. This involves a more holistic change within the NFIP from a single “in or out” boundary of 1 percent annual chance exceedance for insurance and floodplain management to graduated zones that reflect risk, including consequences. This could include insurance premiums scaled for each parcel/risk zone, whether leveed or not, and implementation of risk-informed floodplain management requirements scaled to the risk zones.
Key steps in implementing a comprehensive risk assessment include the following:
- Develop or adapt a framework and software for the analysis. The software would have to integrate descriptions of hazard, exposure, vulnerability, performance, and uncertainty about those components to compute the distribution of flood losses and the average annual loss and to assess risk for individual structures, communities, or the entire portfolio of insured structures. The procedures and software would have to be consistent and applicable for a broad user base. Developing the software and procedures, training users, and shifting operations from the current hydrologic method to a comprehensive risk assessment would likely be expensive. However, taking advantage of existing procedures and software tools developed by the USACE (USACE, 1996),1 the NFIP,2 or other government agencies and private companies involved in floodplain management could yield significant cost savings.
- Describe flood hazard for every structure by modeling watershed, channel, tidal, and riverine and coastal floodplain characteristics at fine spatial resolution. This description would replace the hazard information currently provided by the PELV curves. The NFIP’s multi-frequency depth grids, which use available hydrologic and hydraulic analysis to describe site-specific flood hazard, are a step in this direction. In certain cases, information from existing flood studies completed by the NFIP, the USACE, or other agencies is adequate for this purpose. In other cases, new studies will have to be completed to define the water surface elevation–exceedance probability functions. Modeling costs will be consistent with those incurred by the NFIP today, although additional model applications will have to be developed to compute inundation depths for the full range of flood frequencies. Where the terrain and hydraulics are complex, multi-dimensional hydraulic models will have to be developed to capture the water movement. These come at a greater cost. However, the capabilities of readily available, commonly used software—notably HEC-RAS—are expanding, permitting multidimensional modeling to be carried out cheaper and faster than before (Brunner, 2014).
- Describe quantitatively the uncertainty about all of the components of the flood risk analysis. For example, it will be important to describe the distribution about the mean 50, 10, 1, and 0.2 percent annual chance exceedance inundation depths. This distribution will depend on how the inundation depth–exceedance probability function is defined, including the size of the historical sample used to fit the probability model. Integrating uncertainty analysis into the rate calculation would add costs, because it imposes two new requirements on the NFIP: (1) the development of probability distributions of key inputs and (2) numerous repetitions of calculations. For some inputs, the probability distributions could be estimated with little additional effort. For example, information about the distribution of damage incurred for a given inundation depth is currently reported and could be used to derive the distribution about the mean damage. Estimating uncertainty about other inputs would require more effort. In addition, training in methods for describing uncertainty of the various flood risk components will likely be required.
- Determine the elevation, replacement value, and relevant characteristics of insured structures. Structure elevation data are needed to develop a predictor of potential damage to the structure for all inundation depths. Replacement values are needed to identify the maximum potential damage and to develop more realistic damage models. Relevant structure characteristics need to be determined so that a proper predictor of damage can be used when structures are grouped for damage assessment. Low cost methods for obtaining structure elevation, replacement values, and structure characteristics are discussed below.
- Describe the performance of levees and other flood protection measures with probabilistic
_______________________
models, which are not typically used in NFIP analyses. Developing these models is likely to be one of the more expensive elements of a comprehensive risk analysis framework. Some of the required input has been developed by the USACE, but the analysis would go further by capturing the system-wide performance of all elements of a flood protection system. In addition, the NFIP technical investigations and analyses for levee certification are similar to those that would be required to develop fragility functions for each flood protection measure. New standards for these analyses and models would have to be developed and promulgated to ensure they are applied consistently.
The greatest improvements in precision and accuracy and the fewest integration problems are likely if NFIP takes all steps, making the holistic change recommended by the USACE–FEMA interagency task force. However, these steps could be implemented independently, with some attention to their eventual inclusion in a comprehensive risk assessment.
The third and fourth tasks of the committee concern data. Task 3 was to discuss engineering, hydrologic, and property assessment data needed for implementing risk-based premiums for negatively elevated structures, and Task 4 was to discuss approaches for keeping these data updated. The discussion below focuses on near-term data issues, which have been documented or seem likely to arise.
Data Collection
Conclusion 9. Risk-based rating for negatively elevated structures requires, at a minimum, structure elevation data, water surface elevations for frequent flood events, and new information on structure characteristics to support the assessment of structure damage and flood risk. Water surface elevation data can be extracted from existing flood studies (see Conclusion 2). Data on structure elevation and characteristics will have to be collected.
Structure Elevation. Structure elevations have not been determined for approximately three-quarters of the structures in the NFIP thought to be negatively elevated. The NFIP requires an Elevation Certificate for risk-based rating (FEMA, 2004). An Elevation Certificate records the elevation of the lowest floor of a structure and also includes information on the property, the Flood Insurance Rate Map for the community, and photographs and comments describing the building. Figure 5.1 shows an Elevation Certificate for a negatively elevated structure in Isleton, California. For this structure, the base flood elevation is 9 feet (item B9), and the top of bottom floor and the lowest adjacent grade are far below that (item C2).
For a given rate class, the lower the elevation of the structure, the higher the premium, with large premium increases every foot below the base flood elevation (e.g., see Table 2.2). Consequently, it is important to obtain accurate estimates of structure elevations, particularly for negatively elevated structures. Errors in the structure elevation used for risk-based rating can result in policyholders paying too much or too little for flood insurance. A Dewberry (2005) study found a significant number of errors in Elevation Certificates. For example, in Pinellas County, Florida, 12.5 percent of 1,524 certificates had either no lowest floor elevation or grossly erroneous elevations. Detecting and correcting errors and omissions in the forms is the responsibility of the communities that maintain the Elevation Certificates (FEMA, 2004). In practice, however, it is difficult for a community to confirm whether the information on an Elevation Certificate is accurate, and so audits tend to focus on whether the blanks are filled in. This raises important questions about the quality of the existing certificates.
An Elevation Certificate prepared by a licensed surveyor or engineer generally costs $500 to $1,000, and the cost is usually borne by policyholders. Substantial cost savings are possible if large groups of structures (e.g., a neighborhood) are surveyed with common land surveying methods. Obtaining commercial data may also be cost effective. In addition, new technologies have the potential to estimate structure elevation at a much lower cost. For example, vehicle-mounted lidar is being used in North Carolina to acquire highest adjacent grade elevations for approximately $25 per
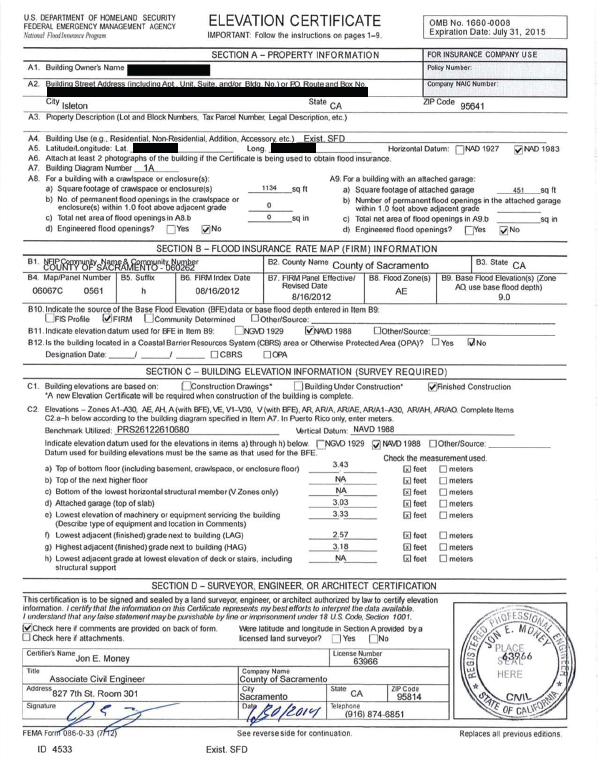
FIGURE 5.1 Example of an Elevation Certificate, with identifying features redacted, for a negatively elevated house built in 1970 in Isleton, California. SOURCE: Courtesy of George Booth, Senior Civil Engineer, Sacramento County, California.
structure.3 However, some work would have to be done to determine the extent to which these highest adjacent grade elevations can be translated to lowest floor elevations. For example, a Dewberry (2005) report found that lidar measurements would have to be supplemented with on-site precise survey measurements. Cross-checking structure elevations from vehicle-mounted lidar and from Elevation Certificates may offer a means of validating both measurements.
Structure elevations (and in some cases, flood studies) have to be updated following a major flood event or the accumulation of enough vertical land motion (e.g., uplift from tectonics, subsidence from sediment compaction or extraction of water or hydrocarbons) to change the rate class. These updates will maintain the accuracy of the flood hazard assessments. Vertical land motion is significant in some parts of the country. For example, the coasts of Oregon and Washington are rising about 1.5–3.0 mm per year due to tectonics, and parts of the Los Angeles Basin have risen or dropped by more than 10 mm per year due to hydrocarbon and groundwater withdrawal and faulting (NRC, 2012).
Structure Characteristics. Information on structure characteristics is used to understand the exposure and vulnerability of structures to damage from flooding. The NFIP collects some information on structures, including the construction characteristics (e.g., presence of a basement), the number of floors, and the type of supporting foundation. However, additional information would have to be collected to support the development and use of improved damage prediction models that consider flood duration, which is likely important for negatively elevated structures, as well as other possible drivers of flood damage. New data needs include the characteristics and usage of basements, the properties of the foundation, the type of structure or architecture, the type of interior and exterior finishes (e.g., brick vs. siding; wood vs. vinyl floors), and the quality of construction. These data would likely need to be updated only after a major renovation. The incremental cost for collecting additional data on structure characteristics is likely to be low.
Data Quality and Consistency
Conclusion 10. The lack of uniformity and control over the methods used to determine structure replacement cost values and the insufficient quality control of NFIP claims data undermine the accuracy of NFIP flood loss estimates and premium adjustments.
Replacement Cost. The NFIP obtains replacement cost data from insurance companies and agents, who use their own methods to estimate replacement cost (e.g., property sales data, construction costs, maximum amount of insurance coverage). Consequently, replacement cost estimates are often inconsistent. Replacement cost values could potentially be improved by (1) requiring all insurance companies and agents to use a single cost estimation method or (2) purchasing replacement cost data from commercial databases that use consistent methods to estimate replacement costs. A single method for estimating replacement costs, either developed or endorsed by the NFIP, would yield more consistent results and also be less liable to manipulation. The cost of obtaining more accurate estimates of replacement values from insurance companies need not exceed the current cost. An alternative is to purchase commercially available property replacement values estimated from regional and local property sales data, construction cost data, and other proprietary information, as is commonly done in the private insurance industry. Replacement cost estimates provided to this committee by two commercial data providers are in the range of $0.40 to $0.60 per property for the NFIP portfolio (about $2.5 million for all NFIP policies). Having multiple sources of replacement cost data would also enable the NFIP to assess the quality of replacement cost data and to choose which is best for rating purposes.
The value of a structure will change following a disaster (e.g., flood, fire, earthquake), structural modification, or socioeconomic factors (e.g., regional economic trends). Replacement cost data for affected properties could be purchased following these triggers. Increases in construction costs due to local demand surge in a post-disaster environment could be predicted with engineering and economic indices.
NFIP Claims Data. The variability in NFIP claims data for a given depth of inundation may partly reflect
______________
3 Presentation to the committee by John Dorman, Program Director, North Carolina Floodplain Mapping Program, on May 12, 2014.
the inconsistent replacement cost data discussed above or the quality of damage reports. For example, the units for reporting inundation depths are not always specified consistently (e.g., 2 feet versus 2 inches), creating considerable uncertainty.4 In addition, basic data that are used to estimate flood damages (e.g., base flood elevation, depth of flooding, losses above the amount of flood insurance carried) are not always accurate or complete (Galloway et al., 2006; GAO, 2008). While data needed for later analysis can be cleaned up by adjusting for what appear to be erroneous values or outliers, ongoing efforts to improve quality at the point of data collection are important to the NFIP ratemaking method.
Data quality could be improved by implementing a more thorough quality control and review process. A focused sampling of historical loss claims could reveal where data quality has compromised rate setting. For example, verifying historical inundation depths (e.g., by using stream gage data) and analyzing spatial statistics on a sample of structure elevations could show the extent to which unreported units of inundation depth are a problem. In addition, systemic changes in the manner data are collected and reported could improve data quality. For example, damage report forms could be revised to specify that inundation depths are reported in inches. Other changes could include more stringent requirements and standardized procedures for Write Your Own companies and contractors involved in NFIP insurance operations as well as targeted efforts in the ongoing operational reviews of those entities.
FEASIBILITY, IMPLEMENTATION, AND COST
The fifth task of the committee was to discuss feasibility, implementation, and cost of underwriting risk-based premiums for negatively elevated structures, including a comparison of factors used to set risk-based premiums. A detailed assessment of implementation options was beyond the capability of the committee because it requires detailed information on NFIP operations, costs, and plans, as well as the knowledge and experience of NFIP analysts. Consequently, the committee used its judgment, gained through experience with similar risk assessments, to discuss issues of timing, costs, and level of effort associated with adjusting NFIP methods. These issues are discussed below and summarized in Table 5.1.
Feasibility
Many of the analysis approaches identified by the committee are already being carried out by other organizations, and so should be feasible for the NFIP to implement. For example, the USACE analyzes risk on a site-specific basis for its planning studies, developing water surface elevation–exceedance probability functions and computing average annual loss for individual structures or groups of structures. This approach demonstrates that site-specific precision for risk analysis is feasible. The performance of levees in reducing flood risk has been described using probabilistic models by the USACE and others (URS/JBA, 2008; IPET, 2009). This approach was recommended by the USACE–FEMA task force and was expected to have a cost comparable to the cost of NFIP levee accreditation (USACE and FEMA, 2013). Modeling and analysis of site-specific information and future flood scenarios are already used in the private flood insurance market (see “Catastrophe Models” in Chapter 3), demonstrating that more refined rating models are feasible. Finally, the state of North Carolina has demonstrated that lidar mounted on vehicles can be used to determine individual structure elevations on a large scale and at low cost. It has also shown that a digital environment that displays information on flood hazard, structure vulnerability, and flood risk management options for individual structures can be created at relatively low cost ($3,000–$12,000 per county in North Carolina).5
Cost
As discussed above and summarized in Table 5.1, incremental changes to current NFIP methods can be accomplished at low or moderate cost. Implementing new approaches, such as those included in a comprehensive risk assessment, will carry higher costs. However, the use of relevant information, models, and analysis methods developed by other government agen
______________
4 Personal communication from Andy Neal, FEMA, on July 7, 2014.
5 Presentation to the committee by John Dorman, North Carolina Floodplain Mapping Program, on May 12, 2014.
TABLE 5.1 Summary of Potential Changes to NFIP Methods
| Rate Component | Current NFIP Method | Incremental Changes to NFIP Methods | Shift to a Comprehensive Risk Assessment | ||||||||
| Change | Level of Efforta | Data Needs | Change | Level of Efforta | Data Needs | ||||||
| Hazard | Described with PELV curves, which are fitted to a location using an estimate of the 1 percent annual chance exceedance depth. The rate setting process averages over PELV curves, and so the hazard description is not specific to the site | Use a water surface elevation–exceedance probability function that represents the hazard at the structure using information from existing flood studies. Select from existing PELV curves or create new categories of functions for various topographic, hydrologic, and hydraulic conditions | MEDIUM effort to extract data from existing flood studies and to analyze the flood frequency information to develop the categories LOW increase in effort once the categories have been identified | Estimates of water surface elevations more frequent than the 1 percent annual chance exceedance elevation to refine the development of PELV curves Meteorological, watershed, and floodplain properties to establish categories of water surface elevation–exceedance probability functions | Develop site-specific water surface elevation–exceedance probability functions | HIGH effort to overhaul assessment | Data for a complete hydrologic and hydraulic analysis, including watershed properties to estimate runoff, channel geometry to estimate water surface elevation in the channel, and floodplain geometry to estimate water surface elevation at structures | ||||
| Vulnerability | Use a DELV curve for the structure type to predict the damage ratio as a function of depth of inundation. DELV curves are developed from NFIP data and USACE historical analyses. Structure elevations are determined using ground surveys | Continue using DELV curves, but review methods for averaging NFIP and USACE loss and damage information Investigate causes of great variability in damage, including other drivers, and expand damage predictors if appropriate Require property owners to obtain Elevation Certificates Investigate using commercial sources of structure elevation data Investigate using vehicle-mounted lidar to estimate lowest floor elevation | LOW effort to review and enhance the credibility weighting scheme MEDIUM effort to investigate additional damage drivers LOW effort to investigate commercial data on structure elevation HIGH effort to use lidar to estimate structure elevations | Historical damage data and information on floods and identified damage drivers Provenance of USACE inundation depth–damage functions if credibility weighting scheme is to be enhanced Data from vehicle-mounted lidar to validate or replace Elevation Certificates | Make use of enhanced post-flood damage reporting to develop dataset and establish inundation depth damage functions independent of th USACE damage models Use a larger set o damage predictor to capture the relevant drivers o damage Investigate using vehicle-mounted lidar to estimate lowest floor elevation | HIGH effort to incorporate additional damage drivers into the analysis – LOW effort to investigate e commercial data on structure elevation HIGH effort s to use lidar to estimate structure elevations | Historical damage data and information on floods and identified damage drivers Data from vehicle-mounted lidar to validate or replace Elevation Certificates | ||||
| Exposure | Use structure replacement values reported by insurance agents | Obtain consistent structure replacement values by setting standards for insurance companies or purchasing commercial data | LOW effort to obtain accurate structure replacement values | Accurate and consistent structure replacement values | Same as incremental change | Same as incremental change | Same as incremental change | ||||
| Performance | Credit levees and other flood protection measures with reducing risk from the 1 percent annual chance exceedance and more frequent events if the levee meets NFIP standards; ignore other levees in the risk analysis. Enhancements are proceeding under LAMP | Credit levees with providing full or partial protection, as determined with expanded application of LAMP for events more frequent than 1 percent annual chance exceedance | LOW effort to collect additional data on the performance of certified levees; HIGH effort to collect data on levees that have not been certified MEDIUM effort to adjust the LAMP analysis procedure and the average annual loss calculation to account for risk reduction attributable to nonaccredited levees | Additional information on levee performance for events more frequent and less frequent than the 1 percent annual chance exceedance flood | Use fragility functions to describe the performance of and uncertainty of all flood protection measures, attributing risk reduction as appropriate | HIGH effort to develop fragility functions for all flood protection measures affecting insured properties HIGH effort to adjust risk analysis procedures to include those fragility functions | Additional information on the performance of flood protection measures, including results of geotechnical engineering explorations and analyses | ||||
| Underinsurance | Compensate for underinsurance using a loading factor to adjust rate so the collective premiums reflect the expected annual loss | Apply the treatment of underinsurance used for VE zone structures to all structures in portfolio Impose penalties (e.g., reduce loss payments) if the insured value is too low at the time of loss | LOW effort to make administrative changes | Accurate and consistent structure replacement values | Same as incremental change | Same as incremental change | Same as incremental change | ||||
| Deductibles | Minimum and maximum deductibles are offered for structures and contents | Increase the minimum deductible Account for differences in flood risk and structure values when calculating premium discounts Express deductibles as a percentage of the insured value, rather than fixed value | LOW effort to make administrative changes | None | Same as incremental change | Same as incremental change | Same as incremental change | ||||
a A low level of effort means that existing resources can be reapplied to make the change (e.g., a few person months). Medium effort means that existing resources plus some additional resources would be required to make the change (e.g., a few person years). High effort means that substantial new resources would be required to make the change (e.g., a person decade).
cies would speed the work and stretch NFIP resources. For example, the USACE collects data on structure elevations, types, and replacement values in floodprone areas, and derives hazard and performance information for its planning studies. Similarly, California has collected information on flood hazard, performance, exposure, and vulnerability in the Central Valley.6 Obtaining such information would enable the NFIP to move to a comprehensive risk analysis in some areas without incurring all costs associated with developing new models and gathering new data. Easy access to flood risk databases, such as those maintained by North Carolina, could also reduce costs for insurance companies and agents that write NFIP policies by reducing the need to collect information or interpret map data in some areas.
Implementation
This report identifies a menu of possible changes to NFIP methods, ranging from simple to complex. Ultimately, the NFIP needs methods that rest on a firm scientific and technical foundation, which is important for setting rates that are credible, fair, and transparent. Changes to the water surface elevation–exceedance probability functions and to the flood damage functions would strengthen the scientific and technical foundation for setting risk-based rates for negatively elevated structures. If immediate changes must be made (e.g., a congressionally mandated end to subsidies and shift to risk-based rates), then the NFIP could implement the incremental changes to PELV, DELV, and levee performance. Otherwise, taking the time and effort to implement a comprehensive risk analysis methodology and to develop site-specific flood hazard descriptions, models that predict damage from multiple drivers, and probabilistic models that describe the performance of risk reduction measures would yield a better assessment of flood losses, and thereby provide a firmer foundation for rate setting.
The challenge for the NFIP is to determine how to integrate the components of a comprehensive risk analysis into the rate-setting process. Although it is feasible to estimate the average annual loss for each structure, it may not be practical for a national insurance program to administer a program with potentially millions of structure-specific rates. For example, premium rates may vary by only a few cents per $1,000 among similar structures in a neighborhood, because of slight differences in the water surface elevation–exceedance probability functions. The accuracy achieved with these rates would not be worth the administrative burden. However, flood losses calculated for individual structures could be used to inform the assignment of those structures to rate classes.
Similarly, some evaluation will be required to balance the higher costs of data analysis and training against the benefits of a thorough uncertainty analysis. These benefits include a more reliable estimate of the expected loss, including losses from low-probability high-consequence events such as hurricanes Katrina and Sandy, and a clear statement of the limitations of the underlying analysis. In addition, the analysis would identify areas of high uncertainty, and thus where enhanced data collection or refinements to the rate model would be most productive. For example, if uncertainty analysis demonstrates that rates are most sensitive to variations about mean inundation depth, then the NFIP may choose not to invest in expanding the current depth–damage predictors to include flood duration, velocity, or other damage drivers.
______________


