
4
Factors That Affect Risk-Based Premiums for Negatively Elevated Structures
The National Flood Insurance Program (NFIP) method for calculating risk-based premiums was developed for rating post-FIRM (Flood Insurance Rate Map) structures, and its use has been tailored for structures with lowest floor elevations at or above the base flood elevation. However, negatively elevated structures are typically affected by different flood conditions (e.g., more frequent floods) and different drivers of damage and loss (e.g., longer duration of flooding) than structures above the base flood elevation. Moreover, risk-based insurance premiums for negatively elevated structures are expected to be high when subsidies are phased out, simply because flood risks are higher. This chapter identifies potential changes to the NFIP method for calculating risk-based rates for negatively elevated structures. Of particular interest are the water surface elevation–exceedance probability functions (PELV curves), the inundation depth–damage functions (DELV curves), underinsurance, and deductibles. Associated data issues are discussed in Chapter 5.
The NFIP develops rates for a class of structures by computing the average annual loss, accounting for the elevation of the structure relative to the base flood elevation, and then adjusting that value for expenses and other factors. Rates are computed by integrating the product of the DELV curve for a class of structures and each PELV curve to compute an average annual loss, and then averaging the computed losses over the set of PELV curves, weighted by the estimated
fraction of structures in each PELV zone equivalent. This averaging step can result in premiums that are representative of the flood risk for the structure class as a whole, but not for individual structures within the class. In addition, the PELV curves were developed with a focus on the difference between the 1 percent and 10 percent annual chance exceedance elevations and may not adequately capture the loss potential from frequent flooding, which can be significant for negatively elevated structures. These issues and possible changes to the NFIP method are described below.
Averaging in the Rate Calculation
Averaging the average annual loss over a large set of PELV curves in the rate calculation affects premiums because it obscures variations in the water surface elevation–exceedance probability functions. This means that the magnitude of flood hazard will be overestimated (and premiums will be too high) in some areas and underestimated in others (and premiums will be too low), and thus to rate classes with excessive variance in premiums.
Variation in Flood Hazard. The PELV curves were derived to represent the wide variety of coastal and riverine flood hazard conditions that exist across the United States. The family of PELV curves range from those with a large water surface elevation difference between rarely exceeded and frequently exceeded flood events to those with small water surface elevation differences. The need for this differentiation of hazard is illustrated
in Table 4.1, which shows the difference between water surface elevations for a rarer event (1 percent annual chance of exceedance) and a frequently exceeded event (10 percent annual chance of exceedance) relative to the base flood elevation at three locations. The water surface elevation difference is 13.9 feet for Fayette County, Texas; 6.7 feet for Boulder County, Colorado; and 2.1 feet for Suffolk County, New York (Table 4.1). These differences in water surface elevations reflect differences in the meteorological, hydrological, and hydraulic properties of the watersheds and floodplains. If the insurance rate for an identical structure were computed then averaged for these three cases, then that rate would not represent well the risk for any one of the cases.
As discussed below, negatively elevated structures are inundated by more frequent events than structures above the base flood elevation (see “Capturing the Loss Potential from Very Frequent Flooding”), and the depths of inundation for more rare events may be considerable. Those flood hazard conditions are obscured in the averaging, leading to rates that are correct in aggregate, but incorrect for individual cases.
Premium Variance Within Rate Classes. Homogeneity of the insured properties within a rate class is desirable for calculating rates that are both precise and fair to the policyholders (Mathewson et al., 2011). Rate classes for negatively elevated structures appear to be heterogeneous, largely as a result of averaging the insurance rates produced from a wide range of PELV curves. Table 4.2 shows how premiums for a specific set of structural parameters vary for the different PELV curves. When the rate is averaged from the appropriate set of PELV curves in the average annual loss calculation, the variance around that average premium can be large. This means that while the rate (and resulting premium) computed may be appropriate as an average for all policyholders in a class ($9,142 in Table 4.2), rates may be far too high for some structures and far too low for others. For example, if insurance was priced differently for each of the 30 A zone equivalents, then a policyholder in Zone A30 would be charged only $4,228 in the Table 4.2 example. But because the 30 numbered A zones have been consolidated into a single AE zone, the rate represents an average across all 30 A zones, and the policyholder pays more than double that amount—$9,142. Although rate classes for positively elevated structures are also heterogeneous, the dollar amounts and, hence, the absolute magnitudes of the differences are much larger for negatively elevated structures.
Another issue is that computed rates for negatively elevated structures generally increase as the difference between the 1 percent and 10 percent annual chance exceedance depths decrease (PELV numbers decrease; see Table 4.2). The opposite is true for positively elevated structures. As discussed below, this trend can be attributed to the large contributions from more frequent floods to the total flood risk for negatively elevated structures, and thus there is great sensitivity to PELV values associated with floods of high annual probabilities (10 percent or greater annual chance exceedance).
Potential Changes to the NFIP Method. Representing flood hazard variation more precisely and accurately in the average annual loss computation would reduce inequities that result when all policyholders with the same structure type and elevation pay a rate averaged over hazard conditions. Precise hazard representation requires structure elevations and site-specific water surface elevation–exceedance probability functions devel-
TABLE 4.1 Comparison of Water Surface Elevation Differences in Different Regions
| Percent Chance Exceedance | Difference Between the 1 Percent and 10 Percent Annual Chance Exceedance Water Surface Elevations (feet) | ||
| Fayette County, TX | Boulder County, CO | Suffolk County, NY | |
| 0.2 | 4.3 | 3.4 | 1.7 |
| 1 | 0.0 | 0.0 | 0.0 |
| 2 | –4.6 | –2.5 | –0.6 |
| 10 | –13.9 | –6.7 | –2.1 |
SOURCES: Data from Flood Insurance Studies; see FEMA (2006, 2009, and 2012).
TABLE 4.2 Influence of PELV Curves on the Insurance Premium for a Structure With the Lowest Floor Elevation 4 Feet Below the Base Flood Elevation
| PELV | Zone Equivalent | Zone Weight |
Zone Premium |
| 25 | A1 | 1% | $11,267.88 |
| 26 | A2 | 1% | $11,267.88 |
| 27 | A3 | 1% | $11,267.88 |
| 28 | A4 | 3% | $11,267.88 |
| 29 | A5 | 6% | $11,267.88 |
| 30 | A6 | 8% | $11,267.88 |
| 31 | A7 | 10% | $11,267.88 |
| 32 | A8 | 11% | $11,911.69 |
| 33 | A9 | 11% | $10,040.57 |
| 34 | A10 | 11% | $8,561.74 |
| 35 | A11 | 10% | $7,925.78 |
| 36 | A12 | 9% | $7,101.71 |
| 37 | A13 | 7% | $6,694.55 |
| 38 | A14 | 6% | $6,299.23 |
| 39 | A15 | 4% | $5,881.52 |
| 40 | A16 | 3% | $5,544.08 |
| 41 | A17 | 2% | $5,274.60 |
| 42 | A18 | 1% | $5,151.74 |
| 43 | A19 | 0% | $4,948.63 |
| 44 | A20 | 0% | $4,853.87 |
| 46 | A21 | 0% | $4,774.61 |
| 48 | A22 | 0% | $4,691.30 |
| 50 | A23 | 0% | $4,557.16 |
| 52 | A24 | 0% | $4,462.78 |
| 54 | A25 | 0% | $4,442.11 |
| 56 | A26 | 0% | $4,382.93 |
| 58 | A27 | 0% | $4,338.98 |
| 60 | A28 | 0% | $4,254.83 |
| 62 | A29 | 0% | $4,252.54 |
| 64 | A30 | 0% | $4,228.72 |
| Weighted Average | $9,142.03 | ||
a Weights are rounded.
NOTE: This example is for a one-story 1–4 family residential building with no basement and $250,000 of coverage on the structure.
SOURCE: Andy Neal, Federal Emergency Management Agency (FEMA).
oped from detailed flood studies. In some cases, local flood study reports may yield the required water surface elevation–exceedance probability functions. For example, the site-specific water surface elevation–exceedance probability functions developed and used by the U.S. Army Corps of Engineers (USACE) for planning studies and by North Carolina for risk communication define flood hazard with the necessary precision. The NFIP’s multi-frequency depth grids represent a step toward site-specific hazard definition.
If deriving and using site-specific water surface elevation–exceedance probability functions is not practical, then the NFIP could group and average the functions to capture important differences in flood hazard conditions, and use the average function that best represents the hazard at a structure. This strategy
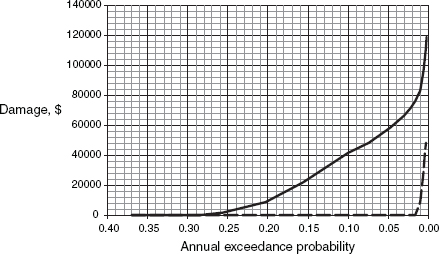
FIGURE 4.1 Illustration of a damage–exceedance probability function for the same structure at two elevations. (Solid line) Lowest floor elevation 4 feet below the base flood elevation (negatively elevated structure). (Dashed line) Lowest floor elevation equal to the base flood elevation.
is similar to the NFIP’s now abandoned strategy of using numbered A zones (or V zones) for rate setting. Research, guided by the extent of the variance in premiums within rate classes, would be required to determine how many categories of water surface elevation–exceedance probability functions would be needed to create more homogeneous rate classes for negatively elevated structures, and thus to increase fairness to policyholders. Once the categories are determined, new flood studies and mapping would likely be required in regions with significant numbers of negatively elevated structures.
If new flood studies are not feasible, then alternative strategies could be developed to guide selection of the appropriate category of water surface elevation–exceedance probability function to use for rating a structure. For example, a strategy similar in concept to the U.S. Geological Survey’s regional regression equations1 for estimating flood flow discharges from selected meteorological, hydrologic, and hydraulic properties of the watershed, channel, and floodplain could be employed to guide selection of the appropriate water surface elevation–exceedance probability function. Such an approach would account for all drivers of rising water surface elevations, including coastal waves where appropriate.
Capturing the Loss Potential from Very Frequent Flooding
The accuracy with which more frequently exceeded floods are represented in the water surface elevation–exceedance probability function is particularly important for assessing risk for negatively elevated structures. In the NFIP average annual loss calculation, the loss attributable to each depth of inundation is multiplied by the probability of that inundation, then summed over all possible probability values. Thus, higher probability events have a significant impact on the average annual loss. Depending on the inundation depth–exceedance probability function and the structure elevation, the threshold annual chance exceedance value for damage to negatively elevated structures may be as great as 50 percent (the 2-year flood), with a significant portion of the loss caused by floods with the value much greater than 1 percent (i.e., by floods more frequent than the 100-year flood).
Figure 4.1 shows the annual damage–exceedance probability function derived for a $250,000 structure located 4 feet below the 1 percent annual chance exceedance elevation. The structure in this example is in a floodplain for which the 10 percent annual chance exceedance water surface elevation is 3 feet less than the 1 percent annual chance exceedance water surface elevation (Zone A6). The average annual loss for
____________
the structure, computed by integrating the damage–exceedance probability function, is approximately $8,880. For this negatively elevated structure, approximately 30 percent of that loss is attributable to events more frequent than the 10 percent annual chance exceedance (10-year) event, and 60 percent of the loss is attributable to events more frequent than the 5 percent annual chance exceedance (20-year) event. Only 11 percent of the average annual loss is attributable to events less frequent than the 1 percent annual chance exceedance event. By comparison, all of the loss to a structure with a first floor elevation equal to the base flood elevation is attributable to events less frequent than the 1 percent annual chance exceedance event (dashed line in Figure 4.1).
The contribution of small flood events to the average annual loss is greater in locations with smaller differences between the 1 percent and 10 percent annual chance exceedance water surface elevations. For example, if the water surface elevation difference is 0.5 feet (Zone A1), then 88 percent of the average annual loss is due to the 10 percent annual chance exceedance (10-year) event or to more frequent events. If the water surface elevation difference is 8 feet (Zone A16), then 49 percent of the average annual loss is due to events less frequent than the 1 percent annual chance exceedance (100-year) event, while events more frequent than the 5 percent annual chance exceedance (20-year) event contribute nothing to the loss.
Average annual loss calculations for negatively elevated structures are also sensitive to even small inaccuracies in inundation depth estimates at the lower end of the water surface elevation–exceedance probability function. For the example shown in Figure 4.1, if inundation depths for events more frequent than those with a 10 percent annual chance of exceedance are 0.3 feet greater than those shown in the PELV curve (a reasonable tolerance in hydrologic and hydraulic analysis model results), then the average annual loss increases from $8,800 to approximately $10,220 (a 15 percent increase). If the inundation depths are 0.3 feet less than shown in the PELV curve, then the average annual loss is approximately $7,960 (a 10 percent decrease).
Potential Changes to the NFIP Method. The loss potential for negatively elevated structures is driven by losses from floods more frequent than those with 1 percent annual chance of exceedance. Careful definition of the water surface elevation–exceedance probability function throughout the entire range of floods would ensure that the PELV curves capture the most frequent flood events. Site-specific water surface elevation–exceedance probability functions would represent the full range of floods, including very frequent floods. If developing site-specific water surface elevation–exceedance probability functions is not practical, then the NFIP could develop categories of PELV curves, as described in the previous section, with special attention given to frequent events. The shape of the current PELV curves is dictated by the difference between the 1 percent and 10 percent annual chance exceedance depths. For negatively elevated structures, the PELV curves would also have to reflect the relative magnitude of more frequent events, such as the difference between the 1 percent, 10 percent, and 50 percent annual chance exceedance depths.
The NFIP predicts economic loss due to inundation using a DELV curve, which expresses damage as a percentage (damage ratio) of a structure’s replacement value for a specified depth of water in the structure. The NFIP uses two models—the damage functions derived from the NFIP claims data and the U.S. Army Corps of Engineers (USACE) damage functions—to develop a blended DELV model. A standard actuarial technique (credibility weighting) is used to combine the two models. The more credible the NFIP claims data, the less weight is given to the USACE damage estimates. Different DELV curves are developed for different structure types and contents locations.
Three aspects of the inundation depth–damage function and its development affect premiums for structures in the NFIP portfolio, including negatively elevated structures. First, inundation depth–damage data are highly variable. Second, data quality problems may compromise the integrity of the DELV curves (see Chapter 5). Third, the NFIP credibility weighting method in many cases assigns greater weight to the USACE damage estimates for a selected inundation depth than the NFIP damage estimates for the same depth without considering whether the quality of the underlying USACE data is better than the NFIP data.
Variability of NFIP Damage Estimates
A reliable damage estimate is critical to the computation of the average annual loss. The NFIP frequently refines its inundation damage prediction functions using actual claims data. However, the claims data for a selected depth of inundation used in this refining are highly variable. For example, Figure 4.2 shows the distribution of damages reported for 2 feet of inundation depth in 2 years: 2005 and 2012. In these examples, damage ratios vary from zero to 100 percent. Figure 4.3 shows the coefficient of variation, which is the ratio of the standard deviation to the mean damage ratio, for one-story residential structures with no basement. The coefficient of variation is greater than 0.6 for water surface elevations -4 feet below to +4 feet above the lowest floor elevation, and is greater than 1.0 for some water surface elevations below the lowest floor elevation. In other types of structures, the coefficient of variation may be different.
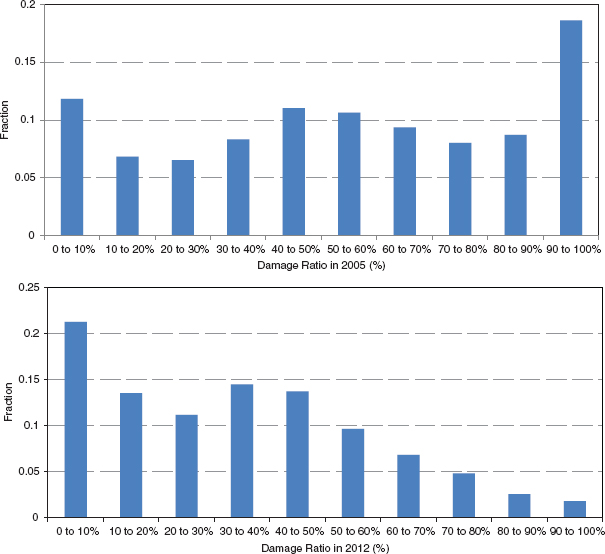
FIGURE 4.2 Distribution of NFIP flood damage data (assuming reported inundation depths are in feet) for 2 feet of flooding in 2005 (top) and 2012 (bottom). SOURCE: Data provided by Andy Neal, FEMA.
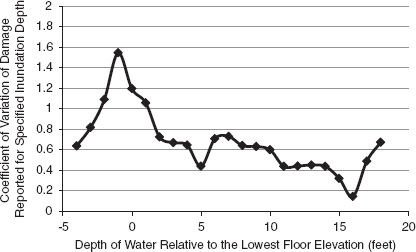
FIGURE 4.3 Coefficient of variation—the ratio of the standard deviation to the mean damage ratio—determined for one-story residential structures with no basement in the NFIP portfolio. Damage reports from 2005 are excluded to avoid biasing results with damage from extreme coastal flooding in that year. SOURCE: Data provided by Andy Neal, FEMA.
The variance observed in Figure 4.2 may be attributable to (1) a failure of inundation depth alone to adequately predict damage, (2) poor data quality (see Chapter 5), or (3) unrecognized variability within a structure class. Besides depth, characteristics of flood events that may influence the nature and extent of flood damage to a structure (and the observed variance in NFIP reported claims) include tidal- and wind-driven wave height, flow velocity, duration of inundation, debris and impact loads, sediment load, buoyancy, scour effects, erosion, and contamination (McBean et al., 1988; Thieken et al., 2005). As a result, floods with the same inundation depth may cause different damage. A suggestion that some of these factors contribute to damage is illustrated in Figure 4.4, which shows the mean flood damage ratio as a function of inundation depths for 2005 and 2012. The data for 2005 are dominated by Hurricane Katrina, which caused extensive damage in Louisiana and Mississippi. In New Orleans, where many structures behind levees are negatively elevated, some structures were inundated for an unusually long period of time, exacerbating damage, and others were near levee breaches where higher flow velocities increased forces on structures and caused more damage than predicted by depth alone. In Mississippi, which was not protected by coastal barriers, flood damage caused by high inundation depths and wind-driven waves extended many miles inland (Fritz et al., 2007). The difference between the 2005 and 2012 data could be interpreted as reflecting the effect of duration of inundation or to other factors, such as wave effects, scour at levee breaches, or the effects of debris.
The variance in damage reports may also be attributable to vulnerability differences among structures within a given category. For example, the NFIP develops a DELV curve for all one-story, no basement residential structures without regard to the replacement value of the structures. However, the higher quality materials and construction used in more expensive structures may suffer greater damage (have higher damage ratios) at lower inundation depths than the materials and construction used in less expensive structures.
Potential Changes to the NFIP Method. To better understand the large variance in damage data, additional data on flood hazard characteristics (e.g., depth and duration of flooding, flow velocity, sediment load) and structure vulnerability (e.g., properties of the foundation, quality of materials used in the construction and finish) would have to be collected in damage reports and analyzed. In addition, more classes of damage prediction functions may have to be developed to capture critical differences in drivers in the risk calculation. For
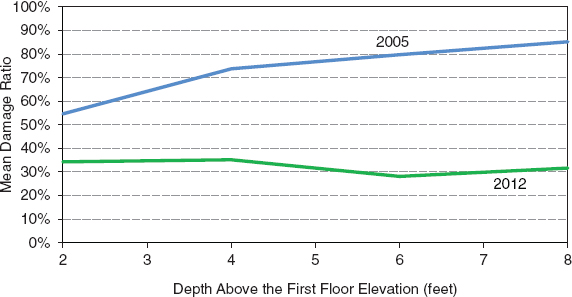
FIGURE 4.4 Variation in the mean damage as a function of the inundation depth (assumed to be in feet) for the NFIP for 2005 and 2012. SOURCE: Data provided by Andy Neal, FEMA.
example, functions might be developed to represent damage that is due primarily to inundation depth; damage that is due primarily due to inundation depth and duration (likely to be particularly important for negatively elevated structures); and so on. Developing these functions would require improved data collection (see Chapter 5) and research to establish reliable predictors of damage and their probabilities.
Weight Assigned to USACE Damage Estimates
The NFIP credibility weighting procedure (FEMA, 2003) estimates damage for each specified inundation depth as follows:2
- If the NFIP claims sample is large enough to assign 100 percent credibility at a selected confidence level (e.g., 90 percent),3 then the NFIP uses the damage estimate from claims reports.
- If NFIP claims data are not available, then the NFIP uses the USACE estimate of damage.
- If NFIP claims data are available, but not fully credible because of the small sample size, then the NFIP uses a weighted average of the NFIP claims data and the USACE damage estimates.
Figure 4.5 shows an example of the credibility analysis for 2005 loss data. The top figure shows the relative weights given to NFIP and USACE loss data from the credibility analysis. For inundation depths between zero and 5 feet, there are a sufficient number of NFIP claims data to assign full weight to the damages predicted with them; no weight is assigned to the USACE estimates for inundation depths in that range (Figure 4.5, top). For greater and lesser inundation depths, NFIP claims data are sparse, and the USACE damage estimates are weighted heavily. The bottom figure shows the damage ratio function derived from NFIP claims data, USACE damage estimates, and the blended result using the weights from the top figure. In this case, the blended DELV curve tracks
____________________
2 Personal communication from Andy Neal, FEMA, on April 11, 2014.
3 The number of claims needed for full credibility = 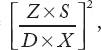 where Z is half the standard normal distribution value corresponding to a required confidence, S is the sample (collection of claims corresponding to a water depth category) standard deviation, D is the desired relative error of the estimated mean, and X is the sample mean (FEMA, 2003).
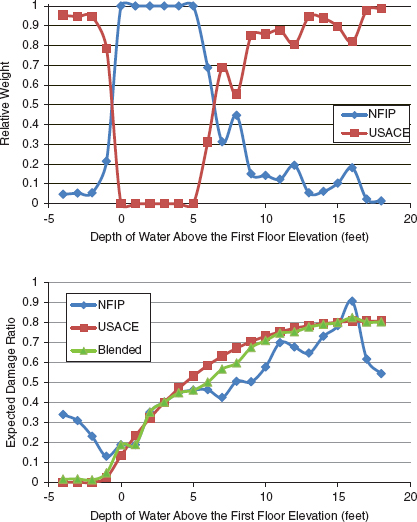
FIGURE 4.5 Illustration of the NFIP credibility analysis for 2005 loss data. (Top) Relative weights assigned to the NFIP data and the USACE data based on the credibility weighting methodology. (Bottom) Comparison of the NFIP claims data, USACE damage estimates, and the blended result using the credibility weighting methodology.
the USACE inundation depth–damage function (Figure 4.5, bottom).
The NFIP credibility analysis looks only at the size of the NFIP claims dataset (the number of data points required to produce a credible estimate) and the data variance. Other relevant factors are not included, such as the quality of the data (measurement and reporting errors), the diversity of the data (e.g., the number of flood events, variability among flood events), the number of damage observations associated with individual flood events, structure variability, or other drivers of damage. In addition, the credibility criteria (data variance and size of the claims dataset) are applied only to the NFIP data, not to the USACE inundation depth–damage function. Finally, the NFIP does not evaluate the quality of the USACE damage data. Thus, in some cases, unreliable estimates from the USACE will be given higher weight than high-quality but sparse NFIP claims data.
Potential Changes to the NFIP Method. The NFIP could improve estimates of potential damage due to
inundation by developing new inundation depth–damage functions using long-term averages of NFIP claims data or data from other sources. A new credibility analysis could then be implemented to adjust values as newer claim data become available. Smaller improvements could be made using the current weighting procedure, incorporating an assessment of the sample size and quality of both NFIP claims data and USACE damage estimates. Such changes would enhance the weighting procedure, and thus improve estimates of potential damage due to inundation—or at least improve the confidence in those values. To incorporate the credibility of the USACE damage estimates into the weighting procedure, the NFIP would have to investigate and assess the quality and statistical significance of the USACE inundation depth–damage functions used. This may be straightforward with the new USACE damage functions being created (e.g., USACE, 2015), but would likely prove to be a challenge with the USACE inundation depth–damage functions used in the credibility analysis because little documentation of those functions is available.
The NFIP computes flood loss by applying the damage ratio from the appropriate DELV curve to the replacement cost value of the structure. The objective is to set a rate that, when multiplied by an amount of insurance, will produce a premium that makes a sufficient contribution to the risk pool to cover the NFIP’s expected losses. If the insurance limit of a policy is significantly less than the replacement value of the structure—a situation referred to as underinsurance—then the concept of recovering loss through pooling premiums can break down, and both the policyholder and the insurer are threatened financially. For the policyholder, underinsurance means a loss may not be covered fully if the loss exceeds the amount of insurance purchased. For the insurer, underinsurance means that premiums collected for the underinsured property may not adequately reflect the loss, unless adjustments are made.
Empirical evidence shows that homeowners are often reluctant to protect themselves against low-probability high-consequence events, such as floods, and so purchase too little or no insurance unless required to do so (e.g., Kunreuther, 1984). The NFIP encourages, but does not require, the purchase of “insurance to value,” hence avoiding underinsurance, by providing replacement cost coverage if a single family structure is insured to at least 80 percent of its value at the time of loss (or to the full statutory limit of $250,000 for structures). Otherwise, the loss is settled on an actual cash value basis. The program also encourages the purchase of higher amounts of insurance by charging less for amounts of insurance purchased above the basic limits threshold, currently $60,000 for a single family building. The statutory mandatory flood insurance purchase requirement ties the amount of insurance to be purchased to the outstanding balance of the loan on the property for federally backed or regulated mortgages (if there is one). This balance may be less than the replacement value, and some lenders require insurance to value. In addition, the statutory limit of $250,000 on coverage for single family structures means that many structures cannot be covered to their full value. These statutory limitations may lead to underinsurance.
The NFIP method to compensate for underinsurance is to use a loading factor (UINS) in the rate formula. The loading factor adjusts the rate so that collectively the premiums reflect the amount of expected annual loss, thus protecting the NFIP from potential premium shortfalls as a result of underinsurance. To calculate underinsurance, the rate formula shown in Box 2.1 is expanded to account for losses that are not covered when the limits are lower than the property value (see Formula 3 in FEMA, 2013d). Application of the NFIP rate formula to the rate classes produces results that are consistent with the first loss scales approach (Box 4.1). The breadth of a rate class can be a factor in how effective either approach is in treating underinsurance and in pricing the different layers of risk.
In the VE zone (along coasts, with additional hazard due to wave velocity), where very high premiums and high building values can lead to underinsurance, the NFIP rate depends on how much insurance is being purchased as a percentage of the building value. In all other zones, the rate loadings reflect a broader average of the amounts of insurance purchased relative to the building values. This broader averaging may be problematic if properties within a rate class are underinsured by substantially different amounts, as may happen when
BOX 4.1
First Loss Scales
Financial risk in insurance can be treated as having three layers: the deductible, the insured limit, and the difference between the insured limit and the value of the property (if it exceeds the policy limit of liability). The standard private industry practice is to apply a rate to the total replacement value of the property to develop the pure premium (average annual loss) and then to modify this rate to take account of the uninsured layers. The relative price for each layer is determined by applying what is referred to as a first loss scale. Claims data are used to determine the frequency of loss relative to the insured amount, and this relationship is used to assign the relative price of each layer of risk. Generally, for any given property, the first dollars of coverage are more expensive to provide than the last. This is why increasing a deductible (the first layer of financial risk) can have a large impact on reducing the premium, whereas purchasing higher amounts of coverage (second layer of financial risk) may not increase the overall premium very much.
First loss scales are generally used in the insurance industry to rate individual properties. The NFIP rate formula is applied to classes of properties, but the resulting rates are consistent with those that would be developed for classes of properties using first loss scales.
negatively elevated structures are in the rate class. In such cases, the premiums paid for fully insured properties can end up subsidizing the underinsured properties.
The examples that follow illustrate how underinsurance may affect rates for negatively elevated structures. In the examples, the structure elevation (8 feet below the base flood elevation) and location (Zone A18) are constant, and the building value and the amount of insurance purchased vary (see Table 4.3). Examples 1 through 3 illustrate first loss scales principles in that (1) the required premium is not reduced much when the lower limits of coverage are purchased and (2) the rate for the amount of insurance being purchased must be increased, reflecting that it is a more expensive layer of coverage (see the first loss scales discussion in Box 4.1).
Example 1 is a building fully insured to its replacement cost of $200,000. The premium needed to cover the expected NFIP loss is $5,608, and the associated rate is $2.80 per $100 of coverage purchased. The DELV model of potential damage to this structure predicts maximum damage of $156,800 for inundation depths greater than 12.5 feet. In Example 2, the amount of insurance purchased for the same building is $170,000. Even though this is less than the replacement cost, in residential property coverage, this amount is generally still considered to be “insured to value.” As with Example 1, no loss greater than $156,800 is predicted for the $200,000 structure. All losses to the structure are covered, and so the premium needed to cover the expected annual loss is still $5,608. However, the rate needed to generate that premium increases to $3.30 per $100 of coverage purchased. If this degree of underinsurance was the average amount for the rate class, then the NFIP would charge the rate of $3.30, rather than $2.80.
In Example 3, the amount of insurance purchased for the $200,000 structure covers only half of the building value (Table 4.3). Some losses to the NFIP will be avoided; even though the maximum loss predicted by the DELV calculation is $156,800 for an inundation depth of 12.5 feet, only losses up to the insured value of $100,000 will be paid. The premium needed to cover the expected loss is slightly lower than in Examples 1 and 2 ($5,075, compared with $5,608). However, the rate needed to generate the required premium rises by 35–45 percent to $5.07 per $100 of coverage purchased. The policy will pay out for more frequent damaging events (such as those that affect negatively elevated structures) for which claims are less than the policy limit.
Examples 1 and 4 illustrate the impacts of underinsurance for a high valued building ($1 million) compared to a relatively low valued building ($200,000; Table 4.3). The current NFIP statutory limit on coverage is $250,000, and the high valued building is insured to that amount. Even though the NFIP will not pay for losses higher than that amount, the premium needed to cover the losses that will be paid is $17,800 and the rate is $7.12. If the high valued and low valued buildings are in the same rate class, the rate for the entire class must be raised to compensate, leading to a form of rate compression. Thus, losses to expensive houses can wind up being heavily subsidized by premiums paid on less expensive houses.
TABLE 4.3 Effect of Underinsurance on Premiums and Premium Rates for Structures with Lowest Floor Elevations 8 Feet Below the Base Flood Elevation
| Inundation Depth | Percent Damage | Probability in Range | Example 1 | Example 2 | Example 3 | Example 4 | ||||
| Structure Value | $200,000 | Structure Value | $200,000 | Structure Value | $200,000 | Structure Value | $1,000,000 | |||
| Insurance | $200,000 | Insurance | $170,000 | Insurance | $100,000 | Insurance | $250,000 | |||
| Damage Amount | Expected NFIP Loss | Damage Amount | Expected NFIP Loss | Damage Amount | Expected NFIP Loss | Damage Amount | Expected NFIP Loss | |||
| ≥12.5 ft | 78.4% | 0.2% | $156,800 | $313.60 | $156,800 | $313.60 | $156,800 | $200.00 | $784,000 | $500.00 |
| 12–12.5 ft | 73.8% | 0.1% | $147,600 | $147.60 | $147,600 | $147.60 | $147,600 | $100.00 | $738,000 | $250.00 |
| 11–12 ft | 73.1% | 0.1% | $146,200 | $146.20 | $146,200 | $146.20 | $146,200 | $100.00 | $731,000 | $250.00 |
| 10–11 ft | 70.5% | 0.2% | $141,000 | $282.00 | $141,000 | $282.00 | $141,000 | $200.00 | $705,000 | $500.00 |
| 9–10 ft | 68.0% | 0.2% | $136,000 | $272.00 | $136,000 | $272.00 | $136,000 | $200.00 | $680,000 | $500.00 |
| 8–9 ft | 63.5% | 0.3% | $127,000 | $381.00 | $127,000 | $381.00 | $127,000 | $300.00 | $635,000 | $750.00 |
| 7–8 ft | 59.6% | 0.3% | $119,200 | $357.60 | $119,200 | $357.60 | $119,200 | $300.00 | $596,000 | $750.00 |
| 6–7 ft | 54.2% | 0.4% | $108,400 | $433.60 | $108,400 | $433.60 | $108,400 | $400.00 | $542,000 | $1,000.00 |
| 5–6 ft | 48.9% | 0.4% | $97,800 | $391.20 | $97,800 | $391.20 | $97,800 | $391.20 | $489,000 | $1,000.00 |
| 4–5 ft | 41.9% | 0.7% | $83,800 | $586.60 | $83,800 | $586.60 | $83,800 | $586.60 | $419,000 | $1,750.00 |
| 3–4 ft | 33.2% | 0.7% | $66,400 | $464.80 | $66,400 | $464.80 | $66,400 | $464.80 | $332,000 | $1,750.00 |
| 2–3 ft | 28.6% | 1.0% | $57,200 | $572.00 | $57,200 | $572.00 | $57,200 | $572.00 | $286,000 | $2,500.00 |
| 1–2 ft | 23.3% | 1.2% | $46,600 | $559.20 | $46,600 | $559.20 | $46,600 | $559.20 | $233,000 | $2,796.00 |
| 0–1 ft | 16.6% | 1.9% | $33,200 | $630.80 | $33,200 | $630.80 | $33,200 | $630.80 | $166,000 | $3,154.00 |
| –0.5–0 ft | 3.5% | 1.0% | $7,000 | $70.00 | $7,000 | $70.00 | $7,000 | $70.00 | $35,000 | $350.00 |
| ≤ –0.5 ft | 0.0% | 91.3% | $ — | $ — | $ — | $ — | $ — | $ — | $ — | $ — |
| Premium | $5,608.20 | $5,608.20 | $5,074.60 | $17,800.00 | ||||||
| Premium Rate | $2.80 | $3.30 | $5.07 | $7.12 | ||||||
NOTE: Examples are for single family structures in Zone A18. Calculations use the NFIP actuarial rate formula to compute the average annual loss. The loss costs are based on the expected annual damage amounts and do not include consideration for deductibles, loss adjustment costs, or other loadings that would go into an actual insurance rate. SOURCE: Data from FEMA (2013d).
Potential Changes to the NFIP Method. Policyholders underinsure their property because they do not understand their flood risk, high premiums create an incentive to underinsure, or statutory limits prevent them from purchasing enough flood insurance. Better communication of flood hazard and flood risk could help policyholders understand their flood risk, which could lead them to purchase sufficient insurance. Possible solutions to the deliberate purchase of too little insurance include (1) raising premiums for policyholders who elect to purchase a lower amount of insurance than warranted by their risk, although this may not be cost effective for the NFIP; (2) reducing loss payments or charging penalties if it is discovered that the declared value of the property is too low, although heavy penalties may be hard to impose in practice because they would likely cause political problems; and (3) expanding the treatment of underinsurance for VE zone structures to all structures in the NFIP portfolio. The first two are practices used in the insurance industry. The third is used by the NFIP. Rather than making one overall adjustment in the rate for underinsurance in VE zones, the NFIP varies the rate based on the ratio of the amount of insurance purchased to the replacement cost value of the building. Three ratios are considered: less than 0.5; between 0.5 and 0.74; and 0.75 or more. A more refined classification scheme such as this could reduce the potential for cross subsidies.
Although outside the control of the NFIP, raising the statutory limits on federal flood insurance could lessen the underinsurance problem. The limits have not changed since 1994, even to correct for inflation ($250,000 in 1994 is equivalent to $402,000 in 2014). As a reference point, the average value of owner-occupied houses in California was $108,000 in 1994 and $233,600 in 2014.4 These are only averages, meaning that many policyholders have a structure value above the current $250,000 limit. At a national level, the committee’s analysis of the NFIP portfolio reveals that the proportion of single-family flood insurance policies at the $250,000 limit has increased from 11 percent in 2000 to 48 percent in 2012. As building replacement cost values increase over time, larger numbers of buildings may become underinsured, worsening the problem of cross subsidies illustrated above.
Another issue that affects the treatment of underinsurance is data quality. In the NFIP, insurance companies and agents use their own methods to estimate replacement cost (e.g., property sales data, construction costs, maximum amount of insurance coverage), and so the estimates are often inconsistent. More consistent replacement cost values could improve the underinsurance adjustment as well as other terms in the NFIP actuarial rate formula, such as DELV. Potential ways to improve replacement cost values are discussed in Chapter 5.
A deductible is the amount a policyholder pays for a loss before the insurance coverage is triggered. Deductibles can provide savings both to the insurer and the policyholder. For the insurer, deductibles reduce a portion of the loss or eliminate smaller claims and the associated claim handling expenses. For the policyholder, deductibles lower the insurance premium. In general, the higher the deductible, the lower the premium because the deductible reduces the predicted claim loss for the insurer. In addition, paying some part of the loss can encourage policyholders to take mitigation actions, thereby reducing the potential for losses to both policyholders and insurers.
Deductibles can be offered as a defined amount unrelated to the limits of liability or the insured asset value, as a percentage of the limits of liability, or as a percentage of the insured asset value. To address any potential underreporting of values, the deductible is most often expressed as a percentage of value at the time of loss. The NFIP offers deductible options as set dollar amounts, not as percentages of insurance purchased or property value. Because premiums for negatively elevated structures are expected to be high when risk-based rates are implemented, it is important for the NFIP to look for ways that policyholders can reduce their premiums and receive deductible discounts that are appropriate for the expected losses.
The current NFIP minimum deductibles for building and contents coverages range from $1,000 to $2,000 (Table 4.4), and the maximum deductible available for residential properties is $5,000 each for structure and contents coverage. Research shows that most people prefer low deductibles for all types of insurance, even
____________________
4 Data from http://www.lincolninst.edu/subcenters/land-values/land-prices-by-state.asp.
TABLE 4.4 Current Minimum Deductibles for all NFIP Policies
| Building Coverage | Post-FIRM Rating | Pre-FIRM Rating | ||
| Building | Contents | Building | Contents | |
| Below $100,000 | $1,000 | $1,000 | $1,500 | $1,500 |
| Above $100,000 | $1,250 | $1,250 | $2,000 | $2,000 |
SOURCE: NFIP Insurance Agents Manual, June 2014, pp. 14-15.
though they will have to pay more for losses (Eldred, 1980; Cutler and Zeckhauser, 2004; Sydnor, 2006). In an analysis of flood insurance deductible choices of homeowners in Florida, Michel-Kerjan and Kousky (2010) found that nearly 80 percent of policyholders chose the lowest building deductible available, and about 18 percent chose the second lowest deductible available ($500 at the time). Such a low deductible has a significant financial impact on the NFIP. The committee’s analysis of national claims data for single family residences insured by the NFIP shows that increasing the minimum deductible to $2,500 would have saved the NFIP $1.6 billion in claims payments over the 1985–2009 period, and that increasing the minimum deductible to $5,000 would have saved $3.4 billion in claims payments. Of course, NFIP savings from these higher deductibles would be partly offset by the larger premium discounts offered to policyholders.
Potential Changes to the NFIP Method. One way to reduce the anticipated premium increase for negatively elevated structures is to increase the minimum deductible. In addition, changes could be made in the way premium discounts are calculated. The current NFIP premium discounts for single family residences depend only on the dollar amount of the deductible selected and whether the insurance rating is for a pre-FIRM or post-FIRM structure. This simple approach averages the effect of different deductibles on losses, masking connections between deductible amounts, premium discounts for deductibles, and loss drivers, such as flood hazard and structure value. Refining the current NFIP approach to account for differences in flood risk and structure values would result in higher premium discounts and thus lower premiums for lower valued properties. These higher discounts could be meaningful with the high premiums anticipated for negatively elevated structures. The NFIP could also explore expressing deductibles as a percentage of the insured value, as is done in earthquake and hurricane insurance policies. This approach would more closely align the deductible discounts with the replacement values of the structures.
Regardless of which approach is taken, making the results widely available and as transparent as possible could promote policyholders’ understanding of the effects of deductible choices. For example, tools like the price simulator applications found on some private insurance company websites show how premiums would change for different deductible amounts and coverage limits, helping policyholders make more informed decisions on purchasing insurance.


