
6
Implications of Plug-in Electric Vehicles for the Electricity Sector
An important component of the ecosystem of the plug-in electric vehicle (PEV) is the electric utility, which provides the electricity that powers the vehicle.1 Electric utilities in the twenty-first century have experienced eroding demand (see Figure 6-1) and view PEVs as a potential source of increased demand (Kind 2013; EEI 2014). The Edison Electric Institute, the largest trade association for electric utilities, contends that the industry needs increased electrification of the transportation sector for the electricity sector to remain viable and sustainable in the long term (EEI 2014).
An important concern raised by the public and policy makers, however, is the ability of electric utilities to accommodate PEV charging, a concern that impacts not only PEV owners but also the public more broadly. At the current time, PEV charging requirements account for about 0.02 percent of the energy produced and consumed in the continental United States (EIA 2012).2 Were the share of the PEV fleet to reach as high as 20 percent of private vehicles, the estimated impact would still account for only 5 percent of today’s electricity production (DOT 2014; EIA 2012).3 Accordingly, the electricity sector does not perceive PEVs as posing any near-term or mid-term challenges. However, some have assumed that electric utilities cannot accommodate transportation electrification with the current grid infrastructure. That mistaken belief is also held in other countries and has been cited as a key reason why electric utilities have not been allowed to take a more proactive role in facilitating the deployment of PEVs and the associated charging infrastructure (Anegawa 2010). Therefore, it is important to examine the current electricity sector and consider what impediments might exist.
Accordingly, this chapter examines potential impediments from the perspective of the individual components of electric utilities (the distribution, transmission, and generation components) and overall system control. To put the discussion in context, the committee first describes the physical and economic structure of electric utilities. Physical constraints in the distribution infrastructure for PEV charging are identified next, followed by a discussion of potential economic constraints and impediments within the delivery system. One scenario for a hypothetical utility of the future is described at the conclusion of the chapter. The committee’s findings and recommendations are provided throughout the chapter.
One important point that should be noted before beginning the discussion of the electricity sector is that the federal government has only limited powers in directly influencing or modifying the policies and behavior of the owners or operators of the retail electricity sector. Although the Federal Energy Regulatory Commission (FERC) maintains authority to regulate transmission and wholesale sales of energy in interstate commerce, the retail electricity sector is regulated heavily and almost entirely by individual state regulatory commissions. Thus, the ability of private-investor-owned electric utilities to foster or impede the development of PEVs will vary significantly based on the actions of the individual state utility commissions. Furthermore, different regulatory bodies oversee municipal-owned utilities, federally owned utilities, cooperative utilities, and, as indicated, the wholesale markets. These jurisdictional and regional regulatory differences limit the federal government’s ability to affect the practices of the U.S. electricity sector (see, for example, U.S. Court of Appeals 2014 decision on FERC Order 745).
Finding: State jurisdiction over retail electric rates constrains the federal role in directing the electricity sector to foster PEV growth.
_____________
1 An electric utility is a publicly or privately owned company that generates, transmits, and distributes electricity for sale to the public and includes vertically integrated utilities that own their generation plants, transmission components, and distribution wires and unbundled utilities that separate the generation, transmission, distribution, and retail into different businesses. Although the majority of electric utilities in the United States are privately owned, there are a substantial number of generally smaller utilities that are owned and operated by regional organizations or municipal governments, often referred to as munis. The largest muni in the United States is the Los Angeles Department of Water and Power.
2 This estimate assumes that each PEV consumes about 10 kWh/ day.
3 This estimate assumes the aforementioned consumption for vehicle charging and that there would be 192.5 million light-duty vehicles on the road, which is equivalent to the number in 2011 in the United States (DOT 2014).
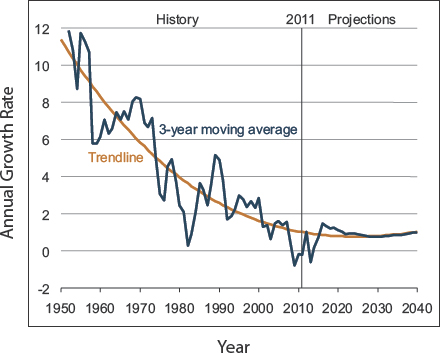
FIGURE 6-1 U.S. electricity demand growth, 1950-2040. From the 7 percent annual growth rates from the 1950s through the 1970s to the declines of the 1980s and 1990s when average growth in demand was about 3 percent per year, the first decade of this century has been nearly flat with an average growth rate of only 0.7 percent. SOURCE: EIA (2013).
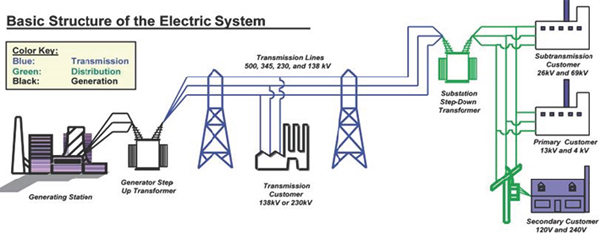
FIGURE 6-2 Schematic of U.S. electric power delivery system. SOURCE: U.S.-Canada Power System Outage Taskforce (2004).
THE PHYSICAL AND ECONOMIC STRUCTURE OF THE ELECTRICITY SECTOR
Figure 6-2 is a schematic of the U.S. electricity sector. Generation companies produce electricity from fossil or non-fossil (nuclear and renewable) sources. Transmission entities are responsible for high-voltage transmission and frequently for overall system control. Distribution companies are publicly or privately owned companies that sell, state by state, price-regulated electric energy to retail customers, residential, commercial, and industrial. They may be independent or part of a vertically integrated electric utility.
Today’s structure of the electricity sector and the business entities within it have been in a state of constant flux and evolution since April 1996, when the FERC issued its Orders No. 888 and 889, which formally separated generation, transmission, and distribution from each other, thereby providing open access to transmission in the United States to any generating entity and allowing for the operation of highly fluid wholesale electric markets (FERC 1996). In the Northeast, Midwest, Southwest, Texas (ERCOT), and California, Order 888 has resulted in the creation of Independent System Operators (ISOs); in the remainder of the country, Regional Transmission Operators (RTOs) act as wide area
system operators. The ISOs and RTOs operate and control the transmission system and manage the organized wholesale markets between generators and retail suppliers and large industrial customers. Independently owned electricity generators operate by selling wholesale electricity into organized or bilateral markets; that electricity is transmitted by separate corporate and operational entities to distribution companies, which serve retail consumers.
For roughly 60 percent of the United States, the electricity sector operates through organized markets coordinated by ISOs (EIA 2011). Most electric consumers in the United States get their energy from generators within large, centrally controlled regional networks. Their energy is transmitted over high-voltage wires that are regulated by the FERC. That energy is finally delivered through a distribution system regulated by state public utility commissions (PUCs) that are responsible for setting the price paid per kilowatt hour. Where states have opted for retail competition, such as in Ohio and Texas, the state commissions oversee and approve the manner in which the sellers of retail energy structure their services rather than set the price per kilowatt hour for electricity delivered to consumers.
Understanding the electric power delivery chain is critical for understanding the current and future interactions between electric utilities and PEV charging systems and for identifying any impediments that might be introduced by electric utilities. As with virtually all end uses of electricity, the point of contact between the electricity sector and the end user is the distribution company, regardless of whether it is residential charging, public charging, or fleet charging. It is at the local electricity distribution level that concentrations of PEVs might stress the delivery infrastructure (Maitra 2011). However, even with high adoption rates for PEVs and therefore for vehicle charging, the impact on the electricity system at large is insignificant.
Although both the generation and the transmission sectors are critical to the ultimate delivery of electricity for vehicle charging, they are not an impediment to PEV acceptance because meeting the demand created by PEV charging is well within the planning and operational capability of the electricity sector. From the perspective of the largely competitive wholesale electricity market, any increase in demand is welcome, particularly demand that has the potential to smooth daily variability (a characteristic of vehicle charging).
Finding: There is no anticipated impact on either the generation or the transmission sector of the U.S. electric power system from the introduction of PEVs. Thus, the existing capability to generate and transmit power within the United States is not now nor is it anticipated to be a deterrent to the adoption of PEVs.
PHYSICAL CONSTRAINTS IN THE DISTRIBUTION INFRASTRUCTURE
Although the introduction of PEVs is not constrained by the transmission system or the generation capacity, the electric sector distribution infrastructure, which is a lower voltage and lower capacity segment of the electric power system, could face operational constraints. PEVs are not, nor are they anticipated to be, uniformly distributed within the country or any region but are instead generally expected to be locally concentrated (see Chapter 3). PEVs have typically been concentrated in specific geographic areas that have higher median incomes, place higher values on environmental issues and energy security, and have higher average educational levels. Those demographics suggest that PEV acquisition will be concentrated in particular residential areas of the distribution system. As a result, any of the potential problems for the distribution system noted above will most likely be localized (Maitra 2011). Several scenarios in which problems could arise are discussed below.
The first scenario in which PEVs could pose an operational constraint on the distribution infrastructure is when several PEVs are simultaneously being charged on one transformer or one branch circuit that was designed to serve the traditional loads of a few residences. In that scenario, PEV charging could affect power system stability; for example, charging could cause a voltage drop in the local distribution system or cause voltage and current phase imbalances. Thus, the introduction of several PEVs could necessitate upgrades to the distribution system, such as a new transformer or a larger branch circuit that would not otherwise have been needed.
The charging of an individual PEV could be a challenge to the distribution company if that charging is coincident with peak electricity consumption on any individual distribution system element operating at full capacity. It would be extremely rare for PEV charging to coincide in time with the distribution company’s peak, which typically occurs between noon and 6 p.m. It is more likely that a PEV would be charging at a time that coincides with the peak electricity usage of a residential circuit, which is typically between 5 p.m. and 11 p.m. That scenario at the residential circuit level could overload four components of the distribution infrastructure: the service drop (the wire from local transformer to the home or other point of charge), the local distribution transformer, feeders (wires from local distribution transformer to distribution substation), or a substation transformer. Figure 6-3 provides an example of hourly demand for electricity at a substation within a residential distribution system and illustrates the pattern of residential consumption for several cases. Case 1 illustrates what might happen without any incentives for off-peak charging. It shows a measurable impact on the peak and indicates that without incentives to reduce charging on peak, there could be specific locations where additional capital investments might be needed to accommodate the added demand from PEV charging.
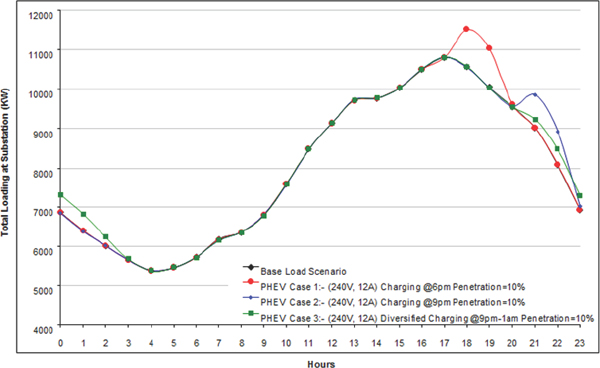
FIGURE 6-3 Hourly demand for electricity at a substation in a residential distribution system. NOTE: A, amperes; kW, kilowatt; PHEV, plug-in hybrid electric vehicle; V, volt. SOURCE: Maitra et al. (2009). Image courtesy of Electric Power Research Institute.
From the perspective of the distribution company, PEV charging represents an added uncertainty for the planning process. There are multiple dimensions to the issue, including how many PEVs will be purchased, where PEVs will be charged, and whether the pattern of charging will be coincident with local peak electricity consumption. Finally, there is the question of whether there are state-regulator-approved actions that the distribution company can take to alter the pattern of charging demand to minimize or potentially eliminate any negative effects, such as strong pricing incentives, timing restrictions, or indirect or direct charging control. Research done in California on different pricing incentives shows that PEV owners are price responsive, that larger price differentials encourage customers to charge off-peak, and that customers tend to remain on these time-of-day, price differentiated tariffs (CPUC 2012a).
Research also indicates that even without time-differentiated rates, PEV charging patterns tend to follow a pattern that has only moderate effects on distribution system peaks (CPUC 2014). With the near-term adoption levels anticipated for PEVs, there is still a natural diversity in the time and scale of PEV charging that is dictated by the type of trips that are taken in the vehicles. Currently, PEV charging behavior exhibits a gradual load curve that peaks at about 7 p.m., when most PEV owners arrive at home from work and plug in to charge at the same time. Even then, the number of upgrades at the distribution level has been minor—less than 0.75 percent of PEVs have required a local distribution system to upgrade a component—and has cost ratepayers only $36,029 overall (CPUC 2014).
Another study, by the largest California utilities (E3 2014), demonstrates that even at high PEV adoption levels, the impacts on the distribution grid are minimal. The E3 study used the distribution data and load patterns for the California utilities, analyzed the distribution of PEV adoption at the 9-digit zip code level, and forecast the incremental cost from PEVs on each individual distribution line and transformer until 2030 for two scenarios: a normal case that meets the California zero-vehicle-emission mandate and a case that has adoption levels three times higher than the normal case. The study found that even for the highest adoption levels, the cost would be less than 1 percent of the annual distribution-
upgrade costs of the California utilities. The study also found that time-of-use charging would reduce costs to customers by 60 percent compared with charging at any time during the day.
Some concern has been expressed about future patterns of charging and the resulting impact on the reliability of the distribution system with the introduction of DC fast charging (see Table 5-1). However, because the typical driving distance for a PEV is not likely to change because of fast charging, the higher charging levels simply mean that PEVs will charge in a shorter period of time while requiring the same overall quantity of energy. The higher power, shorter duration charging is unlikely to have a substantial effect on the distribution infrastructure. Furthermore, data from the EV Project indicate that DC fast charging represents only a small proportion of charging for vehicles (less than 1 percent of the energy demand for the Nissan Leafs in the study) (INL 2014).
Finding: PEV charging has had a negligible effect on the distribution-system components to date and is expected to have a negligible future effect at the anticipated rates of PEV adoption.
POTENTIAL ECONOMIC CONSTRAINTS OR IMPEDIMENTS WITHIN THE DELIVERY SYSTEM
With its existing capabilities, the generation and transmission elements of the U.S. electric power system are sufficiently robust to provide the infrastructure and deliver the energy required for PEV charging. As indicated above, any physical constraints or impediments to the distribution system will be highly localized and most likely will be only within individual distribution branches in the near to midterm. Thus, any constraints on PEV adoption that could arise from the electricity sector are more likely to be economic rather than physical or technical.
The economic constraints are primarily associated with two factors: high underlying electricity costs and ineffectively aligned rate structures. High underlying electricity costs reduce the financial benefit of owning a PEV by making the costs to drive the PEV closer to those of an ICE vehicle. The electricity cost is most often a function of the underlying characteristics of generation on a regional basis, with the hydroelectric generation of the Northwest producing much less expensive electricity than fossil-fuel generation of the Northeast. The regional differences in electricity costs add confusion to uniform explanations of the economic operating benefits of PEV ownership, as noted in Chapter 3.
A minor economic concern is the small possibility that system upgrades could in some cases be charged directly to the PEV-owning customers who necessitate the upgrade. If that cost were charged to an individual or small set of customers, it would substantially raise their costs of owning and operating a PEV. The handling of any cost allocation would depend on distribution company tariffs that govern whether individual customers are responsible for any electricity system upgrades that are incurred solely on their behalf or whether those costs can be spread over all electric customers.
The distribution company rate tariffs that are offered to end-use retail customers could raise obstacles to PEV adoption, including (1) inconsistency between rate tariffs, (2) lack of price incentives, (3) high average costs for electricity usage for residential customers, and (4) high costs for commercial and industrial customers due to demand charges (see Table 6-1 for descriptions of various rate structures). These potential obstacles can confuse retail customers about the best available electricity rate and the price advantage that they might receive by using electricity as a transportation fuel. Commercial consumers might have the added disincentive of a demand charge that is triggered by increased peak load.
The price paid by the end user for energy varies substantially between customer classes—industrial, commercial, and residential—and varies even more substantially from region to region, state to state, and distribution company to distribution company. State-regulated rate structures are designed to allow a regulated retailer to recover its fixed and variable costs and earn a fair rate of return. The costs include the variable cost of generated or purchased energy and a return on capital invested in generation, transmission, and distribution along with the operating costs of the company. The task of the PUCs is to allocate the full and reasonable costs of providing reliable energy across time, geography, and customer class. State jurisdictional authority in setting retail electricity rates has resulted in little or no consistency in the final price of electricity in terms of both the absolute price per kilowatt-hour of electricity and the rate structure itself. Uniform change appears to be nearly impossible given the fact that electric tariffs seen by all consumers (residential, commercial, and industrial) vary widely as a function of the underlying energy generation structure, the tax structures that the distribution companies face, and the vagaries of being regulated by 50 different state regulators and the local regulatory bodies that oversee more than 2,000 municipal and cooperative utilities. On the other hand, that same variability has allowed for multiple experiments in how to design rate structures for PEV charging.
The substantial differences in electric rates from one utility to another and between states are impediments to PEV adoption because it prevents a sales campaign from communicating easily or simply the economic benefits and costs of PEVs to potential buyers. Consumers have become accustomed to translating mpg values in national advertising for ICE vehicles, recognizing that the price of gasoline varies by at most 10 to 20 percent across the country. Compare that with the variability in the residential cost of electricity between Connecticut (18.22 cents per kilowatt-hour) and Washington State (8.7 cents per kilowatt-hour), with the former slightly more than double (EIA 2014). That spread does not account for any differentials in peak and off-peak rates, if they exist, or any demand charges that might be applied. Also, it does not consider the variety of types of PEVs,
TABLE 6-1 Definitions, Advantages, and Disadvantages of Various Types of Electric Rates
| Type of Rate | Relevant Definition | Advantages | Disadvantages | |
| Flat rate | An average rate charged volumetrically in cents per kWh; it would apply to all usage (e.g., $0.18/kWh). |
|
|
|
| Fixed charge and volumetric charge | Fixed charges are monthly charges (e.g., $5/month) applicable to all customers regardless of usage; they are intended to reflect costs that do not change with usage and are necessary to ensure constant availability of service. Volumetric charges are per kWh charges based on electricity usage during the billing cycle (e.g., $0.15/kWh); they are intended to reflect costs that change with usage (e.g., variable generation charges) and typically include generation, distribution, transmission, and public purpose program costs. |
|
|
|
| Tiered rates | A rate that changes as a function of cumulative customer electricity usage in a monthly bill cycle. The tiers generally are defined from a baseline quantity or monthly minimum. Prices in an “inverted tier” or “inclining block” rate increase as cumulative electricity usage increases. For example, Tier 1, electricity usage up to the baseline amount; Tier 2, electricity usage from 101 to 130 percent of baseline; Tier 3, electricity usage from 131 to 200 percent of baseline; Tier 4, electricity usage greater than 200 percent of baseline. |
|
|
|
| Demand charges | Calculated on a per-kW basis for a customer’s monthly maximum power usage (e.g., $5/kW). Demand charges are generally calculated to reflect the cost of transmission and distribution facilities built to meet customers’ maximum power demands. Demand charges are in addition to volumetric energy charges (per kWh), but the volumetric energy charges are lower than those on rate schedules without demand charges. |
|
|
|
| Time-of-Use (TOU) rate |
A rate that prices electricity according to the season or time of day that it is used. A TOU rate design more closely reflects the actual cost of providing electricity; it is characterized by
|
|
|
|
| Critical Peak Pricing (CPP) | A dynamic rate that allows a short-term price increase to a predetermined level (or levels) to reflect real-time system conditions. In a fixed-period CPP, the time and duration of the price increase are predetermined, but the days are not predetermined. CPP programs provide participating customers an incentive to shift usage away from peak hours on a CPP event day. CPP event days are generally called 24 hours in advance. |
|
|
|
| Dynamic rate | A dynamic rate allows prices to be adjusted at short notice (typically an hour or a day ahead) as a function of system conditions. Either the price or the timing or both are unknown until real-time system conditions warrant a price adjustment. Examples include real-time pricing (RTP) and critical peak pricing (CPP). RTP allows prices to be adjusted frequently, typically on an hourly basis, to reflect real-time system conditions. |
|
|
|
SOURCE: Based on data from CPUC (2012b).
which include BEVs that run only on electricity and PHEVs that can run on a gasoline or electricity, and whose mix of those fuels will vary by battery capacity and driving needs. Assembling a broad message for consumers on costs and benefits is practically impossible given that fuel costs vary, on average, by a factor of at least two and can vary by a factor of 4 or more.4,5 The difficulty in generalizing fueling costs is discussed further in Chapter 3.
Residential electric rate structures for vehicle charging can also be an impediment to PEV adoption. Flat rates provide no incentive for the owner to charge the vehicle at the optimal time for the utility. Given that flat rates represent averages over a broad customer base, if the PEV is used for commuting and thus is charged at night, for example, the flat rate is likely to be high relative to the distribution company’s actual marginal cost of supplying electricity at that time and at that location within the distribution system. The incentives provided by time-of-use (TOU) rates are substantially better aligned with the true costs of serving electric customers but add to the distribution company’s cost if digital, multiregister meters are not already installed at the home. Although time-differentiated rates generally benefit PEV owners, they can be a disincentive if owners need to charge during high-priced, generally midday, time periods. Figure 6-4 shows an example of the impact of TOU rates on charging behavior as reported in the EV Project (ECOtality 2013). The time during which a vehicle was connected to a residential charger and the time during which the vehicle was actually drawing power were examined in the service territories of the Nashville Electric Service (NES) and Pacific Gas and Electric (PG&E). NES does not offer TOU rates, but PG&E does. Figure 6-4 shows that while the vehicles were connected to residential chargers for similar times in the two service areas, demand for charging energy was very different in the service area with TOU pricing, PG&E. That finding indicates that user behavior in plugging in the vehicle is the same for both regions but that TOU pricing motivates customers to use the timers integrated with the vehicle or charger to control their charging time and minimize their cost. Given that PEV charging at residential sites most often is discretionary, in that it can occur any time after the vehicle returns home and before it is needed the next day, PEV owners can take advantage of time-differentiated rates to charge their vehicles during the least costly period, benefiting both the owner and the utility.
TOU pricing has been in place at Tokyo Electric Power Company (TEPCO) for over 20 years (TEPCO, personal communication, December 10, 2013). TEPCO says that the company has not needed to add any new generating capacity in over 20 years in large part because its rate structures send the appropriate price signals to customers, who in turn have responded by conserving electricity during peak periods.
Distribution rates for commercial and industrial customers typically contain demand charges. The economic ef-
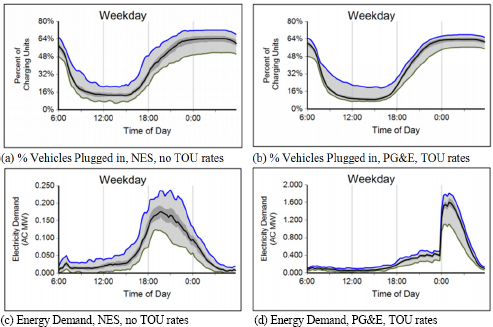
FIGURE 6-4 Residential charging behavior in NES and PG&E service territories, as measured in the EV Project. Panels (a) and (b) show average percent of vehicles plugged into residential chargers by time of day in the NES and PG&E service territories, and panels (c) and (d) show average charging energy demand by time of day in those territories. NOTE: NES, Nashville Electric Service; PG&E, Pacific Gas and Electric; TOU, time of use. SOURCE: ECOtality (2013).
_____________
4 The estimates conservatively assume that TOU or RTP rates have only twice the variability seen in average rates.
5 Assuming that an ICE vehicle gets 30 mpg on $3.50 per gallon gasoline and travels an average of 11,500 miles per year, the net savings per year for a PEV owner are $1,169 if electric costs are $0.05/kWh, $997 if electric costs are $0.10 /kWh, and only $824 if electric costs are $0.15/kWh at 300 Wh per mile.
fect on commercial or industrial customers that are providing charging could be substantial and strongly negative if a single hour with unusually high charging demand were to cause an increase in the demand charge. Although it might be argued that one or more charging stations would represent only marginal increases in energy consumption for relatively large commercial entities, to the extent that a charging station is being used during the peak power consumption time of day, it will have an impact on the maximum demand of the commercial or industrial entity. Exceeding the demand threshold by any amount will increase the total cost of energy to the facility and, in some cases, will hold the demand-rate charges at the higher level for many months to more than a year. A study done by the EV Project demonstrates the importance of this issue; it found that demand charges could account for over 90 percent of the utility bill in some areas (ECOtality 2012). Thus, it is critical to note that although the peak occurs only once and only for a brief period, the effect on the customer’s bill could be felt for far longer, and more important, the increased cost could outweigh any potential benefits gained by providing PEV charging infrastructure.
There exists one additional impediment to PEVs that is directly related to the rate structure but difficult to quantify. PEVs individually and in combination with other technologies likely to be implemented in the distribution system (such as distributed storage, distributed generation, and advanced controls) might be able to provide a benefit to the utility in terms of ancillary services, such as regulation or reserves. The supply of those necessary services to the utility has a positive value in terms of cost savings—costs that the utility would have had to expend but for the fact that the PEV or other distributed device exists and is able to operate so as to benefit the utility. The ancillary service benefits are real, even if difficult to separate from the benefits of other technologies in the distribution system. The fact that PEVs and other technologies in the system can and do provide those services provides a positive benefit to the operations of the utility and could represent a financial benefit.6 Although there is some difficulty in precisely quantifying the potential benefit, using the regulatory framework that exists in California would provide about $100 per kW per year of capability and could be an important incentive for PEVs if passed on to PEV customers (E3 2014).7 Regulatory structures implemented by PUCs and ISOs could allow these potential revenues to be claimed by PEVs. The existing operating and accounting logics implemented by PUCs and ISOs that allow customers to provide these services will need to be modified to accommodate PEVs, which are mobile loads that will be connecting at multiple and diverse locations as opposed to most (if not all) other distributed technologies that operate at a fixed location. Among those actions, the two most important are deciding which entity in the PEV ecosystem should be compensated for the service provided and how to measure compliance with any dispatch instruction given by the electric utility or ISO.
Finding: The confusion caused by the substantial differences in electric rates offered to customers by different utilities or states can be an impediment to PEV adoption.
Finding: TOU rate charging could provide a win-win situation as the PEV owner pays for charging at a lower rate and the utility benefits from moving the load from peak to off-peak.
Recommendation: To ensure that adopters of PEVs have incentives to charge vehicles at times when the cost of supplying energy is low, the federal government should propose that state regulatory commissions offer PEV owners the option of purchasing electricity under TOU or real-time pricing.
ELECTRICITY SECTOR REGULATORY ISSUES FOR OPERATING A PUBLIC CHARGING STATION
As noted in Chapter 5, utilities might have a viable business case for deploying charging infrastructure. Provision of PEV charging services can benefit electric utilities as it can increase utilization of fixed assets of the distribution infrastructure, potentially lowering rates, increasing revenues, or both. As noted, the provision of public charging might also encourage the adoption of PEVs, which could provide broad customer or societal benefits from reduced greenhouse gas emissions or improved local air quality. However, one caveat that needs to be recognized is that not all utilities are allowed to provide charging services. Some states have granted partial or full permission for electric utilities to provide PEV charging services. That action has allowed Austin Energy (Texas), Duke Energy (North Carolina), and Portland General Electric (Oregon) to fill the need for PEV charging services. In Japan, TEPCO is allowed to support the deployment of public charging infrastructure by providing necessary interconnection to the grid and internalizing the costs to the shareholders or ratepayers, and this approach has meaningfully reduced the cost to install DC fast chargers in TEPCO’s service territory (Anegawa 2010).
Thus, many in the PEV and utility industries have called for greater latitude to provide charging services, particularly in underserved markets where demand for PEV charging exists (C2ES 2012). Independent public charging providers, however, have concerns about policies that would allow electric utilities to provide charging services and believe that the
_____________
6 It has been suggested that benefits should be (and within most of the ISOs are) paid for based on the “avoided cost” of the utility. The difficulty is in calculating the avoided cost and therefore the size of any benefits. Avoided costs represent a calculation of what it would have cost the utility to acquire the service provided by the distributed technology if the utility had to provide it. A further difficulty in estimating this benefit is that the service is likely to be provided by multiple technologies within the distribution system, requiring sharing of any avoided-cost benefits, and that far more of the service could be delivered than the utility requires at any point in time.
7 This estimate is the net present value over 10 years for a resource that would be available for the 100 peak hours of a year, assuming that the cost of a new entry has a weighted average cost of capital of an independent power producer.
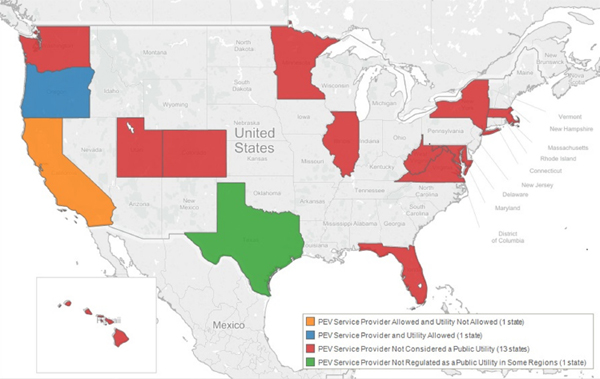
FIGURE 6-5 States that have regulations regarding who can own or operate a PEV charging station. NOTE: PEV, plug-in electric vehicle. SOURCE: Based on data from C2ES (2015). Courtesy of the Center for Climate and Energy Solutions.
utilities would have an unfair competitive advantage. Such policies could put independent public charging providers at a competitive disadvantage because utilities have substantial existing infrastructure and would be able to spread some of the cost of providing charging services across their customer base independent of whether any individual customer owned a PEV or used the public charging infrastructure.
Another regulatory issue is the extent to which PEV-charging providers are considered to be offering electricity for resale and thus would be regulated as a utility. As discussed above, in most states, the retail sale of electricity is a commercial activity heavily regulated as a monopoly business. Considering an independent public charging company to be a public utility and subject to public utility regulation would dramatically alter the company’s cost structure and its potential competitive position. In addition, it would affect the company’s ability to raise capital. Many states have not yet made a distinction between the retail sale of power and the provision of PEV charging services (Council of State Governments 2013). However, a few state PUCs have taken up the issue of whether PEV charging services should be a regulated activity,8 and in a few states, the issue has been addressed by the legislature rather than by regulatory interpretation (see Figure 6-5).9
Finding: Electric utilities that provide PEV charging services have multiple reasons for doing so that can positively affect utility ratepayers and the utilities themselves.
Recommendation: As a means of encouraging consistency between jurisdictions, the federal government should propose that state regulatory commissions decide that public charging stations are not utilities and therefore not subject to utility regulatory oversight, specifically in setting rates for charging.
_____________
8 For example, see California PUC Rulemaking 09-08-009, Code Section 740.2.14, July 2011; Arizona Corporation Commission Docket No. E-01345A-10-0123, Decision No. 72582, September 15, 2011; and PUC of Oregon Guidelines Adopted; Utilities Ordered To Make Revised Tariff Filings, January 19, 2012.
9 For example, see Washington Substitute House Bill 1571, 62nd Legislature, 2011 Regular Session, July 22, 2011; California Assembly Bill 631; Colorado General Assembly House Bill 12-1258; and New York Bill S5110-2013.
Recommendation: Given that electric utilities and their ratepayers could benefit from increased PEV adoption, electric utility regulators should encourage their electric utilities to provide PEV charging services to their customers when conditions indicate that all customers benefit.
The interactions of the electricity sector and PEV charging are not static or unidirectional. Internationally and now increasingly in the United States, the most significant changes in delivery of electricity are taking place on the customer’s premises or inside the meter, where the customer has more control than the utility.10 Such changes include programmable thermostats and smart appliances. There are also many changes occurring within the distribution system, including the introduction of micro-grids; the increased deployment of distributed electricity generation in the form of small-scale solar photovoltaics (PV) and wind; the development of distributed storage, including second-life PEV batteries; and advanced information technology and control.11
Consideration of PEVs in the future distribution system is an integral part of the ongoing planning that is focused on the utility of the future. PEV demand for charging energy will affect the total demand for energy at the distribution level. The increase in demand might well be offset by an increase in supply from distributed generation. Combining residential PV with the multiple possible functions of a PEV as a distributed storage device and means of transportation is also seen as a means of localized load balancing for the utility and cost savings for the customer.12 In the future, increased information and communication technology combined with real-time economic price signals are anticipated to allow PEV battery systems to become distributed storage systems capable of providing energy and ancillary services to the distribution utility. Termed, variously, smart charging, vehicle-to-home, and vehicle-to-grid, this capability will give the distribution-system operator added flexibility and control to manage the overall load on the system.
Finding: PEVs might be a large part of the utility of the future and could help perform functions that the electric sector deems valuable. However, issues associated with customer access to their vehicles and effects on battery life will need to be resolved before vehicles can be fully integrated into the utility of the future.
_____________
10 The customer’s electric meter is where the “fence” is typically drawn, with the distribution company unable to see what happens on the customer premise beyond its meter.
11 The MIT Energy Initiative study The Utility of the Future represents one research effort under way to understand the impact of disruptive technologies on the utility distribution system.
12 It should be noted that PEV batteries beyond their useful life for transportation might be useable as stationary storage devices within the distribution system (see Chapter 4).
Anegawa, T. 2010. Needs of Public Charging Infrastructure and Strategy of Deployment. TEPCO. Kanagawa, Japan.
CPUC (California Public Utilities Commission). 2012a. Load Research Report and Pricing Study. Alternative Fueled Vehicles Order Instituting Rulemaking R.09-08-009. San Francisco, CA. December 28.
CPUC. 2012b. “Workshop Presentation: Rate Design Elements, Concepts and Definitions.” Residential Rate Structure Order Instituting Rulemaking R.12-06-013. December 5.
CPUC. 2014. Load Research Report. Alternative Fueled Vehicles Order Instituting Rulemaking R.09-08-009. San Francisco, CA. January 31.
Council of State Governments. 2013. State Utilities Law and Electric Vehicle Charging Stations. http://knowledgecenter.csg.org/kc/sites/default/files/Electric%20Vehicle%20Charging%20Stations_0.pdf.
C2ES (Center for Climate and Energy Solutions). 2012. An Action Plan to Integrate Plug-in Electric Vehicles with the U.S. Electrical Grid. Report of the PEV Dialogue Group. March. http://www.c2es.org/initiatives/pev/action-plan-report.
C2ES. 2015. Who Can Own/Operate a Charging Station? http://www.c2es.org/initiatives/pev/maps/who-can-ownoperate-a-charging-station. Accessed March 24, 2015.
DOT (U.S. Department of Transportation). 2014. “National Transportation Statistics.” http://www.rita.dot.gov/bts/sites/rita.dot.gov.bts/files/publications/national_transportation_statistics/index.html.
E3 (Energy and Environmental Economics). 2014. California Transportation Electrification Assessment Phase 2: Grid Impacts, October 23. http://www.caletc.com/wpcontent/uploads/2014/10/CalETC_TEA_Phase_2_Final_10-23-14.pdf.
ECOtality. 2012. Lessons Learned—The EV Project White Paper Syllabus. Prepared for the U.S. Department of Energy Award #DE-EE0002194. http://www.theevproject.com/downloads/documents/Syllabus%20Rev%204.0.pdf.
ECOtality. 2013. “How Do PEV Owners Respond to Time-of-Use Rates while Charging Vehicles?” http://www.theevproject.com/cms-assets/documents/125348-714937.pev-driver.pdf.
EEI (Edison Electric Institute). 2014. Transportation Electrification: Utility Fleets Leading the Charge. Washington, DC. June.
EIA (U.S. Energy Information Administration). 2011. “About 60% of the U.S. Electric Power Supply Is Managed by RTOs.” Today in Energy, April 4. http://www.eia.gov/todayinenergy/detail.cfm?id=790.
EIA. 2012. “Table A1. Total Energy Supply and Disposition Demand” and “Table A2. Energy Consumption by Sector and Source.” Annual Energy Outlook 2013 Early Release Overview. December 5. http://www.eia.gov/forecasts/aeo/er/index.cfm. Accessed March 14, 2013.
EIA. 2013. Annual Energy Outlook 2013 Market Trends—Electricity, May. Figure 75. http://www.eia.gov/forecasts/aeo/pdf/0383%282013%29.pdf.
EIA. 2014. Electric Power Monthly with Data for December. February. http://www.eia.gov/electricity/monthly/current_year/february2014.pdf.
FERC (Federal Energy Regulatory Commission). 1996. Promoting Wholesale Competition Through Open Access Non-discriminatory Transmission Services by Public Utilities; Recovery of Stranded Costs by Public Utilities and Transmitting Utilities. Order No. 888. Issued April 24.
INL (Idaho National Laboratory). 2014. EV Project Electric Vehicle Charging Infrastructure Summary Report: October 2013 through December 2013, INL/MIS-10-19479. http://avt.inel.gov/pdf/EVProj/EVProjectInfrastructureQ42013.pdf.
Kind, P. 2013. Disruptive Challenges: Financial Implications and Strategic Responses to a Changing Retail Electric Business. Edison Electric Institute. January.
Maitra, A. 2011 Potential Impacts of Vehicles on the Grid. Electric Power Research Institute. Palo Alto, CA. August.
Maitra, A., J. Taylor, D. Brooks, M. Alexander, and M. Duvall. 2009. Integrating Plug-in Electric Vehicles with the Distribution System. 20th International Conference on Electricity Distribution, Prague, June 8-11. Electric Power Research Institute. Palo Alto, CA.
U.S.-Canada Power System Outage Taskforce. 2004. Final Report on the August 14, 2003 Blackout in the United States and Canada: Causes and Recommendations. April. http://energy.gov/sites/prod/files/oeprod/DocumentsandMedia/BlackoutFinal-Web.pdf. Accessed April 23, 2013.
U.S. Court of Appeals. 2014. Electric Power Supply Association, Petitioner v. Federal Energy Regulatory Commission, Respondent and Madison Gas and Electric Company et al., Intervenors. No. 11-1486. May 23. http://www.cadc.uscourts.gov/internet/opinions.nsf/DE531DBFA7DE1ABE85257CE1004F4C53/$file/11-1486-1494281.pdf.


