2
Plug-in Electric Vehicles and Charging Technologies
As discussed in Chapter 1, the assigned task for the present report is to examine barriers to the adoption of plug-in electric vehicles (PEVs), which use electricity from the U.S. electric grid as their fuel. When powered by electricity from the grid, which uses little petroleum to produce electricity, such vehicles require essentially no petroleum, and they emit no carbon dioxide (CO2) or other harmful pollutants from the tailpipe (EPA 2012). The premise for the assigned task is that such vehicles have the potential for significantly lowering petroleum consumption and decreasing emissions now and even more so in the future. The CO2 emissions advantage will grow as the United States continues to switch to lower-carbon-emitting sources of electricity by phasing out coal and natural gas combustion and replacing those energy sources with solar, wind, or nuclear energy, or alternatively by using carbon capture and sequestration for coal and natural gas plants if that technology ever proves to be practical.
As described in more detail in this chapter, electricity from a battery powers the electric motor of a PEV and is thus the analog of the gasoline in a tank that powers the internal-combustion engine (ICE) of a conventional vehicle. The hundreds of miles of range that is typical for a conventional vehicle depends on how many gallons of fuel the tank can hold and on the fuel economy of the vehicle. Similarly, the all-electric range (AER) of a vehicle (the distance that it can travel fueled only by the electricity that can be stored in its battery) depends on the size of the battery and the efficiency of the vehicle. The AER, like the range of an ICE vehicle, depends on such factors as the vehicle design, including its aerodynamics, rolling resistance, and weight; the driving environment, including road grade and outside temperature; the amount of heating and cooling that is used; and how aggressively the vehicle is driven (NREL 2013). Some factors, such as outside temperature, will have a greater effect on PEVs than ICE vehicles. The ranges quoted in the present report are taken from the U.S. Environmental Protection Agency (EPA) data on results from the standard driving cycle (EPA 2014).
This chapter begins with a discussion of the capabilities and limitations of four classes of PEVs, each presenting different obstacles to widespread consumer adoption. It continues with a discussion of high-energy batteries, the critical and expensive components for all PEVs, and the possibility of increasing the energy densities of these batteries. A summary of current and projected battery costs is provided because it is primarily higher battery costs that make PEVs cost more than ICE vehicles. The chapter concludes with a discussion of vehicle charging and charging options. The committee’s findings and recommendations are provided throughout this chapter.
TYPES OF PLUG-IN ELECTRIC VEHICLES
Essentially all U.S. vehicles today have an ICE that uses gasoline or diesel fuel that is derived from petroleum and produces CO2 and other harmful emissions as the vehicles travel. Hybrid electric vehicles (HEVs) achieve a lower fuel consumption than conventional vehicles of the same size and performance. They typically have a smaller ICE and a high-power battery and electric motor to increase the vehicle’s acceleration when needed and to power the vehicle briefly at low speeds. Electric energy is provided to the battery when the vehicle brakes and is produced by the ICE using power that is not needed to propel the vehicle. The lower fuel consumption that can be achieved is illustrated by the 50 miles per gallon (mpg) of gasoline that is achieved by the Toyota Prius, the best-selling HEV. There are many other HEV models available in the market, most of which use much less fuel than their ICE counterparts. Although HEVs still constitute a small fraction of the U.S. vehicle fleet, the more rapid adoption of efficient HEVs could be important for meeting the increasingly stringent corporate average fuel economy (CAFE) and greenhouse gas (GHG) emission standards that are helping to drive down the demand for petroleum and to decrease vehicle tailpipe emissions. However, although HEVs use batteries and electric motors, they derive all of their electric and mechanical energy from their gasoline or diesel fuel. Thus, HEVs are used as a point of comparison for the present report, but they are not its primary focus.
As noted in Chapter 1, the PEVs that are the focus of the present report are often divided into two categories: battery electric vehicles (BEVs) and plug-in hybrid electric ve-
hicles (PHEVs) that include an ICE and an electric motor. This chapter uses vehicle AER to distinguish four classes of PEVs. The reason is that the obstacles to consumer adoption and the charging infrastructure requirements differ for the four classes of PEVs. BEVs are separated into long-range BEVs and limited-range BEVs, and PHEVs are separated into range-extended PHEVs and minimal PHEVs.
There are now examples in the market for each type of PEV, and the committee uses some of them to illustrate their capabilities (see Table 2-1). Despite the increasing number of PEVs entering the market, however, far fewer vehicle types and features are available compared with the types and features available for conventional ICE vehicles and HEVs. Chapter 3 discusses the current paucity of choices as a possible barrier to PEV adoption. As PEVs become more common, however, the variety of choices will increase, and some models could emerge that do not fit perfectly into one of the four categories described here.
Finding: The increasing number of PEVs entering the market demonstrates the possibility of various types of electrically fueled vehicles, although far fewer vehicle types and
TABLE 2-1 Definitions and Examples of the Four Types of Plug-in Electric Vehicles
| Vehicle | Battery Capacitya | All-Electric Rangeb |
| Type 1. Long-Range Battery Electric Vehicle. Can travel hundreds of miles on a single battery charge and then be refueled in a time that is much shorter than the additional driving time that the refueling allows, much like an ICE vehicle or HEV. | ||
 2014 Tesla Model S © Steve Jurvetson, licensed under Creative Commons 2.0 (CC-BY-2.0) |
85 kWh nominal | 265 miles |
| Type 2. Limited-Range Battery Electric Vehicle. Is made more affordable than the long-range BEV by reducing the size of the high-energy battery. Its limited range more than suffices for many commuters, but it is impractical for long trips. | ||
 2014 Nissan Leaf © 2014 Nissan North America, Inc. Nissan, Nissan model names, and the Nissan logo are registered trademarks of Nissan |
24 kWh nominal (~21 kWh usable) | 84 miles |
 2014 Ford Focus Electric Image courtesy of Ford Motor Company |
23 kWh nominal | 76 miles |
| Type 3. Range-Extended Plug-in Hybrid Electric Vehicle. Operates as a zero-emission vehicle until its battery is depleted, whereupon an ICE turns on to extend its range. | ||
 2014 Chevrolet Volt © General Motors |
16.5 kWh nominal (~11 kWh usable) | 38 miles |
| Type 4. Minimal Plug-in Hybrid Electric Vehicle. Is mostly an HEV. Its small battery can be charged from the grid, but it has an all-electric range that is much smaller than the average daily U.S. driving distance. | ||
 2014 Toyota Plug-in Prius Image courtesy of Toyota Motor Corporation |
4.4 kWh nominal (~3.2 kWh usable) | 11 miles (blended) 6 miles (battery only) |
a Nominal battery capacities, reported by manufacturers in product specifications, are for a battery before it goes into a vehicle. Vehicle electronics restrict the usable battery capacity to what becomes the vehicle’s all-electric range.
b The all-electric ranges noted are average values estimated by EPA. The motor size and design architecture of the Toyota Plug-in Prius require the use of its ICE to complete the Federal Test Procedure; therefore, its range is given for both blended, charge-depleting operation and battery-only operation. All other vehicle ranges are given only for fully electric, charge-depleting operation. NOTE: HEV, hybrid electric vehicle; ICE, internal-combustion engine.
SOURCES: Based on data from Duoba (2012); DOE/EPA (2014a, 2014b, 2014c, 2014d, 2014e); DOE (2012, 2013); EPA (2014); Ford (2014); and Toyota (2014).
features are currently available than are available for conventional ICE vehicles and HEVs.
Type 1: Long-Range Battery Electric Vehicles
Today’s drivers are accustomed to ICE and HEV vehicles that are able to drive for hundreds of miles and then be refueled at any gasoline station in several minutes. Extended trips are practical insofar as the refueling time is much shorter than the additional driving time that refueling provides. The full-size Tesla Model S is a demonstration that hundreds of miles are also possible with a BEV that gets its energy entirely from the electric grid. It has a range based on the EPA driving cycle of 265 miles for a single charge of its 85 kWh battery (DOE/ EPA 2014a). Half of the charge of a depleted battery can be replenished in 20 minutes at any of the superchargers that Tesla is installing for its customers along major U.S. highways. That charge would extend the driving distance by about 132 miles. Thus, the Tesla Model S is considered a long-range BEV because it can drive for hundreds of miles on a charge and then be refueled in a time that is much shorter than the additional driving time that the refueling allows. Although filling a vehicle with gasoline or diesel would be much quicker, the ability to travel almost 400 miles stopping only once for a 20-minute recharge is a notable achievement for a BEV. With its high acceleration performance, low noise, high-end styling, and expected low maintenance, the Tesla Model S has earned several consumer performance awards (MacKenzie 2013; Consumer Reports 2014).
The Tesla Model S is priced as a high-end luxury vehicle comparable to a high-end BMW and is not affordable for most U.S. drivers.1 Nonetheless, it is an important demonstration of the possibility of a long-range BEV for consumers. For now, however, high battery cost is a barrier to the mass adoption of the Tesla Model S and other BEVs. The fuel cost per mile and maintenance costs are much smaller for BEVs than for ICE vehicles, but not enough to offset their higher purchase price at current U.S. petroleum prices. The situation can be quite different in countries where gasoline and diesel fuel cost 2 or 3 times as much as in the United States.
Finding: The possibility of a long-range BEV that is powered by grid electricity rather than gasoline or diesel and that meets consumer performance needs has been clearly demonstrated by the full-size Tesla Model S.
Type 2: Limited-Range Battery Electric Vehicles
The high cost of high-energy batteries leads to three types of more affordable PEVs. The first sacrifices driving range and the other two sacrifice zero tailpipe emissions for longer trips. A limited-range BEV is more affordable simply because a smaller high-energy battery is installed, giving it a shorter range. The 2014 Nissan Leaf, a midsize car, is the best-selling example. It has a 24 kWh battery and an 84-mile range (DOE/ EPA 2014b). A more recent addition to the limited-range BEV market is the Ford Focus Electric compact car, which has a 76-mile range (DOE/EPA 2014c). As noted earlier in this chapter, the actual range of a BEV will depend on a variety of factors, including climate, road grade, and driver behavior. The difference between the range, fuel economy, and emission performance estimated for regulatory compliance and what is actually experienced by drivers of all types of light-duty vehicles continues to be controversial and is discussed in other NRC reports (NRC 2011, 2013).
The ranges that are achievable by limited-range BEVs are much longer than the 40 or fewer miles that 68 percent of U.S. drivers drive in a day, making these vehicles adequate for normal commuting and the average daily use (FHWA 2011). However, drivers of ICE vehicles are accustomed to being able to travel well beyond the average daily distance when the need arises and can add hours of additional traveling time by simply refilling a gasoline or diesel fuel tank in several minutes. For a limited-range BEV, however, a half hour of the fastest available charging will typically allow an hour or even less of additional driving, making extended trips impractical. For extended trips and driving distances much beyond the AER, the limited-range BEV driver needs to have access to a second vehicle that has no serious range limitations or to some other transportation means. As discussed in Chapter 3, many households have two or more vehicles, so trading vehicle utility within a household is already common. For its customers, BMW is experimenting with offering access to an ICE vehicle for the occasional long trip to see if this perk lowers the barrier to adoption of its vehicles. Rental companies like Hertz have also indicated that they are interested in filling that same niche (Hidary 2012).
Finding: Limited-range BEVs are the only type of PEV that have a considerable range limitation. However, the range that they do have more than suffices for the average daily travel needs of many U.S. drivers.
Finding: Given the substantial refueling time that would be required, limited-range BEVs are not practical for trips that would require more than one fast charge.
Type 3: Range-Extended Plug-in Hybrid Electric Vehicles
A range-extended PHEV2 is similar to a long-range or limited-range BEV in that the battery can be charged from
_____________
1 The cost of producing a Model S is currently offset somewhat in that Tesla is able to sell the zero-emission-vehicle (ZEV) credit it earns for each vehicle to other vehicle manufacturers to allow them to comply with the ZEV mandate. See Chapter 7 for a detailed discussion of the ZEV program.
2 The term range-extended PHEV is a general category based on the all-electric range of the PHEV and should not be confused with the term extended-range electric vehicle that General Motors uses to describe the Chevrolet Volt.
the electric grid. However, the battery is smaller than that in a BEV, and the vehicle has an onboard ICE fueled by gasoline or diesel fuel that is able to charge the battery during a trip. Although extended trips fueled only by electricity are not practical, the vehicle has a total range comparable with that of a conventional vehicle because of the onboard ICE. The 2014 Chevrolet Volt with an AER of 38 miles (DOE/EPA 2014d) is the best-selling example, and the 2014 Ford Energi models (Fusion Energi and CMax Energi) that have AERs of 20 miles are other prominent examples. The AERs are comparable to the average daily driving distance in the United States.
The consequence of eliminating the range restrictions of a limited-range BEV is that the added ICE uses petroleum and produces tailpipe emissions. Although the ICE can be operated to maximize efficiency and minimize emissions, the fraction of miles traveled propelled by electricity depends on how willing and able a driver is to recharge the battery during a trip longer than the AER. On the basis of data collected by DOE through its EV Project, early adopters of the Chevrolet Volt appear to be very motivated to minimize their use of the ICE engine by charging more frequently and logging more electric miles per day than Nissan Leaf drivers (Schey 2013). Blanco (2014) reported that 63 percent of all miles traveled by the Chevrolet Volt are fueled by electricity.
Finding: The Chevrolet Volt demonstrates that if they become widely adopted, range-extended PHEVs with AERs comparable to or greater than the average U.S. travel distance offer the possibility of significant U.S. petroleum and emission reductions without range limitations.
Type 4: Minimal Plug-in Hybrid Electric Vehicles
Minimal PHEVs are PEVs whose small batteries can be initially charged from the electric grid to provide electric propulsion for an AER that is much less than the average daily travel distance for the U.S. driver. Among many examples, the 2014 Plug-in Toyota Prius is a minimal PHEV in that its AER is only 6 miles (DOE/EPA 2014e). It is an extreme example of a car that is designed for minimum compliance with regulations rather than to give good electric-drive performance. Minimal PHEVs allow a manufacturer to comply with regulations for obtaining PEV emission credits without the expense of designing and producing a car that is optimized for using electricity instead of petroleum. They allow their drivers to comply with requirements for high-occupancy-vehicle (HOV) lane access whether or not they bother to charge from the grid (CCSE 2014). As might be expected, driver usage surveys of Plug-in Prius drivers show that a substantial fraction do not regularly charge their vehicles (Chernicoff 2014). Minimal PHEVs are essentially HEVs.
Finding: Minimal PHEVs with AERs much shorter than the average daily driving distance in the United States are essentially HEVs.
Recommendation: Minimal PHEVs should be treated as HEVs with respect to financial rebates, HOV access, and other incentives to encourage PEV adoption.
The capacity, weight, and volume of the high-energy battery in a PEV largely determine its range, performance, and cost relative to an HEV or an ICE vehicle. This section summarizes the energy densities with respect to weight and volume that have been achieved with battery chemistries so far and considers possible improvements, despite the difficulty of precisely predicting future developments. Differences in current battery geometries and cooling strategies are discussed, along with the associated uncertainties about long-term battery durability.
Energy Density and Battery Chemistry
The battery in a PEV is the counterpart to the fuel tank for an ICE vehicle. Electric energy from the electric grid is stored in the battery until it is needed by the electric motor to turn the wheels. The more energy stored in the battery, measured in kilowatt-hours (kWh), the longer the vehicle’s AER. An 80 kWh battery can propel a vehicle twice as far as can a 40 kWh battery when the same vehicle is driven in the same way, just as 20 gallons of gasoline can provide the energy to propel an ICE vehicle twice as far as 10 gallons of gasoline. The nominal battery capacities for the PEVs in Table 2-1 are what the batteries can store as their state of charge (SOC) goes from fully discharged (SOC of 0 percent) to fully charged (SOC of 100 percent). Vehicle manufacturers use electronics to restrict how fully a battery can be charged and how far the vehicle is able to deplete the charge in its battery. They make different choices for the usable capacity of their vehicle batteries because it is known that this factor affects the degradation of the battery over time, even though the degradation has yet to be fully characterized or understood.
A battery’s energy density (see Figure 2-1) determines the mass and volume of the battery necessary to store the energy that a PEV requires. The vertical axis in Figure 2-1 is the energy storage capacity per unit volume (Wh/L), and the horizontal axis is the energy storage capacity per unit mass (Wh/ kg). Lead acid batteries have a relatively small energy density, even though they provide starting, lighting, and ignition for essentially all the ICE vehicles around the world. The Toyota Prius was the first mass-produced vehicle to use nickel-metal hydride (NiMH) batteries. Such batteries have about twice the energy density of lead acid batteries, and they proved to be very reliable when they were used in all the early HEVs. However, there seems to be no prospect for the large increases in energy density that would be required to make them attractive for use in PEVs. Lithium-ion batteries were invented in the 1970s (Goodenough and Mizushima 1981) and mass produced for the first time by Sony for laptop computers in 1991 (Yoshino 2012). In the following two decades, lithium-
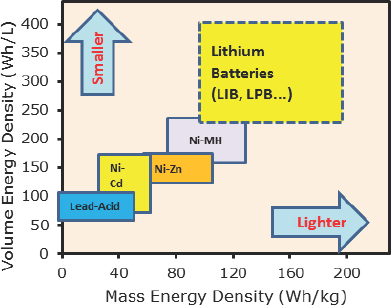
FIGURE 2-1 The volume energy density and the mass energy density for various battery types. NOTE: LIB, lithium-ion battery; LPB, lithium-polymer battery; Ni-Cd, nickel cadmium; Ni-MH, nickel-metal hydride; Ni-Zn, nickel zinc; Wh/kg, watt-hour per kilogram; Wh/L, watt-hour per liter. SOURCE: Amine (2010).
ion batteries took over the small electronics market in such devices as laptop computers and cell phones. In recent years, they have also become the battery of choice for PEVs and for new HEV models.
An electrically powered vehicle needs only about one quarter of the stored energy that an ICE vehicle needs to deliver the same energy to turn the wheels. Most of the energy that combustion releases from the fuel within an ICE is wasted as heat that is dissipated through the radiator and exhaust. The large efficiency advantage of the PEV, however, is more than overcome by the much smaller energy density in a charged battery compared with the energy density of gasoline. The result is that PEV batteries now weigh much more and occupy a much larger volume than a tank filled with gasoline. For example, the 85 kWh battery in a Tesla Model S, the largest production vehicle battery so far, weighs about 1,500 lb3 (Tesla 2014a). Delivering the same energy to the wheels of an ICE vehicle requires the combustion of slightly less than 9 gallons of gasoline, which weighs about 54 lb.
The increased weight (about that of seven extra passengers) reduces the acceleration and the range that would otherwise be realized, although the powerful motor in the Model S overcomes the acceleration problem. Accommodating large, heavy batteries makes it difficult to use an ICE or HEV platform for an electric vehicle. A vehicle designed from its beginning to have electric propulsion has more options. The Model S, for example, was designed with a battery compartment under the vehicle’s entire floor board so that the heavy batteries are used to keep the vehicle’s center of gravity low to improve handling.
The lithium-ion batteries in vehicles differ in the chemistries and materials that are used and in the energy densities achieved (Table 2-2). In a lithium-ion battery (see Figure 2-2), the positive lithium-ions flow between the anode and the cathode within the electrolyte, as do electrons in an external circuit connected between the anode and cathode. The cathodes used are described using chemical formulae that provide their composition. All anodes but one are carbon. All PEV batteries use an organic solution of LiPF6 as the electrolyte.
The committee notes that the design of a vehicle battery is related not only to the battery chemistry but also to the power and energy requirements of the various applications. For example, PHEVs require more power than BEVs; thus, BEVs can use thicker, cheaper electrodes. Furthermore, PHEV batteries must be cycled more frequently than BEV batteries, so PHEV batteries tend to use a smaller portion of the nominal battery capacity. Those two facts affect the battery structure and cost per kilowatt-hour and are taken into account in various analyses of PEV battery costs (Daniel 2014; Sakti et al. 2014) and in the EPA/NHTSA analysis that informed the committee’s analysis of battery costs as discussed below.
Projected Energy Density Increases and Possible New Battery Chemistries
Lithium-ion batteries with increased energy density are naturally the subject of research and development efforts. It is difficult to predict success or its timing, but three approaches that are being pursued are worthy of mention.
_____________
3 The estimate is based on Tesla’s reported energy density for the Model S battery of 121 Wh/kg (Tesla 2014a).
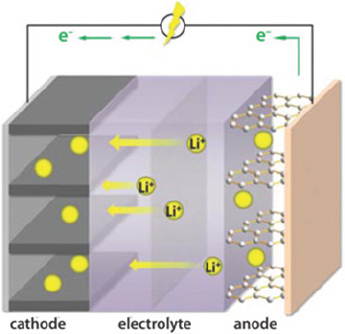
FIGURE 2-2 Representation of a lithium-ion battery that shows lithium ions traveling between the anode and the cathode and electrons traveling through the external circuit to produce an electric current. SOURCE: Kam and Doeff (2012).
TABLE 2-2 Properties of Lithium-Ion Batteries in Four Plug-in Electric Vehicles on the U.S. Market
| PEV | Cathode | Anode | Supplier | Cell Type | No. of Cells | Energy (kWh) | Power (kW) |
| Tesla Model S | NCA = LiNi0.8Co0.15Al0.05O2 | Carbon | Panasonic | Cylindrical | ~8,000 | 85 | 270 |
| Chevrolet Volt | LMO = LiMn2O4 | Carbon | LG Chem | Prismatic | 288 | 16.5 | 111 |
| Nissan Leaf | LMO = LiMn2O4 | Carbon | Nissan/NEC | Prismatic | 192 | 24 | 90 |
| Honda Fit | NMC = LiNi1/3Mn1/3Co1/3O2 | Li4Ti5O12 | Toshiba | Prismatic | 432 | 20 | 92 |
NOTE: Al, aluminum; Co, cobalt; kWh, kilowatt-hour; Li, lithium; LMO, lithium manganese oxide; Mn, manganese; NCA, nickel cobalt aluminum oxide; NMC, nickel manganese cobalt oxide; Ni, nickel; O, oxygen; Ti, titanium.
- Increasing the number of lithium atoms in a layered cathode structure has been shown in the laboratory to increase the energy density (Julien et al. 2014).
- Developing electrolytes that can operate at 4.8 V rather than 4.2 V would increase the energy density (Pham et al. 2014).
- Replacing the carbon anode with one that includes silicon would improve the energy density (Ge et al. 2013). Theoretically, a pure silicon anode would have an energy density 10 times that of a pure carbon anode. However, pure silicon anodes are not practical because they crumble during a charging cycle, being unable to withstand having their volume changed by more than a factor of three. Mixtures of silicon and carbon with appropriate binders might minimize the volume change and yet provide an increased energy density.
The committee estimates that although there can be no guarantee, as much as a twofold increase in energy density could come from some combination of the three approaches within the next decade. Such an increase would allow an important reduction in the volume and weight of high-energy batteries. Most important, however, the cost per kilowatt-hour needs to decrease; a battery having twice the energy density at twice the cost would not make PEVs any more affordable. Nonetheless, even with such an improvement, battery energy densities would still be much smaller than the energy density of gasoline.
On a longer time scale, other battery chemistries could significantly increase the energy density. The theoretical energy density for a lithium-air battery is 5,200 Wh/kg (Rahman et al. 2014), which is comparable to that of gasoline. Such a battery uses oxygen from air and therefore does not need to store an
oxidizer. PolyPlus (2009) claims to have a battery capable of 700 Wh/kg and expects to produce a rechargeable battery with a higher energy density. Another promising approach is the development of a high-energy density lithium-sulfur battery. Sion Power, the recipient of substantial Advanced Research Projects Agency-Energy (ARPA-E) funding, claims that “over 600 Wh/kg . . . and 600 Wh/L in energy density are achievable in the near future” (Sion Power 2014). Substantial challenges remain for both lithium-air and lithium-sulfur batteries, however, particularly in producing batteries that survive frequent recharging, so it is difficult to predict if and when batteries with much higher energy densities will be available.
Finding: Affordable batteries with higher energy densities and longer useful lives could greatly increase the all-electric range and presumably increase the adoption rate for PEVs.
Finding: Although there can be no guarantee, as much as a twofold increase in energy density from present values of 100-150 Wh/kg could come from some combination of current research efforts within the next decade.
Finding: Battery research is critical because more practical vehicle batteries that have higher energy densities and longer life are needed to address important concerns about battery range and durability.
Battery Geometry, Cooling, and Durability
Just as there is no consensus on what is the best lithiumion battery chemistry, there is also no consensus on what is the most stable or most economical battery geometry or on how much the battery temperature should be regulated for the sake of battery longevity. As more PEVs are driven, the early adopters are essentially testing both the various battery chemistries and the battery temperature regulation choices under real-world conditions that are hard to duplicate in laboratories.
Tesla connects many thousands of small cylindrical cells, each having the same physical shape and size as those that are commonly used in computer batteries, thereby profiting from the extensive manufacturing experience for cells with this geometry. All other manufacturers use many fewer but much larger cells in so-called prismatic or pouch geometries. A Nissan Leaf air-cools its batteries, while the Chevrolet Volt and the Tesla Model S use a liquid system and heat exchangers to regulate battery temperature. Over the next several years, the real-world experience reported by early adopters should make clear the advantages and disadvantages of each strategy.
Concerns about the durability and performance of the current lithium-ion batteries at extremely high and low temperatures could be a barrier to PEV adoption, depending on the durability observed as more vehicles are driven for longer times (Steffke et al. 2008). One study that evaluated a PHEV with a 20 kWh battery showed that a hot climate accelerates the normal degradation of battery capacity with time (see Figure 2-3) (Pesaran et al. 2013). Reports on shorter battery life for Nissan Leafs in Arizona seem consistent with that observation (Gordon-Bloomfield 2013). As a result, Nissan has tested new battery pack designs to address the observed problem (Gordon-Bloomfield 2013), and press reports of the increased rate of battery deterioration have not continued. However, it is not clear whether the problem has been solved. Although Figure 2-3 illustrates preliminary results of studying the effect of temperature on battery capacity, battery life depends also on cycling at various depths of charge, rate of charge and discharge, and likely many other variables besides temperature. Only long-term experience in hot climates will establish whether some manufacturers must improve battery temperature regulation, use different battery chemistries, or restrict sales in hot climates.
ICE vehicle manufacturers have a good understanding of how long their products will perform, and this knowledge allows them to predict warranty costs. PEV manufacturers are still learning about battery longevity. As more PEVs enter the market, vehicle manufacturers have the chance to experiment with various warranties and battery maintenance contracts as they look for affordable ways to reassure and share risk among consumers that use these vehicles under real-world conditions. Vehicle leasing is becoming more popular and promoted by some manufacturers partly because this option allows a consumer to avoid long-term liability for a battery if over time the battery performance degrades below an acceptable level.
Finding: Concerns about the durability and performance of the current lithium-ion batteries at extremely high and low temperatures could be a barrier to PEV adoption, depending on the durability observed as more vehicles are driven for longer times.
RELATIVE COSTS OF PLUG-IN ELECTRIC AND ICE VEHICLES
Studies of current and projected costs of high-energy batteries and nonbattery components (EPA/NHTSA 2012) suggest that the difference in cost of producing a PEV and an ICE vehicle is (and will be) primarily due to the cost of the high-energy battery. Those studies are part of the regulatory analysis performed by EPA and the National Highway Traffic Safety Administration (NHTSA) for the recent 2017-2025 combined CAFE-GHG standards for light-duty vehicles. The comprehensive regulatory analysis includes vehicle-simulation modeling and detailed component cost analysis (cost teardown studies) performed by external consultants to determine cost and effectiveness of a wide range of technologies, including conventional ICE vehicles, HEVs, and PEVs. Thus, for its assessment, the committee relied on the CAFE-GHG regulatory analysis (EPA/NHTSA 2012), as well as on presentations from vehicle manufacturers, suppliers, and market analysts (Tamor 2012; Ward 2013; Woodard 2012; Sriramulu
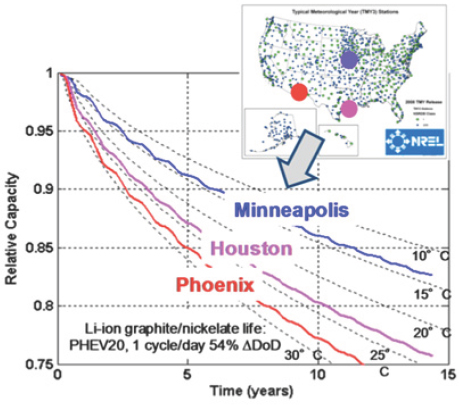
FIGURE 2-3 Effect of ambient temperature on battery capacity on a 20 kWh battery in a PHEV. NOTE: DoD, depth of discharge; PHEV, plug-in hybrid electric vehicle. SOURCE: Pesaran et al. (2013).
and Barnett 2013; Anderman 2014), because a detailed independent cost analysis was beyond its scope and resources. The committee also reviewed the cost information provided in Transitions to Alternative Vehicles and Fuels (NRC 2013). That committee estimated battery costs by assuming that future costs for Li-ion cells for vehicles would follow a similar, although slower, cost reduction trajectory as that experienced by Li-ion 18650 cells. Although cost projections were somewhat similar, this report makes use of the recent extensive analysis done specifically for the costs of vehicle Li-ion batteries. Costs of the batteries and nonbattery components are discussed below; vehicle price and cost of ownership are discussed further in Chapter 7.
Lithium-Ion Battery Costs
A high-energy battery costs much more than a sheet-metal gasoline tank. Studies of current and projected battery costs are summarized here to estimate the magnitude of the cost differential and whether it is likely to continue. Cost refers to what a vehicle manufacturer would pay a supplier, which is known as the direct manufacturing cost (DMC) (EPA/NHTSA 2012). What a consumer would pay for a battery (the retail price equivalent) is expected in the automotive industry to be about 50 percent more than what a vehicle manufacturer would pay (NRC 2011). Large price fluctuations must be expected until battery supply and demand for PEVs becomes more predictable. Until then, the price will likely depend strongly on the availability of unused battery production capacity and a manufacturer’s desire to be perceived as a technology leader. It might further depend on the willingness of the vehicle manufacturer to set a price that allows it to gain a market share for its vehicles.
Unfortunately, there are no definitive studies of battery costs from battery manufacturers given their need to protect proprietary information. The range of cost projections from studies of current and future battery costs is considerable. An additional complication is that vehicle manufacturers make different choices on how much of the total capacity of a battery is made available for use; GM uses about 70 percent of the nominal capacity, and Nissan uses about 90 percent (see Table 2-1).4 To allow comparisons, the committee converted study results to be the projected costs per kilowatt-hour of the total battery capacity rather than the available battery capacity. The costs estimated below are for complete battery packs, excluding any cooling system.
- A 2012 Argonne National Lab study projected costs to be between $251 and $280/kWh for a battery pack produced in 2020 converted to 2012 dollars (Nelson et al. 2011).
_____________
4 The values cited seem appropriate given that PHEV batteries could be cycled more times per trip than BEV batteries and that using a smaller portion of the nominal capacity increases battery life.
TABLE 2-3 Estimates of Dollars per Kilowatt-hour for a 25 kWh Battery
| Year | Manufacturing Volume (packs/year) | Cell Materials ($/kWh) | Cell Price ($/kWh) | Pack Price ($/kWh) |
| 2013 | 25,000 | 110-150 | 275-325 | 400-500 |
| 2016 | 50,000 | 90-130 | 185-230 | 275-350 |
| 2020 | 100,000 | 85-110 | 140-190 | 225-275 |
SOURCE: Based on data from Anderman (2014).
- TIAX projected that direct material and direct labor costs would amount to $310/kWh for an annual production volume of 300,000, a large number compared with U.S. PEV sales to date (Sriramulu and Barnett 2013).
- DOE has estimated a current cost of $240/kWh (Howell 2013).5
- EPA/NHTSA (2012) projected $540, $346, and $277/ kWh for a PHEV40 with a 16 kWh battery pack in 2017, 2020, and 2025, for an annual volume of 400,000.
- A 2011 McKinsey study estimated the costs to be $350 to $420/kWh; it predicted that these costs would drop to about $140/kWh by 2020 and $112/kWh by 2025 (Hensley et al. 2012).
- Anderman (2012) predicted that the cost for a 24 kWh battery pack in the 2015 time frame in volumes of 100,000 units would be $340 to $450/kWh.
- Anderman (2014) provided estimates of dollars per kilowatt-hour for a 25 kWh battery (see Table 2-3).
An attempt has been made to convert study results to cost per kilowatt-hour of the total energy that can be stored in the battery and to 2013 dollars (see Table 2-4).
The range of estimates in the current studies show that current costs are difficult to obtain and that the future projections are even more difficult, requiring, for example, an estimate of how many PEVs will be purchased. For the purposes of this report, the committee decided to use the $500/kWh as the current cost of the lithium-ion battery pack and about $250/kWh as the cost in about 10 years. Thus, at $500/kWh, the DMC of the Tesla battery would be $42,500, the DMC of the Leaf battery would be $12,000, the DMC of the Volt battery would be $8,250, and the DMC of the Plug-in Prius battery would be $2,200.
Figure 2-4 shows the decrease in costs of the Li-ion battery cell over the last 13 years and illustrates how Tesla has profited from the reduced prices for the small cell package used to power consumer electronics. The recent prices shown for Li-ion batteries in Figure 2-4 ($400/kWh) correspond to a cost of about $270/kWh if the assumption mentioned earlier is used that price is 1.5 times the cost. Some care is required in deducing cost from prices in recent years because battery manufacturers might be reducing prices to cope with having more production capability than demand. Some reports suggest that Tesla is paying much less for batteries from Panasonic. In addition, Tesla has announced plans to build a $5 billion battery factory and has stated that it believes it can substatially reduce battery costs (Trefis Team 2014). The committee does not have any information about how the cost reductions will be achieved, but the factory investment appears to be a strong indication that Tesla is confident that it can build high-energy batteries more economically than has so far been possible.
Finding: It is not possible to determine a completely reliable projection of future battery cost. However, given the available data, the committee assumed for this report a battery pack cost of $500/kWh in 2013 and a 50 percent lower cost in about 10 years.
Finding: The high cost of high-energy batteries is primarily responsible for the higher initial cost of PEVs compared with HEVs and ICE vehicles and is a barrier to PEV adoption.
Finding: Even if the higher initial battery cost drops as predicted over the next 10 years, battery cost will remain a barrier to PEV adoption.
Nonbattery Costs
An ICE vehicle includes an ICE, a radiator, a transmission, and an oil system. A BEV has instead an electric motor; power electronics that convert the direct current (dc) power from the battery to the alternating current (ac) power needed to drive the electric motor; and electronics needed to charge the battery. A PHEV includes both sets of components. The nonbattery costs of the PEV are primarily attributable to the power electronic controls and the electric motor and generators. The committee reviewed and accepted the estimates for nonbattery costs from the EPA/NHTSA (2012) study that was used to evaluate CAFE standards because it found that the cost analysis performed by the agencies was thorough and comprehensive.
The simplicity of a BEV compared with an ICE vehicle makes it somewhat surprising that the EPA/NHTSA (2012) study estimates that the direct manufacturing cost of the nonbattery components for a BEV with a range of 75 miles is about $1,255 higher than the cost of the ICE power-train components it replaces. The increased cost includes $3,810
_____________
5 A current cost estimated to be $300/kWh becomes $240/kWh for the total battery capacity, assuming that the original estimate was for an 80 percent utilization of the battery.
TABLE 2-4 Summary of Estimated Costs of Total Energy from Various Sources (2013 U.S.$/kWh)
| Source | Year | |||||
| Currenta | 2017 | 2020 | 2022 | 2025 | ||
| Argonne | ||||||
| 2000 | 250-706 | — | — | — | — | |
| 2012 | — | — | 50 kW = 336 | — | — | |
| 100 kW = 404 | ||||||
| TIAX 2013 | 310 | — | — | — | — | |
| DOE 2013 | 300 | — | — | 125 | — | |
| EPA/NHTSA 2012 | — | 540 | 346 | — | 277 | |
| McKinsey 2011 | 350-420 | — | 140 | — | 112 | |
| Anderman | ||||||
| 2012 | 340-450 | — | — | — | — | |
| 2014 | 400-500 | — | 220-275 | — | — | |
a Current as defined in the respective studies.
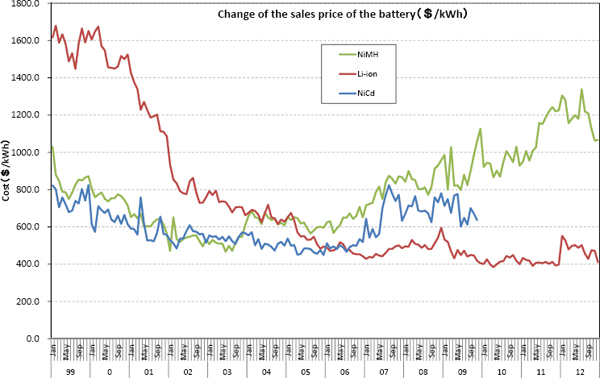
FIGURE 2-4 Change in the sales price of NiMH, Li-ion, and NiCd battery cells from 1999 to 2012. Prices are shown in 2012 dollars. The graph is based on data from a production survey conducted by the Ministry of Economy, Trade, and Industry, Japan. NOTE: kWh, kilowatt-hour; Li-ion, lithium ion; NiCd, nickel cadmium; NiMH, nickel-metal hydride. SOURCE: Maruyama (2013).
for the electric motor, inverter, high-voltage wiring, and improvements in the climate-control system. Those component costs are partially offset by the elimination of the ICE, transmission, and related components, which account for a savings of $2,555 in direct manufacturing costs (EPA/NHTSA 2012). The EPA/NHTSA estimates that the nonbattery costs in 2025 will drop to 80 percent of their 2012 costs. However, even if the cost reduction is less, the cost of the high-energy battery will still account for most of the difference in cost between a BEV and an ICE vehicle.
Because a PHEV has both an electric drive and an ICE, it has a higher nonbattery cost. The same study evaluated a PHEV with a 40-mile AER and concluded that a PHEV has nonbattery cost that is $3,700 higher than the nonbattery cost of an ICE vehicle. Multiplying by 1.5 increases the price to the consumer to $5,550 beyond the price of the battery.
A dramatic reduction in the price of power inverters could potentially come from the replacement of silicon-based semiconductors by wide bandgap materials, such as SiC and GaAs, that would enable faster switching and lower resistance to improve the inverter efficiency. Those materials operate at much higher temperatures than the silicon used in today’s power electronics, and that characteristic would make cooling easier and thereby reduce the size of the power electronics package and possibly simplify the heat exchangers (ORNL 2012). However, when such technology will be far enough along to come to market is difficult to predict.
Finding: Because power electronics and large electric motors are new to the automotive industry, nonbattery costs will likely drop substantially as new models come to market.
VEHICLE CHARGING AND CHARGING OPTIONS
Charging a PEV is analogous to filling a conventional vehicle’s fuel tank with gasoline. A gasoline-powered vehicle is attached to a pump that sends gasoline through a hose into the fuel tank. A typical flow rate of 8 gal/min, for example, means that typical gasoline tanks with capacities of 10 to 20 gal will be filled in a few minutes. Similarly, a PEV is plugged into the electric grid so that electricity can flow through wires into the battery. An energy flow rate of 6.6 kW, for example, would fill an empty battery with a usable capacity of 21 kWh in about 4 hours.
The maximum charging rate for residential charging is limited by the size of the charger in the vehicle that changes ac electricity into dc electricity. A fully discharged battery initially charges at the maximum rate that the onboard charger can manage and then charges more slowly as the battery nears capacity. Thus, a vehicle battery does not charge at a constant rate, and that is why it takes about 4 hours to fill a 21 kWh battery at 6.6 kW. For DC fast charging (discussed below), the component that changes ac to dc is outside the vehicle and is governed by control signals from the vehicle. Regulating the charging rate is necessary to ensure safety and to protect battery life. Although increasing the charging rate with high-power chargers shortens the time needed to charge a vehicle’s battery, an important technical issue now being researched is the extent to which faster charging at high power hastens the normal aging of a battery (Francfort 2013).
The “pressure” with which an electric circuit in a home or business can force electricity through wires into some device is measured in volts (V). The amount of electricity flowing through various devices, the electric current, is measured in amperes (A). The product of the two is the power in watts (W). Every circuit delivering electricity has a circuit breaker or fuse that keeps the flow of electricity from exceeding the amperes that the circuit can safely provide. For example, a 2014 Nissan Leaf is capable of accepting no more than 30 A of electric current when it is connected to a 240 V electric circuit, so its maximum power consumption is 7.2 kW. The vehicle will not accept more current or power even if the circuit is able to provide it. The circuit is protected by a 40 A circuit breaker, resulting in what is referred to as a 240 V, 40 A service.
As recommended by the National Electrical Code (NEC), an apparatus known as the electric vehicle supply equipment (EVSE) is always connected between the charging circuit and the vehicle to protect the people and the vehicle during charging. The purpose of the EVSE is to create two-way communication between vehicle and charger before and during charging to detect any anomalies that might affect safety or the equipment (Rawson and Kateley 1998). The NEC (2008) defines the EVSE as “the conductors, including the ungrounded, grounded, and equipment grounding conductors and the electric vehicle connectors, attachment plugs, and all other fittings, devices, power outlets or apparatus installed specifically for the purpose of delivering energy from the premise’s wiring to the electric vehicle” (Section 625.2). Its ground fault interrupters—like those in bathrooms and kitchens—are safety devices that can detect when a small electric current from the circuit has “gone missing” and disconnect the electric circuit and the current flow before anyone is injured. Furthermore, the EVSE is able to communicate with a vehicle to ensure that no current is provided before the vehicle is connected. The EVSE for slow charging via 120 V is typically a portable device that can be carried in the vehicle for possible use at remote locations. The EVSE for normal 240 V charging is typically mounted on a garage wall or on a purpose-built column. Fast chargers that use high dc voltages have the EVSE built into the substantial charger that is required.
For EVSEs connected to the single phase 120 V ac or the split-phase 240 V ac circuits that are commonly available in U.S. homes and workplaces, a plug wired to the EVSE connects to a socket on the vehicle. The circuit breaker or fuse sets the maximum current that the EVSE can provide, although individual vehicles will typically accept less current. In the United States, there is one standard plug that is used to charge vehicles from the normal 120 V and 240 V circuits found in residences, the SAE J1772 standard (SAE 2012).
This interchangeability removes what otherwise could be a substantial barrier to the adoption of PEVs. However, for faster charging options, fast chargers are being installed that have one or more of three incompatible plugs and protocols described below.
AC Level 1 Charging
Most electric devices in the United States (for example, lamps, small air conditioners, and computers) are plugged into single-phase 120 V ac electric circuits accessed via the wall sockets present in essentially every room of every building. Circuit breakers or fuses switch off the electricity if the current flowing through the circuit exceeds 15 to 20 A to prevent fires and other damage to the circuits.
AC level 1 charging standard is for an EVSE that plugs into a 120 V wall plug (Figure 2-5) and delivers up to 12 A to a SAE J1772 plug (Figure 2-6), which connects with a socket in the car. Most PEVs today have an onboard charger that changes the ac current into the dc current that charges the battery. The charger is able to accept only up to 12 A from the EVSE and transfer energy at a rate of up to 1.4 kW. Much like the largest window air conditioners that can be plugged into a 120 V circuit, the vehicle that is charging must typically be the only device drawing current from the circuit to avoid exceeding the maximum current that the circuit breaker or fuse will allow the circuit to provide.
PEVs are typically sold with a small and portable EVSE that can be carried in the car to allow AC level 1 charging from ubiquitous 120 V wall receptacles. A deficiency of the standard is that the portable EVSE is not secured to either the 120 V socket or to the vehicle to deter EVSE theft or vandalism. AC level 1 charging with this EVSE is the only charging option typically needed or available for the minimal PHEVs. Each hour of charging typically provides an additional electric range of about 4 to 5 miles, depending on the vehicle. For a range-extended PHEV, such as a Chevrolet Volt, some drivers use only AC level 1 charging, while others prefer to charge about twice as fast using the AC level 2 charging that is discussed below.
For charging the fully depleted batteries of PEVs with large batteries, AC level 1 charging is too slow to be the primary charging method because charging times could be longer than the time that a car is parked at the home or workplace. For example, with an AC level 1 charger, the nominal time for fully charging the usable 21 kWh capacity of a
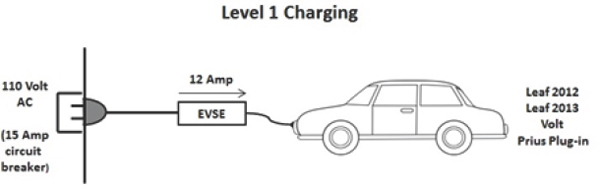
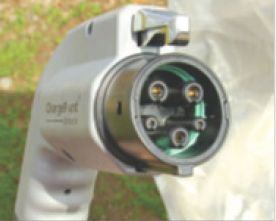
FIGURE 2-6 The SAE J1772 plug that connects all PEVs to AC level 1 and level 2 is an agreed-on universal standard for 120 V and 240 V ac charging. SOURCE: © Michael Hicks, licensed under Creative Commons 2.0 (CC-BY-2.0).
Nissan Leaf battery is more than 17 hours, and the nominal time to fully charge the 85 kWh battery of a Tesla Model S is more than 61 hours. However, AC level 1 charging could be useful in some cases to merely extend the range of those BEVs by a few miles if that is all that is needed.
AC Level 2 Charging
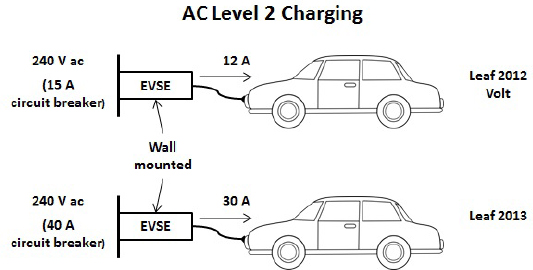
AC level 2 charging uses a 240 V, split-phase ac circuit (Figure 2-7). Such circuits are available in essentially all homes and workplaces and are used by electric dryers, electric stoves and ovens, and large air conditioners. Since 2009, the AC level 2 standard allows up to 80 A of current to be delivered for an energy transfer rate of 19 kW, although the wiring in many houses will have trouble delivering that much current, and only a long-range BEV is capable of accepting it. A Chevrolet Volt and a 2014 Nissan Leaf are able to accept a maximum of 12 A or 30 A, respectively, which corresponds to energy being transferred at maximum rates of 3.3 and 7.2 kW, respectively. As noted, the 240 V EVSE for AC level 2 charging is typically wall-mounted in a garage or on a post next to a parking spot, and in the United States, it is connected to the vehicle through the same SAE J1772 plug (Figure 2-6) used for AC leve1 1 charging.
The 85 kWh battery of the Tesla Model S, much larger than the battery in any other PEV, is the only vehicle battery so far that can accept the highest rated current and power from an AC level 2 charging system. The normal home charging recommendation is to deliver 40 A and nearly 10 kW to a “single” charger installed in the Tesla Model S. If enough current is available in a home, a “double” charger can instead be installed in the car to accept 80 A and 19 kW power for much faster charging. With that option, Tesla advertises that the car can travel an additional 58 miles for each hour of charging (Tesla 2014b). For emergency use, the Tesla Model S also supplies a portable EVSE with adapters that allow it to be charged using most of the common 240 V wall sockets that deliver 24 or 40 A to electric dryers, stoves, and air conditioners.
DC Fast Charging
Faster charging is generally carried out by supplying a high dc voltage directly to the battery. In this case, the charger that turns the ac electricity available from the grid into the dc electricity required to charge the battery is located in the EVSE rather than within the car. Such charging is only useful for limited-range and long-range BEVs, such as the Nissan Leaf and the Tesla Model S, and only BEVs are typically able to accept fast charging.
A proliferation of incompatible connector (and protocol) standards are used for the DC fast chargers. Four options are being offered worldwide (Figure 2-8), three of which are becoming increasingly available in the United States.
All fast chargers installed in the United States so far are CHAdeMO chargers with the exception of the Tesla superchargers.6 The Nissan Leaf accepts a CHAdeMO plug (Figure 2-8A), which provides the high voltage dc and control signals to the vehicle. A 44 kW CHAdeMO charger can charge a Nissan Leaf to 80 percent of its capacity in 30 minutes (see Figure 2-9).
The Tesla Model S accepts a proprietary fast-charging plug (Figure 2-8C), and charges are free at Tesla superchargers for models with an 85 kWh battery (that is, such charging is included in the purchase price of the vehicle). Existing 90 kW superchargers are being upgraded to 120 kW so that
_____________
6 In October 2014, the total number of CHAdeMO chargers worldwide was 4,180, with the following breakdown: Japan, 2,129; Europe, 1,327; United States, 700; and other, 24 (CHAdeMO 2014).
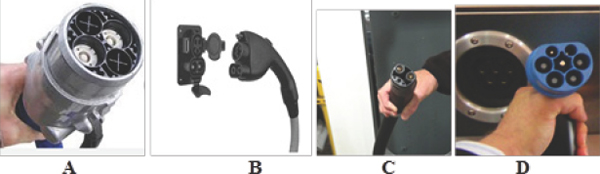
FIGURE 2-8 Four plugs and control protocols are now being used for DC fast charging: (A) the CHAdeMO plug that is used for the Nissan Leaf; (B) the SAE J1772 combo standard that is used on the BMW i3 and the Chevrolet Spark. The upper part of the connector is the same as the SAE J1772 plug that is used universally in the United States for AC level 2 charging (see Figure 2-6); (C) the proprietary Tesla plug that is used for the Tesla supercharger network; and (D) the Mennekes plug recently adopted by the European Union for use in Europe. SOURCE: (A) © C-Car-Tom, licensed under Creative Commons 3.0 (CC-BY-3.0); (B) SAE (2012), reprinted with permission from SAE J1772 Feb2012 © 2012 SAE International; and (D) © loremo, licensed under Creative Commons 2.0 (CC-BY-2.0).
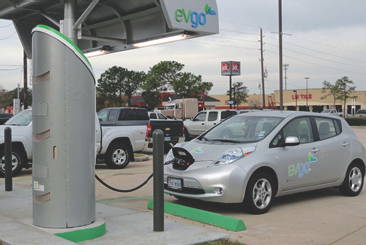
FIGURE 2-9 DC fast charging a Nissan Leaf. DC fast charging is able to charge a Nissan Leaf battery to 80 percent capacity in 30 min. The charge would typically allow a 2014 Nissan Leaf to travel about 67 miles. SOURCE: Copyright © 2010 by the eVgo Network, licensed under Creative Commons 2.0 (CC-BY-2.0).
the battery can be charged to 50 percent of its capacity in as little as 20 minutes. The announced goal is to install 250 units so that 98 percent of U.S. drivers are within 100 miles of a supercharger by the end of 2015 (Tesla 2014c). The locations of the superchargers are shown in Figure 2-10. Tesla chargers will not be available to drivers of other long-range BEVs when these become available.
The SAE added a dc and a ground lead to the SAE J1772 plug universally used for AC level 2 charging (Figure 2-6) to make a J1772 combo plug (Figure 2-8B). There are almost no installed combo chargers in the United States to date and few PEVs that are able to use them. However, the Chevrolet Spark and the BMW i3 that is just becoming available in the United States use them.
The European Union recently adopted the Mennekes (Masson 2013) plug (Figure 2-8D) for its 240 V AC level 2 standard for charging rates up to 39 kW. That standard is not discussed in detail because it is not expected to be used in the United States.
The variety of DC fast-charging plugs and communication protocols seems unfortunate. For long-range BEVs, the future situation could be like having separate networks of gasoline stations for ICE vehicles made by different manufacturers. It is not a big problem now in that the Tesla Model S is the only long-range BEV able to make long trips using the proprietary network of Tesla superchargers. As other manufacturers introduce long-range BEVs, however, they might need to introduce their own charger networks to compete. The United States and proactive states like California might be able to use their influence and incentives to make it possible to fast charge any PEV at any fast-charging station. The United States could raise the issue of compatible charger designs in free trade talks with the European Union and with its trading partners in Asia.
Finding: A network of fast-charging stations is currently being completed by Tesla without the use of public funds. However, it is a proprietary network that might not be avail-

FIGURE 2-10 As of February 2015, Tesla had installed 190 units in the United States. SOURCE: DOE (2015).
able for the use of all drivers when more long-range BEVs come to market.
Finding: The various plugs and communication protocols that are used across the world for charging PEVs are a barrier to the adoption of PEVs insofar as they prevent all PEVs from being able to charge at any fast-charging station.
Recommendation: The federal government and proactive states should use their incentives and regulatory powers to (1) eliminate the proliferation of plugs and communication protocols for DC fast chargers and (2) ensure that all PEV drivers can charge their vehicles and pay at all public charging stations using a universally accepted payment method just as any ICE vehicle can be fueled at any gasoline station. The Society of Automotive Engineers, the International Electrotechnical Commission, and the Verband der Elektrotechnik—companies that formed CHAdeMO—and Tesla should be included in the deliberations on plugs and communication protocols.
Wireless Charging
So far, essentially all PEVs are charged by plugging a charging cable into the vehicle so that electricity can flow from the EVSE to the battery. The process is simple and rapid (less than a minute), and control electronics are included to enhance safety.
Wireless charging would instead transfer the energy from the grid to the vehicle by using inductive coupling between a wireless transmitter located near the vehicle and a wireless receiver attached to the vehicle (Miller et al. 2014). An alternating magnetic field produced by passing ac current through coils in the wireless transmitter would induce a voltage in the coil of the receiver. The latter currents would charge the vehicle battery. Static and dynamic wireless charging are possible.
Static wireless charging takes place when the vehicle is not moving, as described. The energy transfer is less efficient than using a charging cable, but there would be no cable to handle or keep clean. For publicly available charging, standards would be needed to make it possible to charge most PEVs with most wireless charging systems. The opportunity for theft or vandalism of the cable or EVSE is greatly reduced because the transmitter could be embedded in the parking space and controlled remotely. A safety standard to establish the acceptable levels of oscillating electromagnetic fields might also be needed.
Dynamic wireless charging is a futuristic concept that is being investigated to see if it might ever be feasible (Miller et al. 2014). The vision is that a vehicle would receive power in its wireless receiver as it passed long series of wireless transmitters, so a BEV could be refueled on long trips without stopping to refuel. However, there are many technical problems to overcome for dynamic wireless charging, one of them being a very low charging efficiency.
Amine, K. 2010. “Advanced Battery Chemistries for PHEV and EV Applications.” Presentation at the U.S.- China Electric Vehicle and Battery Technology Workshop, Argonne, IL, August 30-September 1. http://www.transportation.anl.gov/batteries/us_china_conference/docs/roundtable1/adv_battery_chem_amine.pdf.
Anderman, M. 2012. “Energy Storage for xEVs: Status, Trends and Challenges.” Presentation at the 24th International AVL Powertrain Conference Engine and Environment, Graz, Austria, September 12.
Anderman, M. 2014. “Li-Ion Technology Evolution for xEVs: How Far and How Fast?” Presentation to the Committee on Overcoming Barriers to Electric-Vehicle Deployment, Irvine, CA, February 25.
Blanco, S. 2014. “Chevy Volt Owners Log Half a Billion Electric Miles, 2015 Production Starts.” Autoblog-Green, June 19. http://green.autoblog.com/2014/06/19/chevy-volt-half-billion-miles-2015-production/.
CCSE (California Center for Sustainable Energy). 2014. February 2014 Survey Report. http://energycenter.org/clean-vehicle-rebate-project/vehicle-owner-survey/feb-2014-survey.
CHAdeMO. 2014. “CHAdeMO’s Fast Charging Station in the World.” http://www.chademo.com. Accessed October 1, 2014.
Chernicoff, W.P. 2014. Perspectives on Electric Vehicles from Toyota. Presentation to the Committee on Overcoming Barriers to Electric-Vehicle Deployment, Irvine, CA, February 25.
Consumer Reports. 2014. “Tesla Model S 2013- 2014 Quick Take” [video file]. http://www.consumerreports.org/cro/video-hub/cars/hybrids--alternative-fuel/tesla-model-s-20132014-quick-take/14786539001/2366240882001/. Accessed March 28, 2014.
Daniel, C. 2014. “Lithium Ion Batteries and Their Manufacturing Challenges.” Presentation at NAE Frontiers of Engineering, Irvine, CA, September 11-13. http://www.naefrontiers.org/File.aspx?id=46415.
DOE (U.S. Department of Energy). 2012. 2011 Nissan Leaf -VIN 0356 Advanced Vehicle Testing—Beginning-of Test Battery Testing Results. Vehicle Technologies Program. http://www1.eere.energy.gov/vehiclesandfuels/avta/pdfs/fsev/battery_leaf_0356.pdf.
DOE. 2013. 2013 Chevrolet Volt-VIN 3929 Advanced Vehicle Testing—Beginning-of-Test Battery Testing Results. Vehicle Technologies Program. http://www1.eere.energy.gov/vehiclesandfuels/avta/pdfs/phev/battery_volt_3929.pdf.
DOE. 2015. “Alternative Fueling Station Locator.” Alternative Fuels Data Center. http://www.afdc.energy.gov/locator/stations/.
DOE/EPA (U.S. Department of Energy and U.S. Environmental Protection Agency). 2014a. “Compare Side-by-Side: 2014 Tesla Model S (85 kW-hr battery pack).” http://www.fueleconomy.gov/feg/Find.do?action=sbs&id=34775. Accessed January 26, 2015.
DOE/EPA. 2014b. “Compare Side-by-Side: 2014 Nissan Leaf.” http://www.fueleconomy.gov/feg/Find.do?action=sbs&id=34699. Accessed January 26, 2015.
DOE/EPA. 2014c. “Compare Side-by-Side: 2014 Ford Focus Electric.” http://www.fueleconomy.gov/feg/Find.do?action=sbs&id=34130. Accessed January 26, 2015.
DOE/EPA. 2014d. “Compare Side-by-Side: 2014 Chevrolet Volt.” http://www.fueleconomy.gov/feg/Find.do?action=sbs&id=33900. Accessed January 26, 2015.
DOE/EPA. 2014e. “Compare Side-by-Side: 2014 Toyota Prius Plug-in Hybrid.” http://www.fueleconomy.gov/feg/Find.do?action=sbs&id=34516. Accessed January 26, 2015.
Duoba, M. 2012. “Evaluating Plug-In Vehicles (PHEV & BEV) Using Standard Dynamometer Protocols.” Presentation at the 6th U.S.-China Electric Vehicles and Battery Technology Workshop, Boston, MA, August 22-24. http://www.cse.anl.gov/us-china-workshop-2012/pdfs/session4b_demos_standards/duoba_4B-2-Duoba-ANLStandardizing-Vehicle-Dyno-Test-Aug22-2012.pdf.
EPA (U.S. Environmental Protection Agency). 2012. “Six Common Air Pollutants.” http://www.epa.gov/oar/oaqps/urbanair. Accessed November 14, 2014.
EPA. 2014. “2014 Fuel Economy Datafile.” Office of Transportation and Air Quality. http://www.fueleconomy.gov/feg/download.shtml. Accessed January 26, 2015.
EPA/NHTSA (U.S. Environmental Protection Agency and National Highway Traffic Safety Administration). 2012. Joint Technical Support Document, Final Rulemaking 2017-2025 Light-Duty Greenhouse Gas Emission Standards and Corporate Average Fuel Economy Standards. Report No. EPA-420-R-12-901.
FHWA (Federal Highway Administration). 2011. Summary of Travel Trends: 2009 National Household Travel Survey. FHWA-PL-11-02. U.S. Department of Transportation. http://nhts.ornl.gov/2009/pub/stt.pdf.
Ford Motor Company. 2014. “2014 Ford Focus Electric Power and Handling.” http://www.ford.com/cars/focus/trim/electric/. Accessed January 26, 2015.
Francfort, J. 2013. “U.S. Department of Energy’s Vehicle Technologies Program. Plug-in Vehicles and Charging Infrastructure Usage Patterns: Lessons Learned from the First Two Years.” Presentation at SAE Government/Industry Meeting, Washington, DC, January 31. http://avt.inel.gov/pdf/prog_info/SAEGovtIndustryFeb2013.pdf.
Ge, M., X. Fang, J. Rong, and C. Zhou. 2013. Review of porous silicon preparation and its application for lithiumion battery anodes. Nanotechnology 24(42): 422001.
Goodenough, J.B., and K. Mizushima. 1981. “Electrochemical Cell with New Fast Ion Conductors.” U.S. Patent 4,302,518, filed March 31, 1980, and issued November 24, 1981.
Gordon-Bloomfield, N. 2013. “Nissan Testing New Battery Pack to Address Problems with LEAF in Hot Weather.” Plug-in Cars, August 26. http://www.plugincars.com/nissan-testing-new-battery-pack-leaf-128088.html.
Hensley, R., J. Newman, and M. Rogers. 2012. “Battery Technology Charges Ahead.” McKinsey Quarterly, July. http://www.mckinsey.com/insights/energy_resources_materials/battery_technology_charges_ahead.
Hidary, J. 2012. “New Models of Mobility and EV Deployment.” Presentation to the Committee on Overcoming Barriers to Electric-Vehicle Deployment, Washington, DC, December 18.
Howell, D. 2013. U.S. Battery R&D Progress and Plans. U.S. Department of Energy. http://energy.gov/sites/prod/files/2014/03/f13/es000_howell_2013_o.pdf.
Julien, C.M., A. Mauger, K. Zaghib, and H. Groult. 2014. Comparative issues of cathode materials for Li-ion batteries. Inorganics 2(1): 132-154.
Kam, K., and M. Doeff. 2012. Electrode materials for lithium ion batteries. Materials Matters 7(4). http://www.sigmaaldrich.com/technical-documents/articles/material-matters/electrode-materials-for-lithium-ion-batteries.html.
MacKenzie, A. 2013. “2013 Motor Trend Car of the Year: Tesla Model S Shocking winner: Proof Positive That America Can Still Make (Great) Things.” Motor Trend, January. http://www.motortrend.com/oftheyear/car/1301_2013_motor_trend_car_of_the_year_tesla_model_s/.
Maruyama, T. 2013. “Change of Sales Price of the Battery from January 1999 to September 2012.” Presentation to the Committee on Overcoming Barriers to Electric Vehicle Deployment, Tokyo, Japan, December 9.
Masson, L. 2013. “European Commission Backs Meenekes Type 2 Electric Car Plug.” Plug-in Cars, January 30. http://www.plugincars.com/european-commissionwants-act-help-evs-126265.html.
Miller, J.M, O.C. Onar, C. White, S. Campbell, C. Coomer, L. Seiber, R. Sepe, and A. Steyerl. 2014. Demonstrating dynamic wireless charging of an electric vehicle: The benefit of electrochemical capacitor smoothing. IEEE Power Electronics Magazine 1(1): 12-24.
NEC (National Electrical Code). 2008. NEC2008 National Electrical Code, Article 625. Electrical Vehicle Charging System Equipment, Section 625-2. http://www.freenec.com/T504.html.
Nelson, P.A., K.G. Gallagher, I. Bloom, and D.W. Dees. 2011. Modeling the Performance and Cost of Lithium-Ion Batteries for Electric-Drive Vehicles. No. ANL-12/55. http://www.cse.anl.gov/batpac/files/BatPaC%20ANL-12_55.pdf.
NRC (National Research Council). 2011. Assessment of Fuel Economy Technologies for Light-Duty Vehicles. Washington, DC: The National Academies Press.
NRC. 2013. Transitions to Alternative Vehicles and Fuels. Washington, DC: The National Academies Press.
NREL (National Renewable Energy Laboratory). 2013. “Plug-In Hybrid Electric Vehicles.” Vehicle Systems Analysis. http://www.nrel.gov/vehiclesandfuels/vsa/plugin_hybrid.html. Accessed March 14, 2013.
ORNL (Oak Ridge National Laboratory). 2012. Wide Band Gap Devices: Powering the Next Generation of Electric Traction Drive Systems. http://web.ornl.gov/sci/ees/transportation/pdfs/WBGBroch.pdf.
Pesaran A., S. Santhanagopalan, and G. Kim. 2013. “Addressing the Impact of Temperature Extremes on Large Format Li-Ion Batteries for Vehicle Applications.” Presentation at the 30th International Battery Seminar, Ft. Lauderdale, FL, March 11. http://www.nrel.gov/vehiclesandfuels/energystorage/publications.html.
Pham, H., M. Lee, K. Nam, E. Hwang, Y. Kwon, and S. Song. 2014. “High-Voltage Electrolyte Additive for High-Energy Lithium-Ion Batteries.” Presentation at the 17th International Meeting on Lithium Batteries, Como, Italy, June 13. https://ecs.confex.com/ecs/imlb2014/webprogram/Paper29242.html.
PolyPlus Battery Company. 2009. “Advanced Lithium Battery Technology.” http://www.polyplus.com/liair.html. Accessed October 25, 2013.
Rahman, M.A., X. Wang, and C. Wen. 2014. A review of high energy density lithium-air battery technology. Journal of Applied Electrochemistry 44(1): 5-22.
Rawson, M., and S. Kateley. 1998. “Electric Vehicle Charging Equipment Design and Health and Safety Codes.” California Energy Commission. Sacramento, CA, August 31. http://www.energy.ca.gov/papers/98-09-23_KATELEY.PDF.
SAE (Society of Automotive Engineers). 2012. “SAE Electric Vehicle and Plug in Hybrid Electric Vehicle Conductive Charge Coupler.” Standard Code: J1772, Revision B. SAE International, October 15. http://standards.sae.org/j1772_201210/.
Sakti, A., J. Michalek, E. Fuchs, and J. Whitacre. 2014. A techno-economic analysis and optimization of Li-ion batteries for light-duty passenger vehicle electrification. Journal of Power Sources 273: 966-980.
Schey, S. 2013. The EV Project: Q22013 Report. Electric Transportation Engineering Corporation. http://www.theevproject.com/cms-assets/documents/127233-901153.q2-2013-rpt.pdf.
Sion Power. 2014. “Technology Overview.” http://sionpower.com/technology.html. Accessed October 25, 2014.
Sriramulu, S., and B. Barnett. 2013. “Technical, Manufacturing, and Market Issues Associated with xEV Batteries.” Presentation to the Committee on Overcoming Barriers to Electric-Vehicle Deployment, Washington, DC, August 13.
Steffke, K., S. Inguva, D. Van Cleve, and J. Knockeart. 2008. “Accelerated Life Test Methodology for Li-Ion Batteries in Automotive Applications.” SAE Technical Paper 2013-01-1548, doi:10.4271/2013-01-1548.
Tamor, M. 2012. “Overcoming Barriers to Deployment of Electric Vehicles NAE Committee Discussion.” Presentation to the Committee on Overcoming Barriers to Electric Vehicle Deployment, Washington, DC, December 17.
Tesla. 2014a. “Increasing Energy Density Means Increasing Range.” http://www.teslamotors.com/roadster/technolgy/battery. Accessed on March 30, 2014.
Tesla. 2014b. “Charge Your Model S.” http://www.teslamotors.com/charging#/basics. Accessed November 14, 2014.
Tesla. 2014c. “100 Supercharger Stations.” http://www.teslamotors.com/blog/100-supercharger-stations.
Toyota Motor Corporation. 2014. “2014 Prius Plug-In.” http://www.toyota.com/content/ebrochure/2014/prius-plug-in_ebrochure.pdf.
Trefis Team. 2014. “Gigafactory Will Cost Tesla $5 Billion but Offers Significant Cost Reductions.” Forbes, March 11. http://www.forbes.com/sites/greatspeculations/2014/03/11/gigafactory-will-cost-tesla-5-billion-butoffers-significant-cost-reductions/.
Ward, J. 2013. “DOE Electric Vehicle Activities Update.” Presentation to the Committee on Overcoming Barriers to Electric-Vehicle Deployment, Washington, DC, August 13.
Woodard, T. 2012. “Overcoming Barriers to Electric-Vehicle Deployment Workshop Barriers to Deployment, an OEM Perspective.” Presentation to the Committee on Overcoming Barriers to Electric-Vehicle Deployment, Washington, DC, December 17.
Yoshino, A. 2012. The birth of the lithiumion battery. Angewandte Chemie International Edition 51(24): 5798-5800.