
Plug-in electric vehicles (PEVs) that derive all or some of their propulsion from an external electricity source have received critical attention in recent years. They are especially attractive because they have the potential to reduce greenhouse gas (GHG) emissions and to decrease petroleum consumption substantially, given that light-duty vehicles account for nearly half of the petroleum consumption in the United States today and that electricity is not typically generated from petroleum (EIA 2014). Globally, the demand for PEVs is growing, and some countries see them as an important element of their long-term strategy to meet environmental, economic, and energy-security goals. Although they hold great promise, there are also many barriers to their penetration into the mainstream market. Some are technical, such as the capabilities of current battery technologies that restrict their electric driving range and increase their purchase price compared with conventional vehicles; others are related to consumer behavior and attitudes; and still others are related to developing an infrastructure to support charging of the vehicles and addressing possible effects of the new charging infrastructure on the electric grid. Given the growing concerns surrounding the perceived barriers, Congress in its 2012 appropriations for the Department of Energy (DOE) requested that DOE commission a study by the National Academies to identify market barriers that are slowing the purchase of PEVs and hindering the deployment of supporting infrastructure.1 Accordingly, the National Research Council (NRC), which is a part of the National Academies, appointed the Committee on Overcoming Barriers to Electric-Vehicle Deployment, which prepared this final report.
The PEV is not a new invention of the twenty-first century. In 1900, 28 percent of the passenger vehicles sold in the United States were electric, and about one-third of the vehicles on the road in New York City, Boston, and Chicago were electric (Schiffer et al. 1994). The demise of PEVs resulted from the mass production of an inexpensive gasoline-powered vehicle (the Model T), the invention of an electric starter for the gasoline vehicle (which eliminated the need for a hand-crank), a supply of affordable gasoline, and the development of the national highway system, which allowed long-distance travel (Schiffer et al. 1994). In the 1970s, interest in PEVs resurfaced with the Arab oil embargo and the emerging environmental and energy security concerns. Over the next few decades, interest in PEVs waxed and waned as gasoline prices remained roughly constant. In the 1990s, interest in PEVs was revived by California’s zero-emission-vehicle (ZEV) policies but lagged again primarily because battery technology was not as advanced as it is today. Recent advances in battery and other technologies, new federal standards for carbon-dioxide (CO2) emissions and fuel economy, state requirements for zero-emission vehicles, and the current administration’s goal of putting millions of alternative-fuel vehicles on the road have reignited interest in PEVs.
Recent incentives to increase the number of PEVs on the road began with the Emergency Economic Stabilization Act of 2008, which provided a $2,500 to $7,500 tax credit for the purchase of PEVs (Public Law 110-343 §205). The American Recovery and Reinvestment Act of 2009 (Public Law 111-5 §1141) increased incentives for PEVs by expanding the list of vehicles that are eligible for a tax credit. It also appropriated $2 billion in grants for development of electric-vehicle batteries and related components (DOE 2009) and $2.4 billion in loans for electric-vehicle manufacturing facilities (DOE 2011). Along with private investors, DOE has invested $400 million to support infrastructure development, including demonstration projects involving 13,000 PEVs and 22,000 public and private charging points in 20 U.S. cities (DOE 2011). Furthermore, the DOE Office of Energy Efficiency and Renewable Energy (DOE 2013a) and several national laboratories, including Argonne National Laboratory (ANL 2011, 2012, 2013) and the National Renewable Energy Laboratory (NREL 2013), are conducting substantial research and development on electric-drive technologies for PEVs (NRC 2013a).
Various state-level efforts—such as consumer incentives that include tax credits for vehicle purchase, access to carpool lanes, free public parking, and emission-inspection exemptions—are aimed at increasing the number of PEVs
_____________
1 See Consolidated Appropriations Act, 2012, P.L. 112-74, H. Rept. 112-331 (H.Rept. 112-118).
on the road (DOE 2013b). Other efforts, such as reimbursements and tax incentives for purchasing or leasing charging equipment and low-cost loans for installation projects, are aimed at building the charging infrastructure (DOE 2013b). California's ZEV program is particularly important because of the size of the California motor-vehicle market. Each motor-vehicle manufacturer in the state is required to sell at least a minimum percentage of ZEVs (vehicles that produce no exhaust emissions of any criteria pollutant) and transitional ZEVs (vehicles that can travel some minimum distance solely on a ZEV fuel, such as electricity) (13 CCR §1962.1 [2013]). Nine states—Connecticut, Maine, Maryland, Massachusetts, New Jersey, New York, Rhode Island, Vermont, and Oregon—have also adopted the California ZEV program as part of their plans to meet federal ambient air quality standards.
The policies that promote early PEV deployment are aimed at benefits beyond near-term reductions in petroleum consumption and pollutant emissions. The strategy is to speed the long-term process of converting the motor-vehicle fleet to alternative energy sources by exposing consumers now to PEVs, by encouraging governments and service providers to plan for infrastructure, and by encouraging the motor-vehicle industry to experiment with product design and marketing. Gaining a major market share for PEVs will likely require advances in technology to reduce cost and improve performance, but the premise of the early deployment efforts is that market development and technology development that proceed in parallel will lead to earlier mass adoption than if technology advances are required before beginning market development. The early deployment efforts also might speed technology breakthroughs by maintaining visibility and interest in PEVs. The risk entailed by this strategy is that if PEV promotion efforts are premature relative to the development of the technology, the costs of the promotion will have had little benefit in the form of market development.
The motivation for pursuing PEV-deployment policies beyond their near-term benefit can be understood from the findings of another NRC report, Transitions to Alternative Vehicles and Fuels. The committee that prepared that report was asked to assess a range of vehicle technology options and to suggest strategies for attaining petroleum consumption and GHG reduction targets of 50 to 80 percent by the 2030-2050 timeframe (NRC 2013b). An important finding of that report is that major policy initiatives—such as tax incentives, subsidies, or regulations—are required to obtain such large-scale reductions. That conclusion is relevant for the current study because it provides context as to why federal policy (or an NRC study) might focus on barriers. If policy makers decide that such major reductions in petroleum consumption or GHG emissions are required to meet environmental and other goals, an understanding of the barriers and the strategies that are needed to overcome them will be required.
THE PLUG-IN ELECTRIC VEHICLE AND CURRENT SALES
This report focuses on light-duty vehicles (passenger cars and light-duty trucks) in the United States and restricts its discussion to PEVs, which include battery electric vehicles (BEVs)2 and plug-in hybrid electric vehicles (PHEVs).3 The common feature of these vehicles is that they can charge their batteries by plugging into the electric grid. The distinction between them is that BEVs operate solely on electricity stored in the battery (there is no other power source), and PHEVs have an internal-combustion engine (ICE) that can supplement the electric power train,4,5 PEVs are often defined by the number of electric miles that they can drive. A BEV that can drive 100 miles on one battery charge is designated as a BEV100; likewise, a PHEV that can drive 40 miles on one battery charge is designated as a PHEV40. A more detailed discussion of PEV technology is provided in Chapter 2 of this report.
Although a few makes and models of PEVs were available in the mid-1990s (for example, the General Motors EV1 and the Honda EV+, released in 1997; see UCS 2014), many consider the December 2010 introduction of the Nissan Leaf and Chevrolet Volt—the first mass-produced PEVs—to be the start of the viable commercial market for PEVs. Every few months, new PEVs have been added to the U.S. market, including a long-range BEV (the Tesla Model S); limited-range BEVs (such as the Daimler Smart EV and the BMW i3); range-extended PHEVs (such as the Ford Fusion Energi and the Ford C-Max Energi); and minimal PHEVs (such as the Toyota Plug-In Prius).6 Several manufacturers are also selling limited-volume BEVs, including the Ford Focus EV, the Honda Fit EV, the Fiat 500e, and the Chevrolet Spark to meet fuel-efficiency and ZEV regulatory requirements. In addition, a number of PEVs are not yet available in the United States, notably the Mitsubishi Outlander PHEV and a number of Renault BEVs and Volkswagen PHEVs.
Figures 1-1 and 1-2 show monthly sales for BEVs and PHEVs, respectively. PEV sales in the United States were about 56,000 units in 2012, 96,000 units in 2013, and
_____________
2 The term all-electric vehicle (AEV) is sometimes used instead of BEV.
3 BEVs and PHEVs need to be distinguished from conventional hybrid electric vehicles (HEVs), such as the Toyota Prius, which was introduced in the late 1990s. HEVs do not plug into the electric grid but power their batteries from regenerative braking and an internal-combustion engine. They are not included in the PEV category and are not considered further in this report except to make a comparison on some issue.
4 Several design architectures are available for PHEVs, and, depending on the design, the engine may be used to drive the vehicle directly or act as a generator to recharge the battery or both.
5 PHEVs can use engines powered by various fuels. This report, however, focuses on PHEV engines that are powered by gasoline because they are the ones currently available in the U.S. market.
6 PEV designations are discussed in detail in Chapter 2 of this report.
120,000 units in 2014 (Inside EVs 2015). Total U.S. vehicle sales in 2014 were nearly 16.5 million, a record year in which people were replacing their vehicles after not buying during the recession (Woodall and Klayman 2015).
In the U.S. market, PEV sales increased from 0.62 percent in 2013 to 0.76 percent in 2014 (Cobb 2014, 2015); total accumulated sales in the United States were about 291,000 vehicles by the close of 2014 (Inside EVs 2015). To put the U.S. sales data in perspective, Figure 1-3 shows that North America accounted for almost half of the world PEV sales in 2013. Worldwide sales of PEVs were about 132,000 in 2012, 213,000 in 2013, and 318,000 in 2014 (Pontes 2015). PEV sales have not yet been reported for some countries so this number could increase slightly.
The rate of market growth over the past 3 years has almost doubled each year, but sales started at a very low level. By way of comparison, hybrid electric vehicles (HEVs) were introduced in 1997 in Japan and in 1999 in the United States. Although HEVs have been more successful in Japan than in the United States—now at 20 percent of the total Japanese light-duty vehicle market (Nikkei Asian Review 2012) and over 50 percent of Toyota’s Japanese vehicle sales (Toyota 2014)—it took 13 years for HEVs to exceed 3 percent of annual new light-duty vehicle sales in the United States (Cobb 2013). However, in certain markets, such as California and Washington, HEVs comprise 10 percent of new passenger vehicle sales (see Chapter 3 for a discussion of factors that affect vehicle preferences). Figure 1-4 compares HEV and PEV sales over their first 34 months of having been introduced to the U.S. market and indicates that PEVs are penetrating the market faster than HEVs.
The California market has been particularly important and accounts for over one-third of annual PEV sales. At the close of 2014, PEV sales in California were 3.2 percent of new light-duty vehicle sales and 5.2 percent of new passenger vehicles (CNCDA 2015). California has a long history of strong sales for new vehicle technologies, especially HEVs as noted above. California is a favorable market for PEVs because it has many wealthy buyers of new technology, broad social support for PEVs in light of its history of air pollution, an active regulatory regime with purchase incentives and mandates for reducing carbon emissions and increasing PEV sales, and favorable weather that is easy on battery life and on charge available for vehicle miles. Furthermore, California has had a consistent, long-standing effort to provide basic Web-based and printed information resources on low-and zero-emission vehicles and to hold some ride-and-drive events. Those activities have likely contributed to greater public awareness of PEVs.
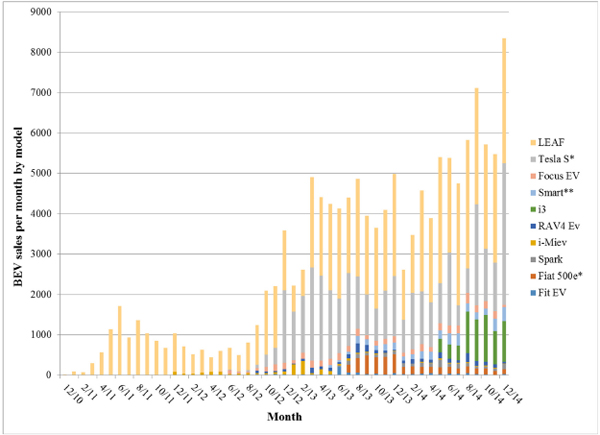
FIGURE 1-1 U.S. BEV monthly sales data from 2010 to 2014. NOTE: BEV, battery electric vehicle. SOURCE: Based on data from Inside EVs (2015).
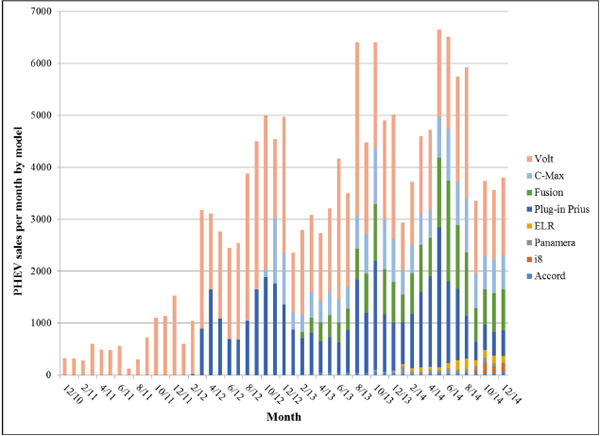
FIGURE 1-2 U.S. PHEV monthly sales data from 2010 to 2014. NOTE: PHEV, plug-in hybrid electric vehicle. SOURCE: Based on data from Inside EVs (2015).
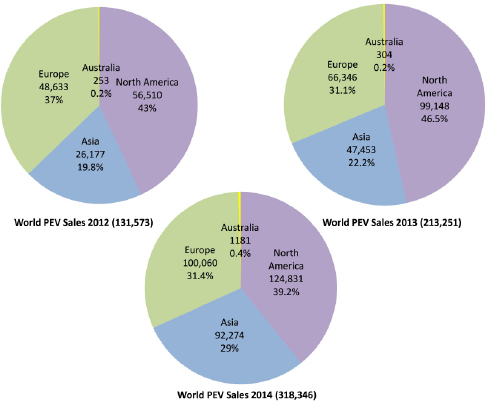
FIGURE 1-3 World PEV sales in 2012, 2013, and 2014. NOTE: PEV, plug-in electric vehicle. SOURCE: Based on data from Pontes (2015).
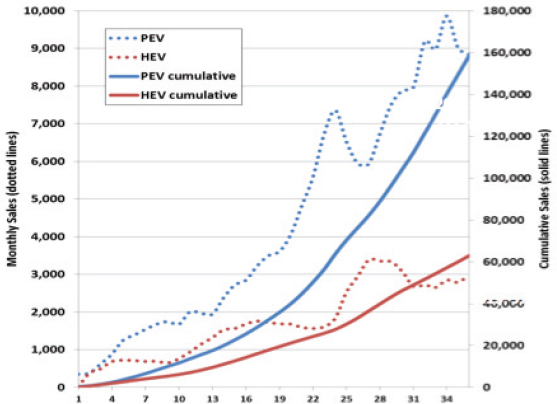
FIGURE 1-4 The rate of PEV market growth in its first 34 months superimposed on the rate of HEV market growth during its first 34 months. NOTE: HEV, hybrid electric vehicle; PEV, plug-in electric vehicle. SOURCE: DOE (2014).
As shown in Figure 1-5, other strong PEV markets are Washington, Oregon, Georgia, Maryland, Vermont, and Hawaii. Those markets have also been driven primarily by social sentiment (an environmentally friendly population base), financial incentives, and regulatory mandates for reducing carbon emissions.
Finding: HEV adoption, which entailed fewer technology changes than PEVs, required 13 years to exceed 3 percent of annual new light-duty vehicle sales in the United States.
Finding: PEVs have had higher sales than HEVs within the first 34 months of their introduction into the market, although the higher sales for PEVs could be the result of the various incentives that have been offered.
PLUG-IN ELECTRIC VEHICLES: BENEFITS AND TRADE-OFFS
PEVs offer several benefits over conventional vehicles. The most obvious for the owner are lower operating cost, less interior noise and vibration from the power train, often better low-speed acceleration, convenient fueling at home, and zero tailpipe emissions when the vehicle operates solely on its battery. BEVs have no conventional transmissions or fuel-injection systems to maintain, do not require oil changes, and have regenerative braking systems that greatly prolong the life of conventional brakes and thus reduce brake repair and replacement costs. On a large scale, PEVs offer the potential to reduce petroleum consumption and improve urban air quality; the degree to which PEVs affect pollutant emissions will depend on how the electricity that fuels a vehicle is generated, the degree to which charging of the vehicle is managed, and the degree to which emissions from power-generation sources are controlled (Peterson et al. 2011; see further discussion below). PEVs might also act as an enabler for renewable power generation by providing storage or rapid demand response through smart-grid applications.
PEVs, however, also have important trade-offs. Current limitations in battery technology result in restricted electric-driving range, high battery cost, long battery-charging time, and uncertain battery life. Concerns about battery safety, depending on the chemistry and energy density of the battery, have also arisen. PEVs have higher upfront costs than their conventional-vehicle counterparts and are available in only a few vehicle models. There is also a need to install a charging infrastructure to support PEVs whether at home, at work, or in a public space. Beyond the technical and economic barriers, people are not typically familiar with the capabilities of PEVs, are uncertain about their costs and benefits, and have diverse needs that current PEVs might not meet. If the goal is widespread deployment of PEVs, it is critical to identify and evaluate the barriers to their adoption.
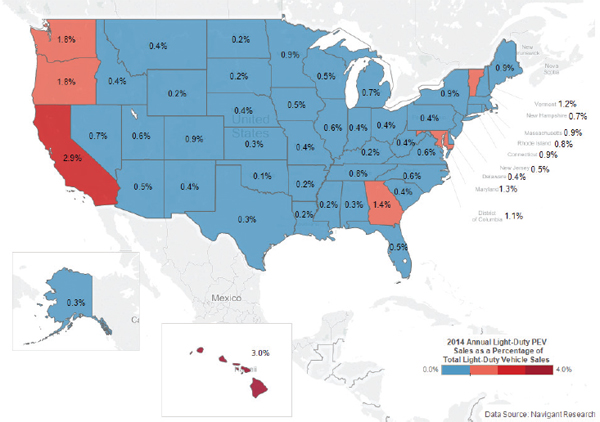
FIGURE 1-5 Projected annual light-duty PEV sales as a percentage of total light-duty vehicle sales. NOTE: PEV, plug-in electric vehicle. SOURCE: Data courtesy of Navigant Research in Shepard and Gartner (2014).
The committee included experts on vehicle technology, electric utilities, business and financial models, economics, public policy, and consumer behavior and response (see Appendix A for biographical information). As noted above, the committee was asked to identify market barriers that are slowing the purchase of PEVs and hindering the deployment of supporting infrastructure in the United States and to recommend ways to mitigate the barriers. The committee’s analysis was to be documented in two reports: an interim report and a final comprehensive report. The committee’s interim report was released May 2013 and identified infrastructure needs for electric vehicles, barriers to deploying that infrastructure, and possible roles for the federal government in overcoming the barriers. It did not make any recommendations because the committee was in its initial stages of gathering data. After release of the interim report, the committee continued to gather and review information and to conduct analyses. This final comprehensive report addresses the committee’s full statement of task, as shown in Box 1-1, and provides recommendations on ways to mitigate the barriers identified.
The premise of the statement of task is that there is a benefit to the United States if a higher fraction of miles driven in the United States is fueled by electricity rather than by petroleum and that PEV deployment will lead to this desired outcome. Two reasons are commonly assumed for the benefit. First, a higher fraction of miles fueled by electricity would reduce U.S. dependence on petroleum. Second, a higher fraction of miles fueled by electricity would reduce the amount of CO2 and other air pollutants emitted into the atmosphere. The committee was not asked to research and evaluate the premise for the statement of task, and it has not tried to do so. However, it is appropriate to summarize the scientific case on which the premise is based and ask if any recent developments might call the premise into question.
U.S. energy independence and security have been long-term U.S. goals. Every administration from Richard Nixon’s onward has proclaimed its importance. A PEV uses no petroleum onboard when it is being fueled by electricity, and in
An ad hoc committee will conduct a study identifying the market barriers slowing the purchase of electric vehicles (EVs, which for this study include pure battery electric vehicles [BEVs] and plug-in hybrid electric vehicles [PHEVs]) and hindering the deployment of supporting infrastructure in the United States. The study will draw on input from state utility commissions, electric utilities, automotive manufacturers and suppliers, local and state governments, the Federal Energy Regulatory Commission, federal agencies, and others, including previous studies performed for the Department of Energy (DOE), to help identify barriers to the introduction of electric vehicles, particularly the barriers to the deployment of the necessary vehicle charging infrastructure, and recommend ways to mitigate these barriers. The study will focus on light-duty vehicles but also draw upon experiences with EVs in the medium- and heavy-duty vehicle market segment. Specifically, the committee will:
- Examine the characteristics and capabilities of BEV and PHEV technologies, such as cost, performance, range, safety, and durability, and assess how these factors might create barriers to widespread deployment of EVs. Included in the examination of EV technologies will be the characteristics and capabilities of vehicle charging technologies.
- Assess consumer behaviors and attitudes towards EVs and how these might affect the introduction and use of EVs. This assessment would include analysis of the possible manner by which consumers might recharge their vehicles (vehicle charging behaviors, e.g., at home, work, overnight, frequency of charging, time of day pricing, during peak demand times, etc.) and how consumer perceptions of EV characteristics will impact their deployment and use.
- Review alternative scenarios and options for deployment of the electric vehicle infrastructure, including the various policies, including tax incentives, and business models necessary for deploying and maintaining this infrastructure and necessary funding mechanisms. The review should include an evaluation of the successes, failures, and lessons learned from EV deployment occurring both within and outside the United States.
- Examine the results of prior (and current) incentive programs, both financial and other, to promote other initially uneconomic technologies, such as flex-fuel vehicles, hybrid electric vehicles, and now PHEVs/BEVs to derive any lessons learned.
- Identify the infrastructure needs for the electricity sector, particularly the needs for an extensive electricity charging network, the approximate costs of such an infrastructure, and how utility investment decision making will play into the establishment of a charging network. As part of this assessment, the committee will identify the improvements in the electricity distribution systems needed to manage vehicle charging, minimize current variability, and maintain power quality in the local distribution network. Also, the committee will consider the potential impacts on the electricity system as a whole, potentially including: impacts on the transmission system; dispatch of electricity generation plants; improvements in system operation and load forecasting; and use of EVs as grid-integrated electricity storage devices.
- Identify the infrastructure needs beyond those related to the electricity sector. This includes the needs related to dealer service departments, independent repair and maintenance shops, battery recycling networks, and emergency responders.
- Discuss how different infrastructure deployment strategies and scenarios might impact the costs and barriers. This might include looking at the impacts of focusing the infrastructure deployment on meeting the needs for EVs in vehicle fleets, where the centralization of the vehicle servicing might reduce the costs for deploying charging infrastructure or reduce maintenance issues, or focusing the infrastructure deployment on meeting the needs for EVs in multi-family buildings and other high-density locations, where daily driving patterns may be better suited to EV use than longer commutes from single family homes in lower density areas. This might also include looking to the extent possible of how the barriers and strategies for overcoming barriers may differ in different U.S. localities, states, or regions.
- Identify whether there are other barriers to the widespread adoption of EVs, including shortages of critical materials, and provide guidance on the ranking of all barriers to EV deployment to help prioritize efforts to overcome such barriers.
- Recommend what roles (if any) should be played by the federal government to mitigate those market barriers and consider what federal agencies, including the DOE, would be most effective in those roles.
- Identify how the DOE can best utilize the data on electric vehicle usage already being collected by the department.
The committee’s analysis and methodologies will be documented in two NRC-approved reports. The study will consider the technological, infrastructure, and behavioral aspects of introducing more electric vehicles into the transportation system. A short interim report will address, based on presentations to the committee and the existing literature, the following issues:
- The infrastructure needs for electric vehicles;
- The barriers to deploying that infrastructure; and
- Optional roles for the federal government to overcome these barriers, along with initial discussion of the pros and cons of these options.
The final report will discuss and analyze these issues in more detail and present recommendations on the full range of tasks listed in Items (1) to (10) for the full study. The final report will include consideration of the infrastructure requirements and barriers as well as technological, behavioral, economic, and any other barriers that may slow the deployment of electric vehicles, as well as recommendations for mitigating the identified market barriers. It is envisioned that the committee will hold meetings in different locations around the United States, as well as collect information on experiences in other countries, in order to collect information on different approaches being taken to overcoming the barriers to electric vehicle deployment and its supporting charging infrastructure.
2013, less than 0.7 percent of the U.S. grid electricity was produced from petroleum.7 Thus, widespread adoption of PEVs would lead to a large decrease in petroleum use. There is a modest caveat, however, to that conclusion. U.S. petroleum consumption in the light-duty vehicle fleet is regulated by National Highway Traffic Safety Administration (NHTSA) through its Corporate Average Fuel Economy (CAFE) program (see Chapter 7 for a detailed discussion). CAFE standards are based on average fuel economy of a manufacturer’s vehicle fleet, so reductions in fuel use attributed to the sale of a single PEV could be offset by the sale of an ICE vehicle8 that consumes more fuel, resulting in no net fuel savings from PEV deployment (Gecan et al. 2012). However, petroleum consumption might still be reduced by PEV deployment because the CAFE program underestimates the petroleum-reduction benefit of PEVs. Specifically, the factor used by the CAFE program to calculate a fuel-economy rating for compliance is equivalent to assuming that 15 percent of the electrical energy used by a PEV is generated from petroleum, which is clearly an overestimate of the petroleum used by the U.S. electric sector (EPA/NHTSA 2012, p. 62821). Moreover, successful deployment of PEVs would help to enable the implementation of increasingly stringent CAFE standards, resulting in lower petroleum consumption, as noted by the Congressional Budget Office (Gecan et al. 2012).
In addition to reduced petroleum consumption, lower GHG emissions are noted as a reason for PEV deployment. A series of authoritative scientific reports (IPCC 2014; NCA 2014; NRC 2014) stress that the emission of GHGs, particularly CO2, is contributing in a measurable way to global warming and urge the United States to reduce its CO2 emissions. Because light-duty vehicles were responsible for 17.4 percent of total U.S. GHG emission in 2012 (EPA 2014a), reducing GHG emissions from the light-duty vehicle fleet is seen as an important approach for reducing overall GHG emissions. A vehicle completely powered by electricity from the U.S. electric grid is often called a zero-emission vehicle (ZEV) insofar as it emits no CO2 or other pollutants from its tailpipe. However, whether PEVs reduce total U.S. emissions of CO2 and other GHGs depends on the emissions associated with the production of the grid electricity that the vehicles use and, in the case of PHEVs, on tailpipe emissions. Estimation of the emissions attributed to a vehicle whether operating on gasoline or electricity is often referred to as a well-to-wheels analysis.9 For a gasoline vehicle, a well-to-wheels analysis would consider emissions from fossil fuel extraction, refining, and transportation, as well as tailpipe emissions from onboard fuel combustion. For a PEV, a well-to-wheels analysis would include emissions associated with electricity generation, such as extraction of fuels, their transportation, and the transmission of the electricity. For PHEVs, a well-to-wheels analysis would be a weighted average of the emissions from electricity-fueled and petroleum-fueled operation.
There are several (often conflicting) methods to evaluate well-to-wheels GHG emissions of vehicles. One method is to use well-to-wheels emission factors produced by DOE. Given that method, an analysis of the 30 mpg 2014 Chevrolet Cruze (an ICE vehicle), the 50 mpg 2014 Toyota Prius (one of the cleanest HEVs), and the Nissan Leaf BEV charged on the 2010 U.S. average electricity-generation mix shows that the Cruze, Prius, and Leaf produce GHGs of 369 g/mi, 222 g/mi, and 200 g/mi, respectively.10 Accordingly, the operation of the BEV is estimated to produce about 46 percent less GHG than the ICE vehicle and 10 percent less GHG than the best hybrid. If one considered cleaner electricity sources (for example, ones in California or Washington, where large numbers of PEVs are purchased), the BEV would produce only about half of the GHG of the best HEV (DOE 2015). Well-to-wheels analyses of this type have been reported for average GHG emissions within each grid subregion as defined by the U.S. Environmental Protection Agency (EPA) (Anair and Mahmassani 2012).
An alternative analysis examines the emissions attributed to PEV charging by taking into account not only the average emissions at a given location, but also the variation in emissions due to time of day and the type of generation added to provide the additional electricity needed for charging. Analyses of this type differ on the emissions resulting from PEVs, depending on the modeling approach and the time frame used. On the one hand, EPA in its latest rulemaking for light-duty CO2 standards found that the additional power plants used to meet PEV load in the 2022-2030 time frame would have lower emissions than the national average power plant at that time (EPA/NHTSA 2012, p. 62821). On the other hand, a model that attempts to simulate emissions from today’s grid using older data from 2007 to 2009 suggests that the marginal emission rates for PEV charging might be higher than the average power plant emissions and in the worst case might even be higher than emissions attributed to HEVs and ICE vehicles (Graff Zivin 2014).
Another factor to consider is the treatment of GHG emissions from PEVs under the joint CAFE-GHG standards (see Chapter 7 for a more detailed discussion). Similar to the CAFE program requirement for a fleetwide average fuel economy, fleetwide average GHG emission rates are restricted to a certain average grams of CO2 per mile. Therefore, lower PEV emission rates are averaged with higher emission rates from ICE vehicles. If, however, standards become increasingly more stringent, PEV sales might be needed
_____________
7 Estimate calculated from data reported in EIA (2013), Short Term Energy Outlook.
8 For this report, ICE vehicle or conventional vehicle refers to a light-duty vehicle that obtains all of its propulsion from an internal-combustion engine.
9 A more complete analysis is a lifecycle assessment that, in addition to the well-to-wheels assessment, includes environmental impacts from vehicle production (all aspects), vehicle use, and disposal of the vehicle at the end of its life.
10 The latest data for ICE tailpipe emissions and for the “upstream emissions” of GHGs (CO2 equivalent) to produce electricity from the 2010 U.S. electricity grid are available at www.fueleconomy.gov.
to meet them, and early deployment of PEVs encouraged through incentives might allow the implementation of more stringent GHG standards in the future. To encourage PEV deployment in the near term, EPA temporarily allows the portion of PEV miles that are estimated to be driven on electricity to be treated as zero emissions and lets a single PEV count as more than one vehicle. That favorable treatment creates a short-term trade-off in GHG emissions that is anticipated to bring long-term benefits from PEV deployment.
Emissions attributed to PEV operation might change over time with changes in emissions from electricity generation. The United States has reduced its GHG emissions over the last several years by converting some of its electricity production from coal to natural gas. The result is that, on average, a PEV fueled by electricity is now responsible for less GHG per mile driven. Well-to-wheels emissions must continue to consider the evolving understanding of upstream methane emissions from coal and natural gas production and distribution (EPA 2014b). The substantial reductions in U.S. GHG emissions from electricity generation are expected to continue for some time, especially if the proposed EPA GHG regulations of new and existing power plants and oil and gas wells are enacted. Thus, PEVs will make further reductions in GHG emissions as the U.S. electric grid changes to lower carbon sources for its electricity—a fact that is sometimes overlooked. And PEVs fueled on electricity have the potential to produce no well-to-wheels emissions if the electricity is generated from carbon-free sources. That is not the case for even the most efficient petroleum-fueled ICE vehicles. If the United States intends to reach low levels of GHG emissions (80 percent reduction), large-scale adoption of PEVs is one viable option (NRC 2013b).
The committee concludes that the premise for the statement of task—that there is an advantage to the United States if a higher fraction of the miles driven here is fueled from the U.S. electric grid—is valid now. The advantage becomes even greater each year that the United States continues to reduce the GHGs that it produces in generating electricity.
Finding: The average GHG emissions for which PEVs are responsible are currently lower than emissions from even the cleanest gasoline vehicles and will be further reduced as the electricity for the U.S. grid is produced from lower carbon sources.
Recommendation: As the United States encourages the adoption of PEVs, it should continue to pursue in parallel the production of U.S. electricity from increasingly lower carbon sources.
The committee notes that the use of HEVs rather than ICE vehicles would provide a large reduction in U.S. petroleum use and emissions. If their small market share could be substantially increased, the many types of HEVs already on the market could rapidly bring about substantial reductions in petroleum use and emissions in the time that a comparable variety of PEVs are brought to market. Accordingly, the focus in this report on PEVs should not be misinterpreted so as to keep policy makers from encouraging the switch from ICE vehicles to HEVs.
THE COMMITTEE’S APPROACH TO ITS TASK
Ten meetings were held over the course of this study. Seven meetings included open sessions during which the committee heard from the sponsor and invited speakers representing national laboratories, state agencies, university centers, vehicle manufacturers and dealers, and other private industries and consultants (see Appendix B for a list of speakers from all the open sessions). Committee subgroups also visited several sites in this country and abroad, including Texas, Japan, Germany, and the Netherlands, to gather information on electric-vehicle programs. On those trips, the committee members met with national and regional government officials, automobile manufacturers, charging companies, and other relevant organizations. On the basis of information received at its meetings, its on-site visits, and from the literature, the committee prepared this final report.
As discussed above, the committee accepted its charge and is not debating the merits of promoting, enabling, or increasing PEV adoption. This report focuses on ways to extend the market from “early adopters” to more mainstream customers. Early-market customers for PEVs tend to base their purchase decisions more on personal values and less on purchase price. In contrast, mainstream-market customers tend to weigh price and overall vehicle utility more heavily in their purchase decisions.
One final issue concerns the rapidly changing market and the various factors that hinder the adoption of PEVs—particularly the price of gasoline. Wide fluctuations in gasoline prices, as occurred over the course of this study, affected the committee’s comparisons and conclusions about the cumulative costs of vehicle ownership. As discussed in Chapter 7, gasoline prices are an important factor in determining the benefits of PEV ownership and can provide an incentive or a disincentive for purchasing a PEV. To address the issue of fluctuating gasoline prices, the committee decided that the best approach was to use a range of gasoline prices, from $2.50 to $4.00, in its calculations, to present ranges as appropriate throughout its report, and to draw conclusions based on these ranges.
This final report is organized into seven chapters and three appendixes. Chapter 2 discusses the current characteristics and capabilities of PEV technologies. Chapter 3 provides a brief assessment of consumer behavior and attitudes
toward PEVs and how they are affecting PEV deployment. Chapter 4 discusses what can be done to improve institutional support for PEV deployment. Chapter 5 provides an in-depth discussion of the charging infrastructure needed for PEV deployment, and Chapter 6 evaluates the ability of the electric infrastructure to meet the increased electricity demand in light of the new charging infrastructure. Chapter 7 discusses ways to motivate the consumer. Appendix A provides biographical information for committee members, Appendix B lists the meetings and the presentations made in open sessions, and Appendix C provides some information on international programs to support PEV deployment.
Anair, D., and A. Mahmassani. 2012. State of Charge: Electric Vehicles’ Global Warming Emissions and Fuel-Cost Savings across the United States. Union of Concerned Scientists. http://www.ucsusa.org/assets/documents/clean_vehicles/electric-car-global-warming-emissions-report.pdf.
ANL (Argonne National Laboratory). 2011. “Hybrid Vehicle Technology.” http://www.transportation.anl.gov/hev/index.html. Accessed March 14, 2013.
ANL. 2012. “Advanced Battery Research, Development, and Testing.” http://www.transportation.anl.gov/batteries/index.html. Accessed March 14, 2013.
ANL. 2013. “Argonne Leads DOE’s Effort to Evaluate Plug-in Hybrid Technology.” http://www.transportation.anl.gov/phev/index.html. Accessed March 14, 2013.
CNCDA (California New Car Dealers Association). 2015. California Auto Outlook: Fourth Quarter 2014. Volume 11, Number 1, February. http://www.cncda.org/CMS/Pubs/Cal_Covering_4Q_14.pdf.
Cobb, J. 2013. “December 2012 Dashboard.” Hybrid Cars, January 8. http://www.hybridcars.com/december-2012dashboard.
Cobb, J. 2014. “August 2014 Dashboard.” Hybrid Cars, September 4. http://www.hybridcars.com/august-2014dashboard/.
Cobb, J. 2015. “December 2014 Dashboard.” Hybrid Cars, January 6. http://www.hybridcars.com/december-2014dashboard/.
DOE (U.S. Department of Energy). 2009. Recovery Act—Electric Drive Vehicle Battery and Component Manufacturing Initiative. Funding Opportunity No. DE-FOA-0000026. http://www1.eere.energy.gov/vehiclesandfuels/pdfs/defoa-0000026-000001.pdf.
DOE. 2011. One Million Electric Vehicles by 2015: February 2011 Status Report. http://www1.eere.energy.gov/vehiclesandfuels/pdfs/1_million_electric_vehicles_rpt.pdf.
DOE. 2013a. “Hybrid and Vehicle Systems.” Vehicle Technologies Office. http://www1.eere.energy.gov/vehiclesandfuels/technologies/systems/index.html. Accessed March 14, 2013.
DOE. 2013b. “State Laws and Incentives.” Alternative Fuels Data Center. http://www.afdc.energy.gov/laws/state. Accessed January 29, 2013.
DOE. 2014. Presentation at the NEXTSteps Symposium, University of California, Davis.
DOE. 2015. “Greenhouse Gas Emissions for Electric and Plug-In Hybrid Electric Vehicles.” http://www.fueleconomy.gov/feg/Find.do?zipCode=90001&year=2014&vehicleId=34699&action=bt3.
EIA (U.S. Energy Information Administration). 2013. Short-Term Energy Outlook. http://www.eia.gov/forecasts/steo/archives/dec13.pdf.
EIA. 2014. Annual Energy Outlook 2014. http://www.eia.gov/forecasts/aeo/. Accessed September 24, 2014.
EPA (U.S. Environmental Protection Agency). 2014a. Inventory of U.S. Greenhouse Gas Emissions and Sinks: 1990-2012. EPA 430-R-14-003. http://www.epa.gov/climatechange/Downloads/ghgemissions/US-GHG-In-ventory-2014-Main-Text.pdf.
EPA. 2014b. Regulatory Impact Analysis for the Proposed Carbon Pollution Guidelines for Existing Power Plants and Emission Standards for Modified and Reconstructed Power Plants. EPA-452/R-14-002. http://www2.epa.gov/sites/production/files/2014-06/documents/20140602ria-clean-power-plan.pdf.
EPA/NHTSA (U.S. Environmental Protection Agency and National Highway Traffic Safety Administration). 2012. 2017 and Later Model Year Light-Duty Vehicle Greenhouse Gas Emissions and Corporate Average Fuel Economy Standards. Federal Register 77(199): October. http://www.gpo.gov/fdsys/pkg/FR-2012-10-15/pdf/201221972.pdf.
Gecan, R., J. Kile, and P. Beider. 2012. Effects of Federal Tax Credits for the Purchase of Electric Vehicles. Congressional Budget Office. http://www.cbo.gov/sites/default/files/cbofiles/attachments/09-20-12-ElectricVehicles_0.pdf.
Graff Zivin, J.S., M.J. Kotchen, and E.T. Mansur. 2014. Spatial and temporal heterogeneity of marginal emissions: implications for electric cars and other electricity-shifting policies. Journal of Economic Behavior & Organization 107: 248-268.
Inside EVs. 2015. “Monthly Plug-in Sales Scorecard.” http://insideevs.com/monthly-plug-in-sales-scorecard/.
IPCC (Intergovernmental Panel on Climate Change). 2014. Fifth Assessment Report. http://www.ipcc.ch/report/ar5/index.shtml.
NCA (National Climate Assessment). 2014. “Climate Change Impacts in the United States.” U.S. Global Change Research Program, Washington, DC. http://nca2014.globalchange.gov.
Nikkei Asian Review. 2012. “Hybrids 19.7% of New Cars Sold in May 2012 in Japan.” Integrity Exports, June 8. http://integrityexports.com/2012/06/08/hybrids-19-7-of-new-cars-sold-in-ma-in-japan/. Accessed June 10, 2012.
NRC (National Research Council). 2013a. Review of the Research Program of the U.S. DRIVE Partnership: Fourth Report. Washington, DC: The National Academies Press.
NRC. 2013b. Transitions to Alternative Vehicles and Fuels. Washington, DC: The National Academies Press.
NRC. 2014. Climate Change: Evidence and Causes. Washington, DC: The National Academies Press.
NREL (National Renewable Energy Laboratory). 2013. “Plug-In Hybrid Electric Vehicles.” Vehicle Systems Analysis. http://www.nrel.gov/vehiclesandfuels/vsa/plugin_hybrid.html. Accessed March 14, 2013.
Peterson, S.B., J.F. Whitacre, and J. Apt. 2011. Net air emissions from electric vehicles: The effect of carbon price and charging strategies. Environmental Science and Technology 45(5): 1792-1797.
Pontes, J. 2015. “World Top 20 December 2014.” EV Sales, January 31. http://ev-sales.blogspot.com/2015/01/world-top-20-december-2014-special.html.
Schiffer, M.B., T.C. Butts, and K.K. Grimm. 1994. Taking Charge: The Electric Automobile in America. Washington, DC: Smithsonian Institution Press.
Shepard, S., and J. Gartner. 2014. Electric Vehicle Geographic Forecasts. Navigant Research. Boulder, CO.
Toyota. 2014. “Worldwide Sales of Toyota Hybrids Top 6 Million Units.” News release. January 14. http://corporatenews.pressroom.toyota.com/releases/worldwide+toyota+hybrid+sales+top+6+million.htm.
UCS (Union of Concerned Scientists). 2014. “Electric Vehicle Timeline: Electric Cars, Plug-In Hybrids, and Fuel Cell Vehicles.” http://www.ucsusa.org/clean_vehicles/smart-transportation-solutions/advanced-vehicle-technologies/electric-cars/electric-vehicle-timeline.html.
Woodall, B., and B. Klayman. 2015. U.S. auto sales end 2014 strong but slower growth looms. Reuters, January 5. http://www.reuters.com/article/2015/01/05/us-autossales-usa-idUSKBN0KE0WH20150105.


