
4
Evaluating the Decennial Census: Past Experience
Evaluation of the decennial census is an important element of the census process. Not only does it provide users with some understanding of the limitations of the information provided, but also the Census Bureau uses the results to help improve the census methodology for administration of the next census. This chapter describes the various methods that have been used in the United States to evaluate the completeness of coverage in decennial censuses and what is known about the strengths and weaknesses of each method. It also provides information on comparable experience with coverage evaluation in Canada.
Errors in the census can be classified as coverage error or content error. Coverage errors are those that affect the population count and include cases of omission from the census of housing units and persons as well as cases of erroneous enumeration or inclusion. Omissions of persons can occur, among other reasons, because occupied housing units—and hence all of their residents—are inadvertently overlooked or are believed to be nonresidential or vacant at the time of the census, because individual members of a household are not reported by the household, because persons with more than one usual place of residence, such as college students away from home or persons with a vacation home, are not counted at either address, and because some persons do not have usual places of residence as the term is commonly used. Erroneous enumerations also can occur for many reasons, for example, because persons who moved between Census Day and field follow-up are enumerated at both locations, because persons with more than one usual residence are enumerated more than once, because “out of scope” persons, such as those who were born or migrated
to the United States after Census Day or were temporary visitors to the United States, are counted, because of fictitious questionnaires filled out by interviewers (“curbstoning”), and so on. Typically, questionnaires using information from neighbors, landlords, etc. (“last resort” and “close-out” cases), rather than actual contact with residents, are not treated as coverage errors unless, upon checking in a coverage evaluation program, the information turns out to have been erroneous.
Net coverage error is the difference between total (gross) omissions from the census and total (gross) erroneous inclusions. The main goals of coverage evaluation programs are to measure the net coverage error for the total population of the nation and, when possible, for important demographic subgroups and subnational geographic areas.
Content error includes errors in reported characteristics such as age and income. Estimates of net coverage error for particular population groups in the census often reflect the joint effects of enumeration error and content reporting error. For example, estimates of the net coverage of a particular age group will include the effects both of net coverage of people in the age group and of the net transfer of people to and from the age group as a result of age misreporting.
Census error evaluation studies are carried out for a number of purposes. Historically, evaluation results—both estimates of coverage and content errors—have been used to help improve the methodology for subsequent censuses and to suggest promising avenues for research and testing leading to other methodological changes. They have also been disseminated to users to provide general information on the quality of the data. In recent years, the possibility has been discussed of using evaluation results to adjust census statistics in order to improve the accuracy of the census counts. To date, the most closely related census operations to adjustment both occurred in 1970, when two programs—the National Vacancy Check and the Post-Enumeration Post Office Check—were conducted on a sample basis and the results were used to generate imputations of occupied housing units, occupants, and their characteristics in the census. The two programs accounted for 0.5 and 0.2 percent, respectively, of the total 1970 population count (see Chapter 5).
This chapter describes and assesses programs designed to evaluate completeness of census coverage of the population excluding for the most part consideration of content error evaluation programs (discussed briefly in Chapter 6).
Studies directed solely to evaluation of coverage of housing units and not persons are also excluded. Chapter 5 reviews specific findings from both population and housing coverage evaluation programs regarding gross undercount and overcount among groups in the population.
Finally, the discussion concerns only direct estimates of net national
undercount derived from coverage evaluation programs. Methods of making small-area estimates (e.g., synthetic estimates that apply national net undercount rates to subnational geographic areas) are not considered, nor are methods for “strengthening” direct estimates (e.g., the Fay-Herriot methodology employed in the 1970s to adjust census income statistics used as input for postcensal per capita income estimates for allocation of general revenue sharing funds). Chapter 7 discusses possible uses of coverage evaluation results for adjustment purposes, including methods for carrying adjustments down to smaller geographic areas and methods for strengthening the estimates. Chapter 8 presents the panel’s suggestions and recommendations for improved methods of coverage evaluation for the 1990 census.
METHODS OF COVERAGE EVALUATION
Broadly speaking, there are two major classes of coverage evaluation techniques: micro-level methods and macro-level methods. Micro-level or direct methods are based on case-by-case analysis of samples of units such as persons or households. Macro-level or analytic methods involve analysis of aggregate census data, including comparison of census totals with external data (such as vital statistics or other records) and analysis of internal consistency (e.g., analysis of sex ratios by age group and of cohort changes between censuses). A variety of micro-level methods have been used in the past for coverage evaluation. An important distinction among micro-level methods is the source of the evaluation data: administrative records or survey data. The main macro-level method is demographic analysis. A variety of methodological procedures exists for both micro and macro approaches, and both approaches have been used for content evaluation.
Micro-level case-by-case coverage evaluation methods usually require two samples to estimate net coverage error. The first is the “P sample,” or sample of the population from a source other than the census itself. The P sample provides an estimate of gross underenumeration. The second is the “E sample,” or enumeration sample selected from the census itself. By definition, the E sample cannot contain any missed persons but is made up of both correct and erroneous enumerations, and therefore provides a basis for estimating these components. The union of the P and E samples provides estimates of net coverage error.
Fellegi (1984) has classified micro-level coverage evaluation methods by treatment of the P sample:
- “Do it again, but better.” This involves a post-enumeration survey (PES) in which a sample of areas is revisited by specially selected and trained enumerators who try to do a better job of counting than the census.
- “Do it again, independently.” This involves an independent survey that is matched to the census. Typically, the results are used to develop net coverage estimates with so-called capture-recapture or dual-system techniques. The 1980 Census Post-Enumeration Program (PEP), which matched the April and August Current Population Survey (CPS) records to the census, is an example. Matches of CPS to census records in 1950, 1960, and 1970, which were also carried out for purposes of content evaluation, produced as by-products estimates of gross omissions only.
- Reverse record checks. In this method, samples drawn from four frames—(1) persons counted in the previous census, (2) postcensal births, (3) postcensal immigrants, and (4) persons determined through coverage evaluation to have been missed in the previous census—are located to determine whether they are still residing in the area, and the resulting estimated number of residents is compared with the census total. The 1960 census in the United States tested a reverse record check approach; Canada relies heavily on this method for coverage evaluation.
- Administrative records matches. By these methods, records or samples of records from one or more administrative systems (e.g., social security records) are matched to the census. The Census Bureau has conducted coverage studies of specific population groups based on administrative records matches, for example, using Medicare data to study coverage of persons 65 and over. One method, sometimes called the composite list, has been detailed in Ericksen and Kadane (1983; they refer to it as the “megalist” method).
There are other possible sources for the P sample that have been suggested or experimented with in the past:
- Records of household composition generated by participant observers in local areas. (Experience with a single participant observer study in 1970 is described in Chapter 5.)
- Multiplicity or network surveys, in which census respondents are asked for names of relatives, such as parents or children, not living in their household. This approach was used with limited success in the 1977 Oakland pretest for the 1980 census (see discussion in Chapter 5). It was also used to evaluate coverage in the 1978 Richmond dress rehearsal, but most of the analysis was never completed.
- Lists generated by localities. The 1980 census included a provision for local review of preliminary field counts as a coverage improvement method (see Chapter 5). The Census Bureau also evaluated
coverage in New York City with reference to local lists furnished by the city as part of its lawsuit protesting the 1980 census count (see Ericksen, 1983; Ericksen and Kadane, 1983). However, no attempt has been made to base evaluation—or adjustment—of the census on lists or other ad hoc data supplied by localities.
COVERAGE EVALUATION PRIOR TO 1980: MICRO-LEVEL METHODS
The completeness of the census count and the quality of the data have concerned census officials and data users since the first census in 1790. However, formal evaluation of the census originated in the mid-twentieth century. (The discussion in this section of the history of census coverage evaluation programs in the United States draws heavily on Bureau of the Census, 1978b, no date-a.) The social and economic problems of the 1930s and 1940s stimulated increased interest in census data for policy purposes and correspondingly increased interest in the accuracy of the figures. The development of probability sampling methods and improvements in vital statistics records over the two decades prior to 1950 made it possible to develop reasonable measures of accuracy.
There was no formal coverage evaluation effort in conjunction with the 1940 census, although outside researchers carried out limited macro-level analysis of coverage among certain age groups.
The Census Bureau experimented successfully with micro-level coverage evaluation programs using post-enumeration survey techniques for the 1945 Census of Agriculture, the 1947 Census of Manufactures, and the 1948 Census of Business. These efforts led to the decision to evaluate coverage in the 1950 Census of Population and Housing using a large post-enumeration survey.
The 1950 Census Post-Enumeration Survey
The post-enumeration survey coverage evaluation methodology used in the 1950 census (see Bureau of the Census, 1960) was predicated on the notion that errors in the census were largely due to failures to implement correctly census definitions and procedures and to imperfections in materials and procedures that led to respondent misunderstanding and reporting error. Hence, the approach used to evaluate both coverage and content errors was to “do it again, but better.”
The 1950 PES used a combination area and list sample. A sample of the land area of the United States was used to identify erroneous omissions of entire households (P sample). A list sample of persons enumerated in the census was also used to: (1) check within-household errors in population
coverage, both omissions and erroneous enumerations; (2) identify erroneous inclusions of entire households; and (3) measure the quality of answers to specific census questions (content evaluation). The area sample contained 280 primary sampling units, 3,500 segments (generally containing 6-10 housing units) and about 21,000-25,000 households. To reduce costs in canvassing two independent samples, the list sample was largely drawn to include most of the households in the area sample segments.
To obtain a high level of accuracy in the PES, interviewers were very carefully selected, trained, and supervised; more detailed questions were asked than in the census; and interviewers were instructed to obtain responses from each adult rather than allow proxy responses. The per case cost of the PES was about 20 times the per case cost of the census itself. Interviewing took place in August and September 1950.
The interviewers for the area sample were required to make a complete canvass of their assigned segments, note any dwelling units not included in the list sample for the sample segments as possibly omitted from the census, and obtain housing information for these units and information for each person living in them as of Census Day, April 1. (Hence, the 1950 PES used the household composition rule, later termed PES-A, of determining the persons living at the address as of Census Day, as opposed to the rule, termed PES-B, of determining where the persons found by the PES were actually living on Census Day.)
Interviewers for the list sample were to visit each household, determine whether there were other people that should have been enumerated at that address as of April 1, determine whether one or more persons or the whole household was erroneously enumerated, and obtain responses to housing and population questions for purposes of content evaluation. All the interviewer records from both the area and list samples were then matched to the census files.
The net undercount estimated by the PES was 2.1 million persons or almost 1.4 percent, the difference between erroneous omissions (2.2 percent) and erroneous inclusions (0.9 percent). The gross errors included persons who were counted in the wrong place and, hence, showed up as omissions for one place and erroneous inclusions for another. At the national level, such omissions and inclusions balance out. The PES also provided estimates of gross and net coverage error for the four regions of the country (Northeast, North Central, South, and West) by urban/rural residence and for population subgroups classified by age, race, sex, and various socioeconomic characteristics such as income and occupation.
Evidence from several other sources, including a quality check conducted as part of the PES, demographic analysis, and independent record checks for selected population groups, indicated that the PES net coverage error was too low—probably by as much as 2 percentage points (see dis-
cussion in a later section regarding demographic analysis and independent record checks). The PES quality check, which involved withholding from the list-sample interviewers some names of persons actually enumerated in the census, found that the interviewers missed about 12 percent of these people. It appeared that interviewers were less effective in identifying cases in which the census missed one or more members of an enumerated household than in identifying errors involving whole households, in part due to the problem of persons moving between Census Day and the PES. The PES by design did not include transient quarters, such as hotels, and hence missed a population group believed to have a high net undercount in the census. However, the major reason postulated for the understatement of net undercount estimated by the PES is what is often termed “correlation bias,” namely, the tendency for the PES to miss, although perhaps to a lesser degree, the same types of people who are missed in the census (see discussion in a later section of this chapter).
Coverage Evaluation in the 1960 Census
The experience with the 1950 Post-Enumeration Survey led the Census Bureau to undertake a more elaborate coverage evaluation program for the 1960 census (see Marks and Waksberg, 1966). The program included another post-enumeration survey and several kinds of record checks, including a reverse record check, in addition to demographic analysis.
The 1960 Post-Enumeration Survey
The 1960 PES again used two samples, an area sample and a list sample. The area sample contained 2,500 segments comprising about 25,000 housing units drawn from the 1959 Survey of Components of Change and Residential Finance. Enumerators were instructed to list all structures and housing units in their segments, to reconcile their listings with Survey of Components and Residential Finance data and census data, and to identify missed housing units and the number of people living in them. The list sample was selected independently of the area sample and comprised a national sample of about 15,000 housing units and group quarters drawn from census enumerators’ listing books for about 2,400 enumeration districts in 335 primary sampling units covered in the Current Population Survey. The sample averaged about two clusters of three housing units each per enumeration district. The list sample interviewing began in May, only 1 month after Census Day, to endeavor to minimize problems stemming from movers and lack of recall on the part of respondents. The interviewers were given the list of housing units, but not the names of the occupants, and were instructed to enumerate independently the units, ascertaining the
household composition as of Census Day as well as the composition in May. The interviewer records from the area and list samples were matched to census records, with special efforts made to determine (a) whether persons in each unit in May who were not resident there on Census Day had been enumerated somewhere else, and (b) whether the actual residents of the unit on Census Day had all been included.
The 1960 PES estimated the national net undercount at 3.3 million people, or 1.9 percent of the total population. The area sample provided estimates of persons in missed or erroneously enumerated housing units, and the list sample provided estimates of missed or erroneously enumerated persons in otherwise enumerated households. The program produced net undercount estimates for age, race, and sex population groups but not for any other population classifications nor for subnational geographic areas. Again, evidence from demographic analysis and other sources indicated that the PES underestimated the net undercount—probably by about 1 percentage point. The 1960 PES estimated a higher proportion of missed persons in otherwise enumerated households compared with the 1950 effort (about two-fifths of the total of missed persons in 1960 compared with only one-quarter in 1950) but was still considered to have been relatively more successful in identifying missed households than missed persons within households.
1960 Record Check Studies of Specific Population Groups
The 1960 census coverage evaluation program included several record check studies developed in response to the evidence that post-enumeration surveys tend to miss the same kinds of people that the census misses. Two of the studies were directed toward evaluation of coverage of specific population groups, namely college students and elderly persons. Based on samples of students enrolled in college in spring 1960 and elderly recipients of social security benefits in March 1960, the Census Bureau estimated that the census experienced a gross undercount of between 2.5 and 2.7 percent of college students and 5.1 to 5.7 percent of the elderly (Marks and Waksberg, 1966).
The 1960 Census Reverse Record Check
The Census Bureau also carried out a reverse record check study to estimate net national undercount in 1960, similar to the methodology used in Canada. For the reverse record check in 1960 (see Bureau of the Census, 1964b), the Census Bureau constructed an independent sample of the population as of April 1 from four sampling frames:
- Persons enumerated in the 1950 census;
- Children born after April 1, 1950, and before April 1, 1960, as registered with state bureaus of vital statistics;
- Persons missed by the 1950 census but found by the 1950 PES; and
- Aliens registered with the Immigration and Naturalization Service as resident in the United States in January 1960.
The sample totaled about 7,200 persons (excluding about 400 persons found to be “out of scope” because they had died or moved out of the country or for some other reason), of a universe believed to consist of about 98 percent of the total U.S. population. Population groups not represented in the four samples included:
- Persons missed by both the 1950 census and the 1950 PES;
- Persons missed in the 1950 census in Alaska and Hawaii, which the 1950 PES did not cover;
- Citizens (mostly Puerto Ricans) outside the continental United States in 1950 but in the United States in 1960;
- Unregistered intercensal births;
- Aliens arriving after 1950 who became citizens before 1960;
- Aliens entering the United States between February 1 and April 1, 1960; and
- Aliens resident in January 1960 but not registered with the Immigration and Naturalization Service.
Two population groups were represented twice in the four samples:
- Persons missed in 1950 at their usual place of residence and erroneously enumerated at another address (represented both as missed persons in the PES and enumerated persons in the census); and
- Aliens registered in 1960 and enumerated in the United States in 1950.
The Census Bureau attempted to trace each sample person to his or her address as of April 1, 1960; obtain responses to a questionnaire (by mail or in person when necessary), verifying the address and providing characteristics data to assist in determining enumeration status in the census; and match each questionnaire to the census records. For persons not found in the census or when there was doubt as to the person’s enumeration status, the Census Bureau made further efforts to determine whether the person was counted.
Despite their best efforts, a definite match status (counted in the census or missed) could not be assigned to almost 1,200 of the sample cases
(16.5 percent of the total). Over three-fourths of the failures to match were due to an inability to obtain a current address. Among the four samples, the sample drawn from the 1950 PES had the highest proportion of cases for which a definite match status could not be assigned—over 24 percent.
Using different assumptions about the rate at which the census counted persons for whom a definite enumeration status could not be obtained, the Census Bureau estimated gross omission rates from the reverse record check of between 2.6 and 4.7 percent of the total population. (The range for the sample drawn from the 1950 PES was 5.7 to 10.5 percent, and that for the sample of registered aliens was 7.3 to 15.4 percent.) Subtracting the PES estimate of 1.3 percent erroneous enumerations in the census gave estimates of net undercoverage of between 1.3 and 3.4 percent. Marks and Waksberg (1966) narrowed the range of reasonable net undercount estimates from the reverse record check to a band of. 2.5 to 3.1 percent. These estimates compare with the net undercount estimate of 1.9 percent from the PES and an estimate of 2.7 percent from demographic analysis. The small sample size of the reverse record check and uncertainties stemming from the match failures precluded deriving coverage estimates for population subgroups or subnational geographic areas from the 1960 reverse record check.
Reverse Record Checks in Canada
Since 1961, Canada has relied on reverse record check methodology to estimate the completeness of coverage achieved in its quinquennial censuses. Fellegi (1980a:280) notes that demographic analysis, given its vulnerability to migration estimates, is not useful in Canada because emigration is both significant and not well measured. He notes as well (1980a:281) the problems with the assumption that the probability of being missed in a survey is independent of the probability of being missed in the census as reasons not to use the Canadian monthly Labour Force Survey as the basis for constructing net coverage estimates. This problem is largely obviated by a reverse record check, which does not rely on dual-system estimation. Matching problems are also less consequential, since an estimate of the total population can be prepared after tracing, without matching with the census files. (Matching may play a useful role during tracing; it is also needed to identify a set of micro records of persons missed by the census for use during evaluation of the next census.)
The Canadian reverse record check program (see Gosselin and Theroux, 1977, 1978a, 1978b, 1979) combines samples from four mutually exclusive but together almost comprehensive sampling frames: (1) the previous census, (2) the register of intercensal births, (3) the list of intercensal immigrants, and (4) persons missed in the previous census as identified in that census’s reverse record check. Conceptually, a sample drawn from these
four frames covers all persons to be enumerated in the current census, except illegal immigrants and unregistered births (the latter are rarities in Canada because of its “baby bonus” program). Fellegi (1980a:281-282) summarizes the reverse record check (RRC) procedures as follows:
The operation consists of meticulously tracing the current address of every selected person, and then of checking the census records to see whether they were included there. The key to the success of the project is the tracing operation—and we were able to trace conclusively in each of the last four censuses about 95 percent of the selected persons. . . . As part of the tracing operation all selected persons who appear to have been missed by the census are contacted by an interviewer, partly to find out whether there may have been another address at which they could have been enumerated, partly to collect some basic census information from them. As a result, the RRC project provides not only estimates of national or provincial under-enumeration rates, but it also results in a microdata base [that] . . . has a rich analytic potential to describe the “profile” of those missed by the census.
The reverse record check of the 1976 Canadian census estimated undercoverage of both persons and occupied housing units at about 2 percent (Fellegi, 1980a:285-286). No E sample has been used to date in Canada (though one is planned for 1986) because the emphasis has been toward deriving information for lessening the gross undercount. Furthermore, Canada does not make use of the same array of coverage improvement programs as the Census Bureau that probably contribute to overenumerations.
Coverage Evaluation in the 1970 Census
Because of the problems with the post-enumeration survey methodology used to estimate net undercoverage in the 1950 and 1960 censuses, the Census Bureau made no plans to carry out a comparable program for the 1970 census but placed chief reliance on the method of demographic analysis (see discussion in a later section). Several other programs, including the CPS-Census match and record checks for specific population groups, contributed to knowledge of coverage problems.
The CPS-Census Match
The approximately 56,000 households included in the March 1970 Current Population Survey sample were matched to the 1970 census records. Although the match was performed primarily for purposes of content evaluation (using the subsample of about 10,000 CPS households that received the census long forms), it also served to evaluate coverage of
housing units. Data on missed persons were tabulated but never published (see Siegel, 1975).
The Census Bureau constructed estimates of gross undercoverage for the total population and subgroups from the CPS-Census Match using dual-system estimation techniques. The CPS-Census Match estimated a gross undercoverage rate of 2.3 percent for all persons, compared with the demographic analysis estimate of 2.2 percent. The CPS-Census Match estimate is higher than the demographic estimate, at least in part because of the absence of an E sample to estimate erroneous overenumerations in the census. The CPS-Census Match estimates were adjusted for additions to the census count resulting from imputations based on the National Vacancy Check, the Post-Enumeration Post Office Check, and some “close-out” procedures, but they were not adjusted for erroneous additions to the census, such as duplicate enumerations.
Record Check Studies of Specific Population Groups
The Census Bureau carried out two record check studies in 1970 directed toward coverage evaluation. For the Medicare Record Check, a sample of approximately 8,000 persons age 65 and older was selected from Medicare health records and matched to the 1970 census records. The overall gross omission rate for this population group as estimated from the study was 4.9 percent, a somewhat lower rate than that estimated for elderly social security recipients in 1960.
For the D.C. Driver’s License Study, the Census Bureau matched driver’s license records with census records for about 1,000 males, ages 20-29, living in a set of selected tracts in the District of Columbia, and who obtained or renewed their licenses in the District of Columbia between July 1969 and June 1970. About 14 percent of the cases were identified as missed in the census, with an additional 10 percent who were probably missed but for whom a definite match status could not be determined. This project was designed as a feasibility study. Analysts recommended that future studies: (1) narrow the sampling time reference, (2) update the address information after sampling and before matching, and (3) have the Postal Service review the list prior to matching.
COVERAGE EVALUATION PRIOR TO 1980: MACRO-LEVEL METHODS
Researchers inside and outside the Census Bureau have used aggregate methods to assess the completeness of census coverage since the beginning of coverage evaluation efforts in the United States. The principal macro-level method is termed demographic analysis, whereby independent esti-
mates for the population in various categories (typically, age, sex, and race) are constructed and compared with the census counts. In ideal form, the process of constructing an independent estimate for an age-race-sex group, for example, black men ages 25-29 in 1970, is as follows:
- Obtain from vital statistics records the count of births of black males occurring between April 1, 1941, and April 1, 1945 (and apply appropriate corrections for underregistration);
- Subtract the count (obtained from vital statistics records) of deaths occurring between April 1, 1941, and April 1, 1970, to black males born in the above time period;
- Add the count (from Immigration and Naturalization Service statistics) of black male immigrants to the United States born in the above time period who arrived between April 1, 1941, and April 1, 1970; and
- Subtract the count (estimated as best possible) of black male emigrants from the United States born in the above time period who left the country between April 1, 1941, and April 1, 1970.
The resulting estimate can then be compared with the 1970 census count for black men ages 25-29 to determine the net undercount or overcount of that group in the population.
The above procedure is fairly reliable for population groups for which birth registration data are complete (essentially those born in 1935 or later), for which illegal immigration is negligible, and for which emigration is also negligible. Data sources are not available that permit accurate estimates either of illegal immigration or of emigration. Given the gaps in the data, various methods have been used to construct “demographic” estimates for particular population groups. For example, data from Medicare records are currently used to construct independent estimates of the population age 65 and older, rather than using the demographic method outlined above.
Demographic analysis cannot be performed for population groups defined according to other characteristics, such as income or education, because of the absence of appropriately classified registration information. It has also not been possible to use the method for subnational geographic area coverage estimates, because of lack of data on internal migration flows. The method provides estimates of net national coverage error for age-sex-race groups for which illegal immigration and emigration are small, but it does not distinguish among the components of error—gross omissions, gross overenumerations, and content errors such as age misreporting. Nonetheless, the method has been extensively developed in the United States and is regarded as providing more accurate estimates than other methods of net undercoverage for the 1950, 1960, and 1970 censuses at the
national level. The sections below briefly review the history of demographic analysis of census coverage in the United States prior to 1980.
Demographic Analysis Prior to 1950
After the 1940 census there was some macro-level analysis by outside researchers of the completeness of the coverage. With a grant from the Social Science Research Council, Daniel O. Price (1947) compared aggregate census data for men ages 21-35 by race with selective service registration data and estimated a net undercount of 3 percent for all men and 13 percent for black men in this age group. P.K. Whelpton of the Scripps Foundation for Population Research, using vital statistics data, estimated that white and nonwhite children under age 5 had net undercount rates, respectively, of over 6 percent and over 15 percent in the 1940 census (Bureau of the Census, 1944).
Demographic Analysis in 1950
Ansley Coale of Princeton University carried out an extensive analysis (1955) to develop demographic estimates of the population in 1950. For age groups under 1-5, he used birth registration statistics as the basis for his estimates. For older groups, ages 15-64, he relied on comparisons with the results of preceding censuses (with appropriate allowances for mortality and net immigration). An important assumption underlying his method was that within each age-sex group the relative net undercoverage was identical in the 1930, 1940, and 1950 censuses. For persons age 65 and older, Coale used the 1950 Post-Enumeration Survey results. Coale estimated net undercount for the total population in 1950 at 3.5 percent, 5.4 million people.
Coale’s net undercount estimate of 3.5 percent is 2.5 times the estimate from the PES of 1.4 percent. The Census Bureau developed a “minimum reasonable estimate” of 2.4 percent net undercount based on PES results for persons age 40 and older, birth registration data for persons under 15, and examination of sex ratios for persons ages 15-39 (Bureau of the Census, 1960:5-6). Demographic analysis at the Census Bureau subsequently led to refinements in Coale’s 1955 estimate. The latest estimate (Siegel, 1974) puts the 1950 census net undercount at 3.3 percent of the total population.
The 1950 census evaluation program included a Test of Birth Registration, designed to evaluate the completeness of vital statistics on births. (A similar study was carried out as part of the 1940 census.) For 1950, census enumerators filled out cards for infants born between January 1 and April 1, 1950. These cards were matched to birth registration records for the corresponding period. The results, used in Coale’s work and other demographic analysis studies, indicated that the registration system recorded 98 percent
of all births (compared with 93 percent in 1940), including 99 percent of white births and 94 percent of all other births (Siegel and Zelnik, 1966).
An extension of this project, the Infant Enumeration Study (Bureau of the Census, 1953), matched birth records for January through March 1950 to the infant cards filled out by census enumerators to assess completeness of coverage for newborns. The study found that about 96 percent of infants under 3 months old were enumerated. In about 82 percent of cases in which an infant was missed, the parents were also missed.
Demographic Analysis in 1960
Census Bureau staff and university scholars carried out several studies in the early 1960s to evaluate completeness of coverage in the 1960 census. Siegel and Zelnik (1966) summarized these studies and presented a “preferred analytic composite” estimate of 3.1 to 3.2 percent net undercount of the population in 1960.
Undercount percentages for persons under age 25 were derived from population estimates for this group based on birth registrations (adjusted for underregistration using the results of the 1940 and 1950 birth registration test), registered deaths, and estimated net external migration. The estimation method used for whites age 25 and older was quite complex. The method represented an extension to 1960 of coverage estimates for 1950 published in Coale and Zelnik (1963) for the native white and total white population by age and sex.
Coale and Zelnik constructed estimates of annual births and birth rates for the native white population from 1855 to 1934 using single-year age distributions available in every census since 1880. For each cohort, they estimated the proportion that could be expected to survive each intercensal decade based on mortality data, then used those figures (adjusted for immigration) to estimate the number of births that should have occurred a certain number of years before a given census to account for the number of persons enumerated at a certain age in that census. This description is an oversimplification, as various complex adjustments were required to attempt to compensate for deficiencies in the census single-year age distributions and the mortality records. From the estimated annual birth data for native whites, Coale and Zelnik constructed estimates of total population, by age and sex, then of coverage errors for the native and total white population of each age and sex group in each census from 1880 to 1950.
The 1960 coverage estimates for nonwhite women 25 years and older represented extensions of the estimates developed by Coale (1955) for this group in 1950, using an iterative technique assuming that age patterns of undercount were similar in the 1930, 1940, and 1950 censuses. The 1960 coverage estimates for nonwhite men 25 and older were the result of apply-
ing expected sex ratios to the estimated nonwhite female population (whose coverage errors are lower) and comparing the results with the census counts.
Siegel (1970) updated the 1960 coverage estimates to incorporate population estimates for the elderly based on Medicare data. Siegel (1974) published the current “preferred” estimate that the 1960 census undercounted the population by 2.7 percent or 5 million people. The preferred demographic analysis estimate is 1.4 times the estimate from the 1960 PES and falls within the range of 2.5 to 3.1 percent estimated in the 1960 reverse record check.
Demographic Analysis in 1970
The Census Bureau relied on demographic analysis as the principal method of evaluating coverage in the 1970 census. The data used for the demographic estimates included birth and death statistics, life tables, immigration data, Medicare enrollments, and data from previous censuses. Siegel (1974) published a range of estimates, with the “preferred” estimate that the 1970 census undercounted the population by 2.5 percent. The range of estimates stemmed from differing assumptions regarding net undercount in the 1960 census and population change in the following decade.
The preferred estimates were developed as follows. Population estimates for persons under age 35 were based on adjusted birth statistics, projected forward to 1970 by accounting for deaths and estimated net migration. The birth data were adjusted for underregistration using the results of the 1940 and 1950 birth registration tests and of another study of completeness of birth registration for 1964-1968 (Bureau of the Census, 1973e). For the latter study, a sample of about 15,000 children born between 1964 and 1968 who were included in the Current Population Survey or the Health Interview Survey from June 1969 to March 1970 were matched to birth records. The study found that 99.2 percent of births during this period were registered, including 99.4 percent of white births and 98 percent of all other births.
Population estimates for white women ages 35-64 in 1970 represented extensions to 1970 of the 1950 estimates for white women ages 15-44 developed by Coale and Zelnik (1963) based on estimating annual births. Population estimates for black women ages 35-64 represented extensions to 1970 of 1960 estimates for these cohorts developed by Coale and Norfleet W. Rives, Jr. (1973). The Coale and Rives study constructed estimates of the black population and of black birth rates for the period 1880 to 1970, starting with the assumption that the “true” population in 1880 could be represented by “model” tables of stable population age distributions.
The population estimates for white and black men ages 35-64 were derived by applying expected sex ratios (males per 100 females) to the cor-
responding female population estimates. Finally, estimates of persons age 65 and older were derived from Medicare data, adjusted for persons not enrolled and further adjusted for consistency with expected sex ratios for the elderly population.
Subsequent work with new data permitted refinements in the 1970 coverage estimates. The latest estimate is that the 1970 census had a net undercount rate of 2.2 percent (Passel et al., 1982). The revision was primarily attributable to increased allowances for emigration during 1960 to 1970, for Medicare underregistration at ages 65-69 in 1970, and to small changes in estimated completeness of birth registration for 1935-1970.
As described more fully in Chapter 5, demographic analysis estimates of net undercount in every census since 1950 indicate better coverage for women, on average, than for men, and for whites than for persons of other races. During the 1970s, Census Bureau researchers endeavored to develop coverage estimates for states (Siegel et al., 1977) and for the growing Hispanic population (Siegel and Passel, 1979), but these efforts were frustrated by lack of reliable data. The growing interest in coverage estimates for subnational areas and for other population groups besides blacks and whites, coupled with severe data problems, such as absence of data for estimating illegal immigration and emigration and for reliably estimating internal migration, led the Census Bureau to decide that demographic analysis could not be the principal coverage evaluation method for 1980. The Census Bureau planned, in addition to demographic analysis, to carry out a program to match an independent survey to the census (the P sample) and recheck a sample of census records (the E sample). The results would be used, through dual-system estimation, to construct coverage estimates for the nation, states, and large metropolitan areas. The 1980 Post-Enumeration Program and the demographic analysis efforts carried out for 1980 are discussed in detail below.
THE 1980 POST-ENUMERATION PROGRAM
In 1980, the Census Bureau implemented a coverage evaluation program closely related to the post-enumeration surveys used in conjunction with the 1950 and 1960 decennial censuses. The aim of this program, called the 1980 Post-Enumeration Program (PEP), was to provide estimates of net undercoverage in the 1980 census, with considerable geographic detail, possibly down to the level of states and large cities.
The basic methodology of the 1980 Post-Enumeration Program was “do it again, independently.” Thus, the sample recount was not intended to be more complete than the census, only independent of the census. If the independence assumption applies, then the estimate of the number missed can be arrived at via a model similar to the one used in the estimation of
wildlife populations, called capture-recapture. When used in the context of the census, the model is referred to as dual-system estimation (see Marks et al., 1977, and Sekar and Deming, 1949, for an early use of the capture-recapture methodology in a census context).
In the case of wildlife populations, a sample of the population is taken and identified or tagged. It is assumed that every member of the population has an equal chance of being tagged. Then another independent sample is taken. Again at this second stage, it is assumed that every member of the population has an equal chance of being tagged, although not necessarily the same chance as at the first stage. The population thus falls into four mutually distinct groups: (1) those caught the first and the second time, (2) those caught the first time but not the second time, (3) those missed the first time and caught the second time, and (4) those missed both times. The total population is the sum of these four groups. The difficulty is that the fourth group’s number is unknown.
At this point the assumption of independence is used. The population that was caught the first time is estimated to have the same probability of being captured the second time as the total population. Thus, the percentage of the population caught the first time that is also captured the second time is assumed to be the same as the percentage of the entire population that is captured the second time.
It has long been thought that either the independence assumption or the assumption of equal capture probabilities or both are very likely seriously in error. The failure of the assumption of independence is sometimes referred to as “correlation bias.” It is commonly believed (and partially supported by Valentine and Valentine, 1971) that certain persons, such as undocumented aliens, others wishing to avoid detection by authorities for a variety of reasons, and those either with multiple residences or living in quarters that are not clearly residential, are missed by both the census and sample surveys more frequently than the joint assumptions of independence of capturing mechanisms and equal capture probabilities would yield.
In the application of dual-system estimation to the 1980 census, the two assumptions of equal capture probability at each stage and the independence of capture probabilities, which are generally believed not to hold, were modified as follows. The Census Bureau stratified the population into subpopulations and used dual-system estimation separately in each stratum. Thus, the two assumptions used were that the individuals within these strata had equal probabilities of capture and that the capturing mechanisms operated independently within strata. The strata were defined using the variables age, race, sex, ethnicity, and area of residence.
Notationally, for each stratum, if n1 are caught the first time, n2 are caught the second time, m are caught both times, and we are interested in
estimating N, the total population, it follows from the two assumptions given above that:
![]()
Parallel to the wildlife example, in the 1980 census dual-system estimation model, the census served as the first method of capture and the Census Bureau used the Current Population Survey sample of households as the post-enumeration survey, the second capture mechanism.
Unlike the wildlife situation, it is not always easy to ascertain whether an individual was included in the census. The individuals themselves cannot reliably respond to this question, partly because a member of a household may not know whether another member completed a questionnaire that included them. To determine which people counted in the post-enumeration survey were also counted in the census, a match of individuals in the post-enumeration survey and the census was carried out, matching by information on name, address, sex, age, and race. Ideally, one would need to match both the PES to the census and vice versa to be able to identify inaccuracies and errors in both the lists. While it is conceptually straightforward to search the census records for Current Population Survey records, the procedure used in 1980 did not facilitate matching a substantial percentage of census records to the Current Population Survey. The purpose of such reverse matching could be to determine records in the census that were either erroneous enumerations or duplications. Therefore, as mentioned above for previous post-enumeration surveys, a sample of census records was taken, called the E sample. Below we give details concerning both the P sample and the E sample.
Finally, there are two populations that were not sampled by the Current Population Survey: individuals in military barracks and the institutional population. For these populations, a supplemental sample was drawn. We do not describe the treatment of these samples of group quarters further here.
The P Sample
The P Sample comprised the April and August 1980 samples of the Current Population Survey. Samples for 2 months were used so that the overall sample size would be large enough to provide fairly reliable estimates of undercoverage for states and major cities. (Due to the current design of the Current Population Survey, samples taken 4 months apart have no overlap.) Each CPS month included about 70,000 households and about 185,000 individuals.
To obtain the P sample information, the Current Population Survey interview was supplemented with two pieces of information: (1) a sketch map of the major roads so that residences could be located unambiguously on census maps, and (2) for the August CPS interview, a list of all places of residence of each person between January 1 and the time of the interview, as well as information that would help to validate the geographic locations. The address for each interview was then geocoded to the census enumeration district. The census questionnaires for that enumeration district—and only that enumeration district—were then clerically searched for a person with closely matching information on name, address, sex, age, and race.
If no matching census record could be found, or if there was not enough information to ascertain match status, a follow-up interview was attempted. An inherent asymmetry should be noted here. The Current Population Survey enumerations were followed-up for verification, but the census enumerations were considered valid without follow-up. The E sample was intended to account for this asymmetry.
The E Sample
The E sample, as mentioned above, was designed to verify the accuracy of the information provided in the census, specifically, to count possible overenumeration from each of the following sources: (1) records placed into the wrong census enumeration district; (2) records resulting from erroneous enumerations, e.g., individuals born after Census Day, and cases fabricated by census enumerators (called curbstoned cases); and (3) multiple records for the same individual. For measurement of net error, these cases would be subtracted from the gross undercoverage estimates.
In the administration of the E sample, 100,000 census questionnaires were selected and follow-up enumerators were sent into the field to detect erroneous enumerations and incorrect geocoding. A 50 percent subsample of the questionnaires in the E sample was also checked for duplicates.
The Combined Estimate
The dual-system estimation was then modified to reflect geocoding errors, erroneous enumerations, and duplications—these add wrongly to the number of nonmatches in the census and therefore should be subtracted from the census count. (Also subtracted from the census count were the number of field imputations1 that were also not matchable to CPS records.) If d represents the estimated number of duplications in the census, g the estimated number of persons placed into the wrong enumeration district,
__________________
1Field imputations are those that did not result from damaged questionnaires.
e the estimated number of erroneous enumerations, and i the number of field imputations, the estimate of the total population then becomes:
![]()
There were inconsistencies between the treatment of census and CPS cases, which also further complicated matters. For example, the degree of verification of inclusion in the two lists differed, with the census operating under somewhat more flexible rules concerning which individuals might serve as a substitute respondent for a particular individual. This difference might have accounted for relatively more enumerations in the census than in the Current Population Survey.
Aside from any assumptions underlying the models used in the 1980 Post-Enumeration Program, the quality of the collected data and the data processing affect the reliability of the resulting estimates. One assumption concerning data quality and processing is that there is always enough information to be able to decide whether two records match. Another implicit assumption is that, given sufficient information to assign match status to two records, there are no errors in the matching algorithm. Slight relaxations of the above two assumptions, for example, that they hold for a very large majority of the cases, would probably still permit the calculation of reliable estimates. In the remainder of this section we discuss the incompleteness in the P and E samples in the 1980 PEP and how the Census Bureau attempted to compensate for the lack of completeness.
For the P sample there were three major sources of missing data:2 (1) household noninterviews in the CPS; (2) failure to attempt or complete follow-up interviews for initially unmatchable CPS cases; and (3) failure to obtain acceptable follow-up interviews for initially unmatchable CPS cases, including sufficiently precise April 1 addresses. For the E sample there was one primary source of missing data: failure to obtain acceptable follow-up interviews.
In April 1980, the percentage of Current Population Survey (P sample) interviewees that were refusals, temporarily absent, or did not respond for other reasons was about 4.4 percent. One approach in the PEP was to treat these cases as nonrespondents. A second approach was to search CPS records for interviews for preceding and succeeding months for these cases, thus permitting attempts to match them to the census. (The CPS is a rotating survey and respondents are asked to furnish information for a total of 8 months in a 16-month period.) The majority of these households
__________________
2Some material in this section was taken from conversations with Robert Fay, III, U.S. Bureau of the Census.
could be matched to the census. The successful search for interviews in neighboring months was referred to as a “Type A noninterview.” Type A noninterviews were used in some calculations of census undercoverage and not used in others.
Besides the decision of whether to include Type A noninterviews, two other decisions arose over the inclusion or exclusion of certain data. First, when the E sample search was unable to determine where a person included in the census resided on Census Day, Postal carriers were consulted. These data were not considered by the Census Bureau to be of high quality (see Cowan, 1983). Second, the information on date and place of residence from August CPS movers (i.e., CPS interviewees in August who had lived elsewhere on Census Day) was determined also not to be of high quality.
Most CPS interviews that did not match to the census were followed up in the field in order to: (1) determine or confirm April 1 address, and (2) improve the quality of information on the precise geographic location of the Census Day address. Of the cases in which the follow-up interview was complete, the majority (60 percent) had been correctly geocoded and the correct enumeration district’s questionnaires had been searched for a match. Therefore these cases were given the status of not matched to the census. However, some follow-up interviews were not attempted or completed. Of those that were completed, some were considered to be unacceptable because the interviewers could not follow the fairly strict protocol on required features such as self-response. Finally, for a large number of cases, the follow-up interview was completed but the resulting address information was incomplete or in some other way not precise enough to determine the proper enumeration district for the residence. Occasionally the respondent reported “I don’t know” or refused to answer.
A rough summary of the incompleteness in the April P sample is provided in Table 4.1. The situation for the August P sample is worse, primarily due to the problems with movers, as noted above. As a rough approximation, by adding the 4.4 percent rate of refusals for households to the 4.0 percent rate of unresolved matches (this is an approximation because percentages of households and individuals cannot strictly be added together), we arrive at the fact that, for over 8 percent of the people in the PEP, a match status could not be determined from the data collected. This compares with the percentage net undercount, which is probably less than 2 percent on a national level.
In order to take account of these missing data, the Census Bureau used various forms of imputation, as well as other approaches described below, to arrive at 12 different sets of estimates of undercoverage for states, major cities, and remainders of states. The formation of these 12 estimates resulted from various choices concerning which CPS month to use, the treatment of information considered of questionable quality, and the treat-
| Percentage of April P Sample Households by Race and Response Status for Series 3 Estimatesa | Percentage of April P Sample Individuals in Responding Households by Race and Ethnicity and Match Status for Series 3 Estimatesa | |||||
| Race | Responded | Did Not Respond | Race and Ethnicity | Matched | Nonmatched | Unresolved |
| Total | 95.6 | 4.4 | Total | 92.6 | 3.4 | 4.0 |
| White | 95.7 | 4.3 | Black | 85.8 | 7.4 | 6.8 |
| Other | 94.5 | 5.5 | Nonblack Hispanic | 87.7 | 5.5 | 6.8 |
| Other | 93.8 | 2.7 | 3.5 | |||
aSeries 3 estimates, described more fully in the text, did not use Type A noninterview information but reweighted these cases to behave identically to the interviewed cases.
SOURCE: Wolter (1983:Exhibit B).
ment of unresolved matches. The Census Bureau used a combination of weighting and imputation, the weighting representing essentially imputation of the average matching rate for individuals of the same demographic characteristics. Thus, weighting did not make use of as much information as the imputation, for example, it did not use information about the cause of the incompleteness.
Some of the choices resulting in the 12 estimates were: (1) choosing whether to use Type A noninterviews for matching decisions or using weighting to assign matched status; (2) choosing whether to use Post Office information for the E sample or to treat these cases as noninterviews and use weighting to assign match status; (3) choosing whether to use information from any movers in August or to treat them as noninterviews and use weighting to assign match status; and (4) in general, for both the E sample and the P sample, choosing to use weighting for all incomplete cases or to use imputation. As a result of these choices, plus the choice of which CPS month (April or August) to use as well as other choices not mentioned here, the Census Bureau developed 27 estimates of undercoverage for states and major cities. Later, this number was reduced to 12 estimates that the Census Bureau felt all represented reasonable alternatives.
Table 4.2 provides the definitions of these 12 sets of estimates. They are denoted by a two-integer hyphenated code, in which the first number describes a treatment of the P sample, and the second number indicates a treatment of the E sample. There are a number of reasons, both a priori and a posteriori, supporting the various individual estimates from this list of 12 estimates. For example, estimate 10-8 reduces the problem for movers when
TABLE 4.2 Scheme to Identify Various 1980 PEP Estimates
| Code | Month | P Sample Treatment/E Sample Treatment |
| 2-9 | April | P—With Type A noninterviews |
| E—Post Office results considered noninterviews | ||
| 3-9 | April | P—Without Type A noninterviews |
| E—Post Office results considered noninterviews | ||
| 2-8 | April | P—With Type A noninterviews |
| E—With Post Office results | ||
| 3-8 | April | P—Without Type A noninterviews |
| E—With Post Office results | ||
| 5-8 | August | P—Movers used |
| E—With Post Office results | ||
| 5-9 | August | P—Movers used |
| E—Post Office results considered noninterviews | ||
| 10-8 | August | P—Movers treated as noninterviews |
| E—With Post Office results | ||
| 3-20 | April | P—Without Type A noninterviews |
| E—Incomplete cases treated as simple noninterviews | ||
| 2-20 | April | P—With Type A noninterviews |
| E—Incomplete cases treated as simple noninterviews | ||
| 14-20 | April | P—Incomplete cases treated as simple noninterviews |
| E—Incomplete cases treated as simple noninterviews | ||
| 14-8 | April | P—Incomplete cases treated as simple noninterviews |
| E—With Post Office results | ||
| 14-9 | April | P—Incomplete cases treated as simple noninterviews |
| E—Post Office results considered noninterviews |
NOTE: Every estimate in this table made use of clean-up information, essentially more extensive efforts to collect follow-up interviews, etc.
SOURCES: Cowan and Bettin (1982:14); Cowan (1983:32-33).
using the August P sample. Also the handling of incomplete interviews in the 14 and 20 series of estimates is similar to that used in the Canadian census. These points among others are detailed in Bailar (1983c).
The use of these 12 estimates produced very different estimates of undercoverage for national demographic groups, as shown in Table 4.3. Some analysts have suggested that the number of acceptable estimates should be narrowed considerably. For example, Ericksen (1983) would discard all but the 2-8, 2-9, 3-8, and 3-9 estimates as either based on August data, which had a higher rate of cases with unresolved match status, or as making use of extreme assumptions in the adjustments for missing data. However, even
| Estimate Code | National | Black | Nonblack Hispanic | Other |
| 2-9 | 1.4 | 6.7 | 5.6 | 0.3 |
| 3-9 | 1.3 | 6.3 | 5.3 | 0.2 |
| 2-8 | 1.0 | 5.6 | 4.4 | 0.0 |
| 3-8 | 0.8 | 5.2 | 4.1 | –0.1 |
| 5-8 | 1.6 | 4.3 | 6.4 | 0.8 |
| 5-9 | 2.0 | 5.4 | 7.6 | 1.1 |
| 10-8 | 0.2 | 2.7 | 3.6 | –0.4 |
| 3-20 | 1.6 | 6.9 | 5.5 | 0.4 |
| 2-20 | 1.7 | 7.2 | 5.8 | 0.6 |
| 14-20 | –0.3 | 2.5 | 1.2 | –0.8 |
| 14-8 | –1.0 | 0.7 | –0.2 | –1.4 |
| 14-9 | –1.1 | 2.0 | 1.0 | –0.6 |
SOURCE: Cowan and Bettin (1982: Tables III-1,12).
within this restricted set, the national undercount rate ranges from 0.8 to 1.4 percent.
In the years prior to 1980, demographic analysis had provided what were considered to be the most trustworthy estimates of undercoverage for certain demographic groups at the national level. However, demographic analysis for 1980 is generally considered to be significantly less accurate than for any of the previous three censuses (even though the reliability of some components of the estimates probably improved). In this section, we briefly describe the datasets and models used to calculate the 1980 demographic analysis estimates of undercoverage. (The main source for this section is Passel, 1983.)
The demographic method developed a preliminary estimate of the April 1980 national population of 226.0 million based on the so-called preferred estimate of the undercount for 1970 (see Bureau of the Census, 1974a). The 1980 decennial census counted 226.5 million. It was generally assumed that some undocumented aliens were counted in the census but that a sizable percentage were not. Since the demographic estimates incorporated undocumented aliens only indirectly by assuming that net illegal immigra-
tion was equal to another unknown, namely, emigration of legal residents, it was generally assumed that the census had experienced an undercount nationally, but it was difficult to estimate how much.
As more and improved data concerning the components of population change, births, deaths, and legal migration became available, better estimates were made. These estimates (Passel et al., 1982) were an improvement over the April estimates; however, they could not make use of data on recent fertility, mortality, or immigration nor of 1980 Medicare data, which were not yet available.
Work has continued on improving coverage estimates based on demographic analysis. To understand the nature of these improvements, we discuss in turn each of the major data components of demographic analysis separately for persons under and over age 65.
The Population Under Age 65
Birth Records
For 1980, population estimates based on virtually complete birth registration can be obtained only for the population under age 45. However, even for the years of virtually complete birth registration (1935 to the present), correction factors are used that are based on tests of the completeness of birth registration records for the white population. In addition, the demographic estimates had to use preliminary data on the number of births in 1979 and 1980, since final information on 1979 and 1980 birth registration did not become available until late 1983. Birth registration data are incomplete for persons between ages 45 and 64. Coale and Zelnik (1963) and Coale and Rives (1973), using stable population and other analysis methods, constructed estimates of the number of births for the years before 1935.
Death Records
Death statistics are used with very little correction for underregistration. Two minor exceptions are: (1) a small adjustment for the underregistration of infant deaths between 1935 and 1960, and (2) the use of Medicare records for deaths of people over age 70 between the years 1970 and 1980. Some smoothing of the death rates is also used.
Legal External Immigration
Records on immigration from 1935 to 1980 are provided by the Immigration and Naturalization Service (INS). Final data for most age, sex, and racial groups for the years 1979 and 1980 had not been provided to
the Census Bureau by INS by late 1983. The overall effect on the preliminary estimates is thought to be small. Emigration is only indirectly measured. Differences in estimates from consecutive censuses of the number of foreign-born persons have provided estimates of the net change in the foreign-born, which, when combined with immigration data, can be used to provide estimates of emigration. This technique is due to Warren and Peck (1980).
The Population Age 65 and Older
For the population age 65 and older, Medicare data are used to provide estimates of coverage; however, Medicare does suffer from a small amount of underregistration (Bureau of the Census, 1974a). The population figures used in the demographic estimates contained adjustments for the underregistration.
Undocumented Immigrants
The most serious deficiency in the population balance equation used for demographic analysis is the lack of information on the net flow of illegal or undocumented immigrants into the United States. A comprehensive discussion of this problem is contained in a recent National Research Council report on immigration statistics (Levine et al., 1985). The estimates of the number of undocumented aliens residing in the United States at the time of the 1980 census ranged from 2 to 12 million. No records of entries or departures are available for undocumented aliens (although some losses to the undocumented population through death may be included in numbers of registered deaths), so this population is impossible to incorporate into the standard demographic analysis. Various attempts have been made to estimate the size of the undocumented population, or particular components of it, using for example the 1960, 1970, and 1980 censuses of Mexico or Immigration and Naturalization Service data (see, e.g., Goldberg, 1974; Bean et al., 1983; see also Appendix 8.1). Unfortunately, the results of these analyses are not precise enough to do more than set broad limits, between 2 and 4 million, on the size of the undocumented population resident in the United States in 1980 (Levine et al., 1985).
Warren and Passel (1983) applied a modified form of demographic analysis to the foreign-born population enumerated by the 1980 census to estimate the number of undocumented aliens included in the census, a necessary preliminary step to estimating undercoverage of the legally resident population. Upon removing the undocumented aliens included in the overall count, this method estimated that the census had a 0.5 percent national undercount of the legally resident population, with a 5.3 percent under-
count for blacks and a 0.2 percent overcount for whites and other races (see Chapter 5). These numbers agree fairly well with PEP estimates 3-8 and 2-8, given in Table 4.3.
Many other factors besides the quality of the datasets are involved in the reliability of estimates based on demographic analysis. For example, there is a large amount of uncertainty in the racial and ethnic categorization used in demographic analysis, both between censuses and between any census and other sources, such as vital statistics records. Furthermore, the models of the completeness of birth registration are themselves based on data that made use of matching studies, which are generally error-prone. Finally, subnational estimation procedures using demographic analysis are still undergoing research. The possibility of developing useful estimates in the near future appears to be small, due to the lack of estimates of interstate migration (see Siegel et al., 1977).
RECENT USE OF ADMINISTRATIVE LISTS FOR COVERAGE EVALUATION
The existence of administrative records, for example, the Internal Revenue Service individual income tax files, Medicare records, and social security records, raises the possibility of basing a coverage evaluation program on these administrative lists. Roughly speaking, one would match samples of these lists (various possibilities have been suggested for how this might be done) and then make use of dual-system estimation or some generalization to estimate the undercoverage of the census list (see Appendixes 4.1 and 4.2 for discussions of multiple list methods and the matching of administrative records). The major advantage of such an approach is that household-based coverage evaluation programs, such as the Post-Enumeration Program, are better designed to account for missed households rather than missed individuals in enumerated households. Quite possibly, a large number of these missed individuals are included on administrative lists.
The use of administrative records and multiple list methods as a major component of a decennial census coverage evaluation program on a national level has never been attempted in the United States. However, the Census Bureau has performed several tests on a national basis. The Census Bureau has also used administrative records in studies of gross omissions for limited populations. Examples of the former include the IRS/Census Direct Match Study (see Childers and Hogan, 1984a, and Chapter 5 below) and a three-way CPS/Census/IRS match study (see Hogan, 1984a). Examples of the latter include a study that matched Medicare records with census questionnaires (see Bureau of the Census, 1973d) and two studies that matched, respectively, social security beneficiaries and college students with census files (see Marks and Waksberg, 1966, and previous discussion above). None
of the studies mentioned—except the as-yet-unreported CPS/Census/IRS match study—explored the difficulties of using more than one list besides the census list. Considering the differential undercoverage present in any one currently proposed list, such testing is highly desirable.
Assuming that at least two lists are to be used (along with the census list), there are two primary methods proposed that make use of multiple lists to estimate the rate of census omission. The first method, composite list formation, merges all but the census list into a super list or composite list. (Sampling is almost certainly used in the merging process due to the expense of matching two large files.) The composite list is then matched with the census file. The estimation of the rate of omission, arrived at by estimating the number of people not represented by either the composite list or the census, follows from the use of dual-system estimation, described above and in Appendix 4.1. The second technique, which we call the multilist method, proceeds by completely matching samples from every administrative list with each other and with the entire census list. This results in a multidimensional contingency table with the count in every cell determined by an individual’s inclusion or omission by the various lists. The cell representing the number of individuals missed by every list must be estimated in order to estimate the omissions rate in the census. (These two methods, composite list and multilist, as well as a third, less often proposed method using covariate information for modeling within the contingency table, are discussed more fully in Appendix 4.1.)
Composite list and multilist methods each make certain assumptions. Failure of these assumptions would cast serious doubt on the reasonableness of the resulting estimates of omission rates. When using the composite list method or when completely matching all lists, it is necessary that:
- The lists are available for the entire United States;
- There exists an identifier, such as social security number, or a suitable number of common responses that permit matching;
- There is very low item nonresponse and misresponse for variables used in matching;
- The addresses on the various lists are the address of residence; and
- There are few false matches and few false nonmatches, and the treatment of unresolved matches through imputation of matching status is effective.3
__________________
3We point out that it would be desirable to provide quantitative bounds instead of the qualitative expressions used. However, it is currently not possible to do so, due to the lack of research.
In using the composite list method, it is also necessary that:
- The merged list have little differential undercount; and
- Either the first-order independence assumption used in dual-system estimation nearly hold or the degree of dependence be well estimated.
In using the multilist method, it is also necessary that:
- The various lists be weighted so that no identifiable subpopulation is differentially underrepresented on any list; and
- Either the higher-order independence assumption used nearly hold or the degree of dependence be well estimated.4
Investigation of the above requirements for a successful national coverage evaluation program based on the use of existing administrative lists would cause one to be less than optimistic for this application of administrative lists. However, current trends in our society toward increasing computerization, automation, editing, quality control, etc., are likely to increase the possibility of meeting many of the requirements. In addition, progress at the Census Bureau in areas such as automated list matching should benefit the use of administrative records for coverage evaluation. Therefore, it is likely that many of the above requirements may be within reach in the foreseeable future.
The New York City Match
Another test of composite list methods occurred in the lawsuit in which the City and State of New York sued the U.S. Department of Commerce for federal funds that they claim they were deprived of as a result of differential undercoverage. Briefly, the plaintiffs created a composite list, referred to as the “Megalist” (details provided below). At the request of the plaintiffs, the court instructed the Census Bureau to determine the number of people on this list who were residents of New York City on Census Day, 1980, and who were not counted in the census. Once the number of people not included in the census was determined, the plaintiffs arrived at an independent estimate of the number of residents of New York City as of Census Day, 1980. Since the test deals only with New York City, it does not address the difficulties faced with a national application of the methods. However,
__________________
4Especially when using a large number of lists, it is helpful (but not necessary) that the lists contain few people who are not supposed to be included in the census, such as people who died before Census Day.
it is currently the most-developed application of the use of composite list methods for coverage evaluation. (The following discussion is taken from Ericksen and Kadane, 1983.)
In this application of composite list methods, the court directed that the Census Bureau use the following 10 lists:
- Consolidated Edison electricity bill payers;
- Babies born immediately preceding Census Day;
- People who died immediately after Census Day;
- New York City public school children;
- Persons arraigned in city courts;
- Students enrolled at the City University of New York;
- Persons in “Medicaid Eligibility File”;
- Licensed drivers;
- Registered voters; and
- Recipients of unemployment benefits.
Since there are a substantial number of people included more than once on the above lists, and since it is not possible to match more than a fraction of the population of New York City’s residents, a sampling plan was necessary in forming the composite list in order to select the cases to be matched to the census, as well as a procedure that prevented duplicates from being represented in the composite list.
The formation of the composite list proceeded as follows. (See Kadane and Lehoczky, 1976, for a full discussion of the underlying methodology.) First, 8 percent of the enumeration districts in New York City were selected. Next, samples of each list were selected with sampling frequency proportional to the square root of the expected omission rate. Finally:
- The lists were numbered from 1 to 10;
- The sample from the first list was guaranteed inclusion in the final list;
- The sample from the second list was checked against the entire first list; and
- For the remaining lists, the samples were checked against all preceding lists, with duplicates removed.
The final combination of lists produced a sample of 16,500 persons, representing a total population of 6.2 million, a large proportion of the approximately 7-8 million residents of New York City. The Census Bureau was ordered to match this list with that of the census for New York City and determine the individuals who:
- Were included in the 1980 census;
- Were not living in New York on Census Day in 1980; and
- Composed the remainder of the list.
In performing the match, it was often necessary to trace people included on the composite list to their current address to determine to which of the above three categories each of the people belonged (details of the matching and tracing processes can be found in Bureau of the Census, 1982d).
Due to several circumstances, among them the difficulty of tracing people to current addresses, it was not always possible to determine whether an individual had been counted in the 1980 census. Of the 6.2 million cases represented, 5.17 million were located in New York City on Census Day. The remaining 1.03 million represented cases that could not be determined. Of those located in New York City, 4.75 million were determined to be counted in the census, and 0.42 million were determined to be missed by the 1980 census. Those persons missed represent 8 percent of the cases for which a match status could be clearly determined. Ericksen and Kadane believe a more reasonable estimate of the rate of omissions to be at least 10 percent due to the treatment of imputations and the likelihood of the undetermined cases to represent residents of New York City.
Many of the difficulties encountered by this test of an administrative records-based coverage evaluation program were specific to this application and are not due to the general methodology. For example, much of the difficulty in tracing people to current addresses was probably due to the 28 to 30-month separation between the taking of the census and the tracing operation. Ericksen and Kadane point out their uneasiness about estimates derived from data of which 15 percent is missing (not at random), and they call for methods for reducing and accommodating missing data in this context. To this end they mention a procedure to replace hot-deck imputation of match status for the undetermined cases that is closely related to fractional matching, discussed in Chapter 8. Ericksen and Kadane present various sources of evidence for the reasonableness of their estimates. Finally, they recommend that in future applications of this methodology a smaller number of lists be used.
CONSIDERATIONS FOR ASSESSING ALTERNATIVE COVERAGE EVALUATION METHODS
In assessing the merits of alternative methods of evaluating completeness of census coverage, a number of factors are involved: (1) the error profile for the method, that is, the sources of error for each method, the degree of error contributed by each source, and the likelihood that corrective measures can reduce error; (2) timeliness; (3) feasibility; (4) cost;
(5) the extent to which a method meets the needs for coverage estimates, for example, the provision of small-area estimates; and (6) the extent to which the various sources coincide to give a coherent picture.
Clearly, an error profile that projects optimistically toward substantial improvement in the future is a consideration in the choice of coverage evaluation programs. In considering adjustment based on coverage evaluation data, it is also important to consider the development of an error profile for the census as well so that the two can be compared.
Considerations of timing are important as well. A fast program is particularly desirable if coverage evaluation is to be the basis for an adjustment of the census counts. It is also helpful for census users to have evaluation results available when they are making most use of the census, that is, in the first few years after the census. Beyond some thresholds, timing is partly a function of the staff resources and effort devoted to the coverage evaluation program. For example, although preliminary results from the 1950 Post-Enumeration Survey were not published until 1953 and final results not until 1960, the study results could undoubtedly have been made available sooner if there had been a perceived need, with the commitment of necessary resources. Micro-level coverage evaluation programs, however, have not been completed to date within a shorter time span than about a year and a half after the census. Preliminary demographic estimates for 1980 were released in mid-1981 and are still being revised on the basis of new data such as updated Medicare records.
Cost is also a consideration. Rough estimates of costs for the censuses conducted from 1950 to 1970 (Bureau of the Census, 1978b:App. A, Tables 1-3) suggest that evaluation programs of all kinds accounted for roughly 1.5 to 2 percent of total costs, with coverage evaluation programs making up perhaps about half the total devoted to evaluation. In 1980, the Post-Enumeration Program cost about $14 million, over 1 percent of the total. These percentages certainly do not appear high considering the need to have good information about the accuracy of the data. For 1990, the panel believes that increased resources should be devoted to coverage evaluation and other adjustment-related programs, in accord with our recommendation to pursue vigorously a program of research and development that could lead to the use of coverage evaluation results for adjustment of the counts (see Chapter 7). We have indicated ways in which cost savings could be achieved in other areas (see Chapters 5 and 6), so as not to increase total costs of taking the census.
It is also vital that coverage evaluation programs provide information at subnational levels of aggregation because of the concern about the equitable distribution of political power and monies. Finally, a way in which a coverage evaluation method can gain acceptance is for it to provide
estimates that nearly coincide with estimates given by other coverage evaluation programs based on substantially different statistical models.
ERROR PROFILES FOR COVERAGE EVALUATION METHODS
An error profile of a survey is constructed by first creating a systematic and comprehensive list of the operations that lead to the survey results. The error profile is then a description of the potential sources of error for each operation, the information available about each, and their impact on the survey estimates of interest (Bailar, 1983a; Brooks and Bailar, 1978).
It is not a simple matter to make an exhaustive list of the operations of a complex survey. It is even less simple to make a list of the potential sources of error, particularly in the case of a new measurement approach or an adaptation from another field. However, it is often true that one can identify dominant sources of error—ones whose reduction would materially improve the reliability of final estimates (even if one cannot exactly quantify by how much). It is on these dominant error sources that one must concentrate resources available for improvements since, without reducing them, even major error reduction in other components would lead to only negligible improvements in the reliability of the final product. Chapter 8 makes several recommendations in this direction.
The preceding sections of Chapter 4 have provided an overview of the development of coverage evaluation methods during the past 40 years. The questions remain, what is the current state of knowledge as to the efficacy of the various methods, and what are the expectations for improvements in each of the various methods over the next few years? It is not possible to provide a direct answer to these questions, since research is still at an early stage for many of the techniques. However, by way of summary we present the various operations central to coverage evaluation and a sense of the magnitude of the problem faced in accomplishing each of the operations by the various techniques.
The operations central to coverage evaluation are:
Direct Estimates
- Developing the completeness of the coverage evaluation survey
- Obtaining complete response in survey and census
- Tracing
- Geocoding
- Matching
- Dual-system estimation—independence
- Evaluating the evaluation
Demographic Analysis
- Obtaining component data
— Undocumented aliens
— Completeness of birth registration
— Completeness of death registration
— Legal immigration and emigration
— Internal migration
- Evaluating the evaluation
We now address, in turn, each of these operations and discuss qualitatively the resulting impact that each operation would have on an error profile for the various coverage evaluation techniques.
Components of Direct Estimates Programs
Developing the Completeness of the Coverage Evaluation Survey
Incompleteness of coverage results from the fact that no list, whether based on surveys, administrative records, or a combination, includes the proper representation of the target population—in the present case every resident of the United States. Some groups have a history of being significantly missed in post-enumeration surveys, for example, undocumented aliens. People in urban areas with very low socioeconomic status are missed by post-enumeration surveys and censuses (Valentine and Valentine, 1971). Although reverse record checks omit some of the persons missed in the previous census, undercoverage is probably not as severe with this method as with post-enumeration surveys. However, the problems reverse record checks have in counting undocumented aliens are probably as serious as those of post-enumeration surveys. Administrative list methods may have still less of a problem of undercoverage (although other problems exist, including the fact that gaps in coverage cannot be quantified in terms of age-sex-race groups or other census characteristics).
Obtaining Complete Response in Survey and Census
Incompleteness of response results from the inability to obtain survey forms from some individuals or households on the master address register or from the inability to collect answers to specific questions: for example, unreported or incomplete address was a major cause of unresolved matches in the 1980 PEP (see Cowan and Bettin, 1982). Of the 8.5 percent unresolved matches in the April P sample, over 60 percent were due either to CPS nonresponse or to failure to complete a follow-up interview. For reverse record checks, nonresponse is less serious per se. However, the in-
ability to trace a fraction of the selected population has an effect that is completely analogous to nonresponse. Nonresponse will clearly affect any matching involved in methods based on administrative lists.
Tracing
Tracing is the process of searching, used in the reverse record check, for a present residence address, given information about a residence sometime in the past. As mentioned earlier, roughly 12 percent of the sample in the 1960 test of a reverse record check in the United States could not be traced successfully. The use of more intensive tracing methods, as tested in the Forward Trace Study (see Chapter 8), may reduce the rate of failure to trace. (In Chapter 8 we mention that intensive tracing may increase the sensitization of the population.) Recent use of the reverse record check in Canada has been accomplished with a fairly consistent tracing failure rate of 5 percent. Canada has the advantage, compared with the United States, that addresses used for tracing are at most five years out of date. The tracing failure in 1960 in the United States was somewhat higher than the PEP unresolved match rate in 1980; the Canadian tracing failure rate is lower than the 1980 PEP unresolved match rate. Post-enumeration surveys and administrative record techniques do not make use of tracing in estimating the undercount.
Geocoding
Geocoding is the determination of census geography, for example, census enumeration district, for the address of a record included in the evaluation program. Relative to nonresponse, geocoding does not appear to be a major problem for the PEP. In 1980, incomplete or impossible geocodings, when the address was complete, were responsible for only a small part of the unresolved matches. However, geocoding (more generally geographic errors) affected PEP errors in a more subtle manner: by increasing the apparent gross overenumeration and underenumeration levels and thus putting a greater strain on the complex estimation method, canceling out large offsetting errors. In 1990, the Census Bureau is planning not to use geocoding as a preliminary step prior to matching, but rather to use the address as an alphanumeric string that can be matched directly (see Jaro, 1985). The reverse record check does not depend on a refined level of geocoding. Matching administrative lists to the census depends on geocoding to the same extent as a post-enumeration survey.
Matching
Matching is statistical-based inference as to when information for two records on one or two lists does or does not represent information for the same individual. Matching problems, given complete information, were the cause of only a small percentage of the unresolved matches in the 1980 PEP. For reverse record checks, matching is not intrinsically required to estimate net undercoverage. However, matching is used in the preliminary efforts at tracing. Multiple and composite list techniques are, of course, exceedingly dependent on matching. Matching administrative lists, particularly local lists, is especially troublesome as the number of lists increases, due not only to the increased computation but also to the likely incompatibility of many of the reporting and coding practices for these lists.
Dual-System Estimation: Independence and Equal Capture Probabilities
The problems with the assumption of independence for the inclusion of people in the census and the evaluation study list and the assumption of equal capture probabilities are related to undercoverage problems discussed above. The estimation of undercoverage when using dual-system estimation is believed to be quite sensitive to these assumptions. Information on nonindependence for certain demographic groups (see Ericksen and Kadane, 1985) has indicated the possibility that the undercoverage rates may be higher than those estimated assuming independence (see Chapter 8). Administrative lists have the same sensitivity to the failure of these two assumptions. Reverse record checks do not use dual-system estimation to provide estimates of undercoverage, since the underlying assumption is that the frame used for the reverse record check sample is essentially complete.
Balancing of Overcount and Undercount
The difficulty of balancing over- and undercount, faced by post-enumeration programs that do not sample compact area clusters such as city blocks, has as yet an unknown impact on coverage estimates. The difficulty arises because two different survey vehicles (the P and the E samples in the 1980 PEP) must exactly balance with respect to their estimates (confounded with other estimates) of the number of census enumerations assigned to the wrong geographic area. Since net undercount is estimated as a residual by subtracting the E sample estimates from the P sample estimates, and since both are substantially higher than the net undercount, the latter may be significantly affected by the supposedly offsetting errors not balancing one another. The reverse record check is not subject to this source of error.
Components of Demographic Analysis
Obtaining Data for Undocumented Aliens
This component was clearly the most difficult one for demographic analysis in the 1980 census. Since uncertainty in the number of undocumented aliens in the United States is at least a million or so either way, a major improvement in the precision of the measures of this component of the population is necessary before demographic analysis can be comfortably used in the future.
Completeness of Birth Registration
As time passes, an ever-increasing proportion of the population has been born in the period during which birth registration has been essentially complete. For the 1990 census, reliable information on births will be available for most residents 55 or younger, nearly 80 percent of all residents. Since those age 65 and older will be covered by Medicare information, a fairly small group will remain with less reliable sources of registration. Furthermore, the development of models of the completeness of birth registration is proceeding. This is not a component in need of great attention.
Completeness of Death Registration
Death registration is virtually complete and a very minor contribution to the error in demographic analysis.
Legal Immigration and Emigration
Data on immigration are subject to problems. However, the most problematic component is emigration, for which there is as yet no direct estimate. Relative to other components, legal migration is probably subject to greater error than birth and death records, but to less error than undocumented immigration. An interesting by-product of the reverse record check is the possibility of a direct estimate of emigration.
Internal Migration
Censuses have obtained data on interstate mobility, but their quality is generally considered inadequate for use in coverage estimates. This precludes the use of these data for the development of subnational estimates of undercoverage.
Evaluating the Evaluation
To better determine where the difficulties lie in the application of coverage evaluation programs, especially demographic analysis, there is a need to develop estimates of variability of the estimates of undercoverage. Sensitivity analyses should also be carried out to determine the effect of various assumptions, input data quality, etc., with respect to the resulting estimates. This topic is discussed further in Chapter 7.
When one is considering the major sources of error in coverage evaluation programs, it is necessary to compare the results with an investigation of the errors present in the census. Coverage evaluation programs are attempts to measure errors of the census, and their results are used by the Census Bureau to understand the errors so that action can be taken to make improvements. Chapter 5 presents information gathered from the various methods used to evaluate the coverage of the decennial censuses on differential rates of undercount and overcount among groups in the population.
APPENDIX 4.1
AN INTRODUCTION TO ESTIMATION FROM MULTIPLE LISTS
Government administration generates large lists maintained for various purposes. Examples include social security registration lists, Medicare eligibility lists, and the Internal Revenue Service individual income tax return files. Local governmental bodies have other files, for example, school enrollment lists, lists of driver’s licenses, and voter registration lists. These are referred to as administrative records, which have been put forth as having potential for improving the decennial census.
Although other applications have been suggested (see Alvey and Scheuren, 1982), this appendix deals with using administrative records, or multiple lists, as part of an estimation process to help determine the “true” population count. The estimated count can then be used for coverage evaluation and also, of course, for adjustment, as suggested by Ericksen and Kadane (1985). Estimation from multiple lists is performed through the use of list matching, that is, the determination of when information for two individuals on the same or different lists is in fact information for the same individual. Appendix 4.2 discusses the operational techniques involved in list matching. This appendix is mainly concerned with the statistical estimation models used in conjunction with list matching, their definition, purpose, and advantages and disadvantages.
An important advantage in using an administrative record match for coverage evaluation is that it does not rely on a household survey or a previous census. As indicated earlier, surveys tend to miss many of the same people as censuses. A second advantage is the possibility of focusing more sharply on the kinds of people most likely to be missed, by including such lists as AFDC recipients, or those collecting unemployment insurance.
For the purposes of this discussion, it is convenient to assume that the matching has been carried out perfectly: that is, every list contains only correct information for its members, especially the address; every list in use has been unduplicated correctly; every list has been purged of erroneous enumerations; there are no false matches; and there are no false nonmatches.
The basic model used in estimating the total population from two incomplete lists is called dual-system estimation. (As Chapter 4 details, in other contexts it is referred to as capture-recapture estimation.) The process may be stated as follows. Assume that one has two lists of a population, one from the census, and it matters little if the other list is a sample from a (possibly theoretical) parent list. Given that one has observed the total number of individuals on each list, and the number of individuals jointly on
the two lists by matching, how can the remaining members of the population be estimated? These quantities lead to four elements of a two-by-two contingency table, given in Table 4.4. The resulting question is how one estimates the size of the n00 cell. (For purposes of this discussion, the important assumption of equal probabilities on the two lists (or more) will be used. Its impact on the estimate is discussed above briefly in Chapter 4.)
In order to estimate the size of the n00 cell, or equivalently the n++ cell, it is necessary to assume a model relating the entries of the cells. An assumption that is commonly made is that the mechanisms for inclusion in the two lists operate independently; that is, that inclusion in the census given inclusion in the other list is equal to the probability of inclusion in the census, and that this probability is the same for everyone. It follows that:
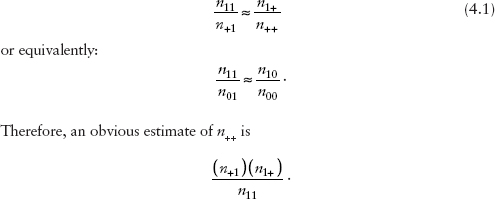
TABLE 4.4 Two-Way Table Underlying Simple Dual-System Estimation
| Caught in the Other List | Missed in the Other List | Population Total | |
| Caught in the census | n11 | n10 | n1+ |
| Missed in the census | n01 | n00 | n0+ |
| Population total | n+1 | n+0 | n++ |
More generally, we can parametrically specify the relationship between the two ratios in equation 4.1:
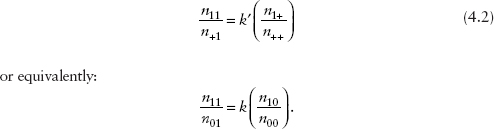
In this formulation, it is first necessary to estimate k′ or k in order to calculate n++ or n00. When k, sometimes referred to as the cross-product ratio, is determined or believed not to equal 1, the mechanism for inclusion in the two lists is said to have “correlation bias.” We discuss correlation bias and the parameter k more fully in Chapter 8.
Many modelers have assumed that k equals 1, that is, independence of the two processes, although the validity of that assumption is usually uncertain. One method of increasing the intuitive strength of the independence assumption is to stratify the population of one of the lists and to use dual-system estimation separately on each stratum. This can be a powerful tool for lessening the impact of dependence (see Marks et al., 1977). However, stratification assumes that one understands the mechanism for being missed on each list and knows what variables one should use to stratify.
There are a number of alternative methods of estimation. One approach is to obtain and then merge several lists, then match the resulting composite list to the census. One would then use dual-system estimation on the resulting two-by-two table, assuming that k equaled 1 for this two-by-two table. The merged list is likely to be both more complete and more representative of the population than any of the individual lists, and the values of n10 and n00 will be smaller. (By representative we mean that no identifiable population, e.g., demographic group or persons residing in a specific region of the country, is missed relatively more often by the composite list than any other identifiable population.)
One can effectively merge a sample of the noncensus lists by sequentially matching them and then matching the merged list with the census. Kadane and Lehoczky (1976) present an efficient method for ordering the lists to be sequentially matched. Ericksen and Kadane (1983) applied this technique to prepare their estimate of the proportion of New York City’s population that was undercounted in 1980.
| Included in Census | Missed in Census | |||
| Included in second sample | n111 | n011 | n+11 | |
| Missed in second sample | n110 | n010 | n+10 | |
| Total | n11+ | n01+ | n+1+ | |
| Included in second sample | n101 | n001 | n+01 | |
| Missed in second sample | n100 | n000 | n+00 | |
| Total | n10+ | n00+ | n+0+ | |
| Included in second sample | n1+1 | n0+1 | n++1 | |
| Missed in second sample | n1+0 | n0+0 | n++0 | |
| Total | n1++ | n0++ | n+++ | |
NOTE: In this table, each subscript indicates inclusion (1) or exclusion (0) in each of three lists, representing two lists and the census.
Another approach, which we call multilist, is to match completely all the pairs of lists, including the census. If there are j noncensus lists, this requires j(j + 1)/2 total matches. If one is willing and has the resources to perform all these matches, then one has many estimates of the number of people missed by all the lists from which to choose. The resulting mathematical structure is a 2j+1 contingency table (see Table 4.5 for the notation for three lists).
Some estimates of n000 are (see Marks et al., 1977):
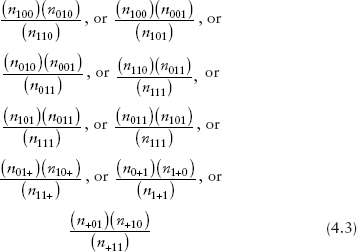
and various combinations of these nine estimates. The use of the first six of these estimates individually implies something about a parameter similar to the k and k′ above being set equal to 1, but these new parameters relate to conditional independence assumptions. It is sometimes believed that these assumptions are more realistic or less sensitive to failure than the unconditional assumptions made with only two lists. Furthermore, by examining other complete subtables, that is, subtables not involving the missing cell n000, various independence and dependence assumptions about the incomplete subtables can be checked, in a weak sense. The last three estimates given in equation 4.3 relate to marginal tables that are equivalent to the pre-merging of two of the three lists. At any rate, if n000 is smaller than n00 would be, this alone would make the estimation of n+++ less sensitive to assumptions.
A third approach, offered by Cormack (1981) and Pollock et al. (1984), is to use covariate information in modeling the probability of an individual’s capture in each list. In these papers, the usual log-linear parameterization of the 2j+1 contingency table resulting from the complete j-way match is replaced by a parameterization relating, for example, the probability of being captured in the ith list given that the individual was captured in the i – 1st list. This gives one a different interpretation of the missing cell, whose entry is now a function of the parameters estimated from the nonmissing portions of the table.
There is finally a need in any discussion of multiple list estimation methods to point out the hazards of multiple list matching. The grave disadvantage of multiple list matching is that successful matching assumes a level of administrative sophistication that is unlikely to be the case in practice. Although in theory it seems easy to match individuals between lists, in practice it is far from easy to avoid false matches, false nonmatches, and ambiguous matches that may have a substantial impact on results. All administrative lists contain errors resulting from intentional misreporting, unintentional misreporting, or data entry imperfections; furthermore, records in administrative lists have differing reference dates, and revision practices will vary between lists and between individuals within lists. The inability of the 1980 PEP to match more than 92 percent of individuals between the 1980 census and the April 1980 CPS despite almost exactly equivalent reference dates and extensive follow-up investigations is illustrative of the problems involved. These problems are likely to be even more severe with the use of administrative lists maintained for other purposes with different record-keeping priorities. Some of these issues are discussed in Appendix 4.2.
APPENDIX 4.2
OPERATIONAL ASPECTS AND MODELING OF COMPUTER MATCHING
This appendix describes the physical operations and statistical models underlying the process of matching two lists (or unduplicating one file). The statistical models discussed relate to a different issue from the one addressed in Appendix 4.1 when the models are to be used after the matching has been completed. The models discussed here provide one with an objective means of deciding which records to link as well as estimates of the resulting error rates. A good overview of the subject of matching is presented in Federal Committee on Statistical Methodology (1980).
OPERATIONAL DIFFICULTIES OF MATCHING
Before proceeding, in order to appreciate the overall cost structure of matching, it is helpful to understand the social and operational obstacles to the use of administrative records in list matching. A major concern is the public reaction to any possible encroachment on the confidentiality and privacy of their individual records. In the interests of satisfying respondent concerns over the privacy of the census questionnaires, neither names nor addresses of respondents, except for a small sample of households involved in a few components of the coverage evaluation program, were recorded in machine-readable form in the 1980 decennial census. Thus, in 1980, the Census Bureau was able to assert to uneasy respondents that its files could not be used for large-scale government record linkage. In 1990, the current plans of the Census Bureau are to capture in machine-readable form both name and address for input into a computer matching algorithm. However, the potential for actual invasion of privacy is not very great in coverage evaluation programs, since the number of persons involved is such a small percentage of the total population.
Operationally, there are serious problems in list matching administrative records. First, the quality of the information on many lists is not good. There are duplications, erroneous entries, and missing data. For example, the addresses on social security files, except for beneficiaries, are not current. In addition, the more lists that are merged, the higher the chance of significant undetectable duplication on the merged list—which, when matched against the census, will inflate the estimated undercount.
Many lists, for example, the census itself, do not have an identification number, such as the social security number, to facilitate matching. Without such an identification number, matching must make use of such items as name, address, age (possibly birth date), sex, and race.
Unfortunately, addresses in administrative records are frequently not the residence address required for a census match but a mailing address or an obsolete address. Finally, the combination of the above complications usually results in a large percentage of cases for which match status cannot be resolved. The treatment of these unresolved cases can have a substantial impact on the resulting undercoverage estimates.
The general algorithm underlying matching is based on the similarity of the information for two individuals under comparison in two files. Every record from one of the two files is assigned a 0 or a 1, denoting, say, unmatched or matched. (Later on, we will see that there is an important third class that is assigned a “do not know” status.) Thus, two candidates for matching are identified. If their characteristics, for example, name, address, sex, age, race, and birth date, are the same, or close, the algorithm will assign them a “1” for match status. In the absence of a single error-free identification number, the more discriminating the matching characteristics (e.g., birth date as opposed to sex), the fewer the false matches; and the more error-free the characteristics, the fewer the false nonmatches. The key to matching well is weighting the similarity or dissimilarity of the characteristics information so that few individuals are misclassified.
Matching, when one of the lists is as extensive as the decennial census, and even for considerably smaller lists, cannot possibly be done by searching the entire large file for each record on the other list. Therefore, the search is limited to a likely subset of the census file. To define this subset, one or more characteristics are chosen, then equivalence classes or blocks of responses for these characteristics are identified, which have the property that when two records are located in different blocks, the likelihood of a match is considered to be quite small. When such a variable, or variables, is found, the large file (the decennial census file) is restructured so that only those records that are located in the same block are checked for possible matches. Blocking necessarily involves a trade-off: incurring some number of false nonmatches in order to reduce costs by a significant margin.
The question of how to block effectively has a statistical framework initially articulated by Fellegi and Sunter (1969). Kelley (1984b) has also investigated this issue.
In 1980, in the Post-Enumeration Program, the blocking used was geographic. Possible matches were searched for only in the same enumeration district as that of the address of the Current Population Survey interviewee.
This was necessary due to the limitations of a clerical match. However, the Census Bureau is developing and testing sophisticated software to reduce, possibly to under 40 percent, the percentage of the matching that will-need to be handled clerically in 1990. This automation of the matching process should also allow less restrictive blocking to be used.
The selection of identifying variables available in both files can be an important aspect of matching algorithms. However, in the particular case of the coverage evaluation programs for the decennial census, variable selection is more or less predetermined. This is because matching requires the use of short-form information only, such as name, address, age, sex, and race. There are not a great many more variables on the short form to choose from that would help determine match status. When one has more latitude, variable selection is driven by two considerations, as mentioned above: (1) the quality of the response for that variable, and (2) the discriminating power of the variable.
A MATHEMATICAL MODEL FOR RECORD LINKAGE
Fellegi and Sunter (1969) developed a mathematical model for matching, or record linkage, which the Census Bureau is using in its software system for automated matching. A brief description follows. First, assume that one wishes to match files A and B. The ordered pairs of elements (a,b) from these two files, where a ∈ A and b ∈ B, is the disjoint union of two sets:
M = [(a,b); a = b, a ∈ A, b ∈ B] (the truly matched set), and
U = [(a,b); a ≠ b, a ∈ A, b ∈ B] (the truly unmatched set).
In order to determine the match status of any two records, it is necessary to compare their set of characteristics. To do this, a comparison vector is created, which is a vector function of the records, x(a) and x(b), more precisely, of the common identification information contained in the records. This comparison vector is written:
g[x(a), x(b)] = {g1[x(a), x(b)], . . . , gk[x(a), x(b)]}.
Typically, gi[x(a), x(b)] is the coded result of the nature of agreement or disagreement between the ith identifying variable (e.g., age) of the two records. All matching inferences about the records (a,b) are made on the basis of the vector g, which codifies the pattern and nature of agreement and disagreement between the pair of records a and b. Three possible
decisions can be made based on an examination of the vector function g: (1) decide to link a and b, (2) decide not to link a and b, or (3) choose not to make a decision. This decision rule, which we will denote as d(g), is a function of the comparison vector.
Now, given that one is taking a set of random pairs from A×B, one must consider the likelihood of observing the comparison vector g given, respectively, that the pair (a,b) came from M or came from U. These are written:
m(g) = Pr{g[x(a),x(b)]|(a,b) ∈ M} and u(g) = Pr{g[x(a), x(b)]|(a,b) ∈ U}.
The two types of errors associated with a linkage rule are: (1) deciding to link unmatched individuals and (2) deciding not to link matched individuals. Setting these two errors respectively to e1 and e2, Fellegi and Sunter defined a decision rule d(g) as optimal if, given all rules that have errors of type 1 less than or equal to e1, and type 2 less than or equal to e2 as above, the probability of making no decision is smallest.
The above problem was shown by Fellegi and Sunter to yield an optimal decision rule, which, roughly, decides to link all the cases in which the ratio m(g)/u(g) is high and not to link all the cases in which m(g)/u(g) is low. This is equivalent to a likelihood ratio test. The two threshold levels (above which to link and below which not to link) are determined to yield the two types of error, e1 and e2, at prespecified levels.
The difficulty that remains is that of estimating m(g) and u(g). Fellegi and Sunter provide two methods for accomplishing this. One might have prior knowledge from other studies of the errors to which variables involved in linkage are subject. The errors might also be estimated on the basis of comparing a small sample of records that are known to match and observing the lack of agreement in the identifying variables (see Arellano et al., 1984). Iterative procedures are also conceivable in which initial match status is determined, which then provides more refined estimates of m(g) and u(g). Finally, we note that records that cannot be matched at the level of predetermined error rates, e1 and e2, have to be followed up—either through clerical matching or by obtaining additional identifying information for them.


