
7
Adjustment of Population Counts
“Since the first census in 1790 there have been problems in finding and accurately counting every person living in the United States” (Hogan, 1984a:2). However, two things are new in recent decades. First, the Census Bureau has developed and published quantitative measures of coverage error, measures that show that net undercoverage varies substantially by age, sex, race, and Hispanic origin. Second, the number and kind of uses to which census data are put have multiplied. Thus, concerns about the consequences of differential coverage error have increased as has pressure for the Census Bureau to reduce differential coverage error. Both improvements in the actual census count and subsequent statistical adjustment of that count have been urged. In 1980 the Census Bureau undertook a major effort to improve the actual count, especially for minority groups, but decided against subsequent statistical adjustment. However, many constituencies have urged adjustment and some have instituted litigation to require it.
The ultimate goal of the decennial census is that of accuracy of the final census numbers. The evaluation studies undertaken by the Census Bureau broadly identify inaccuracies and provide information that would be desirable to use. Therefore, the panel is led to recommend that adjustment procedures be developed with the objective of improving the accuracy of the census products.
Adjustment aims, by supplementing the census counts with other information, to produce more accurate population estimates than the raw counts. Adjustment may be carried on to characteristics data as well. The quality of
the adjusted census depends, then, on the accuracy of the census counts and the other information used as well as on the adjustment procedure adopted.
An adjustment of census figures for a region with a low completion rate would produce numbers that, although closer to the true values than the unadjusted numbers as best one can tell, would still have a great deal of uncertainty attached to them. The panel thus attaches great importance to the goal of completeness of the census count and views possible subsequent adjustment of that count as a complement to—not a substitute for—continued efforts to improve census coverage. The traditional nature of the census as an operation in which “each person stands up and is counted” should be maintained. If public perception of the importance of being counted were to deteriorate, participation in what Kruskal rightly terms a national ceremony (Congressional Research Service, 1984:49) might decline, with serious consequences for the accuracy of the census numbers, adjusted or not.
The goal of accuracy is often unclearly specified and can have different meanings in different contexts. For government entitlement programs that use the census numbers by comparing them with a cutoff point, the degree of inaccuracy is critical only when a number is close enough to the cutoff point that a funding decision would be affected. For programs that use the relative change from census to census, the accuracy of the estimate of change is the goal. For programs that determine political representation or distribution of public monies through allocation procedures based on census information, the relative accuracy of the census in different geographic areas is crucial. As reviewed in Chapter 2, there is evidence that differential coverage errors importantly affect both political representation and fund allocation. The panel believes that adjustment procedures should focus on minimizing these errors. In recommending this aspect of accuracy as a primary goal, we recognize that statistical adjustments that help achieve it may reduce the accuracy of certain other census information, for example, measures of change from prior censuses. We also recognize the importance of other aspects of accuracy, in particular, errors in the counts themselves, for many research, planning, and program purposes of local and national users. Minimizing differential coverage errors should reduce rather than increase most of these, but a different focus might reduce them more. We invite further study and discussion of the implications of our focus on minimizing differential coverage errors.
In recent censuses, the production of what is referred to as the “actual census count” already involves, for a minority of the census households, a variety of statistical procedures: imputation for forms damaged in processing, imputations of persons in housing units believed to be occupied although no one was ever found at home, imputation of missing data in partially filled-in census forms, etc. (see Bailar, 1983c; also see Appendix 3.1). Although it would not be the first instance of the use of statisti-
cal modifications in the census, making further adjustments to the census of the kind we discuss in this chapter would importantly increase the use of statistical procedures in census-taking. The panel believes that it is not a question of taking a stand “for” or “against” adjustment, as adversarial circumstances press one to do. The decision-making process relative to adjustment requires a dispassionate rounded discussion recognizing the full range and complexity of the technical issues.
The adjustment question is in reality a series of interrelated questions: If an adjustment is to be made, what is to be adjusted—the count, or some or all of the other census information? By what procedure? At what level of geography? With what impact on the accuracy of a variety of census numbers? On what time schedule? For what uses of census data? So that the dataset is internally consistent or not? In the remainder of this chapter, we summarize some of the technical information pertinent to these questions and present the recommendations to which we are led. Many technical questions remain to be answered if adjustment procedures are to be developed in time for their use in the 1990 census. On the whole, while much effort will be required, the panel is optimistic that substantial progress can be made, and many feel that this progress could well be sufficient to permit adjustment to become a feasible and desirable part of the 1990 census process.
One of the questions raised with respect to the issue of adjustment is the extent of adjustment of characteristics information. If an adjustment is implemented, the panel recommends that it be carried down to the microdata level. This would, practically speaking, be expressed as a reweighting of individual records and, hence, would represent a coverage-based adjustment of characteristics information as well as the counts. However, one could at the same tine adjust characteristics information through models using information from content evaluation programs (see discussion in Chapter 6). Models for the misresponse of characteristics information, such as the underreporting of income, and models for the characteristics of uncounted people could be attempted. One possibility would be to develop models at an aggregate level and then carry the adjustment down to the micro level using methods discussed below. The development, testing, implementation, and evaluation of such models involve complicated, difficult issues that the panel has not had time to adequately discuss. For the purposes of this report, the panel has decided to concentrate on the adjustment of population counts, with the adjustment of characteristics that such a reweighting of individual records entails.
Recommendation 7.1. Completeness of the count is an important goal, both for ensuring the accuracy of the census and for establishing the credibility of the census figures among all users. Adjustment should not be viewed as an alternative to obtaining as complete a count as possible
through cost-effective means. Nevertheless, the ultimate goal is that of the accuracy of the published figures. Given the likelihood that the census will continue to produce different rates of undercoverage for various population groups, and given the equity problems caused thereby, we recommend that work proceed on the development of adjustment procedures and that adjustment be implemented if there is reasonable confidence that it will reduce differential coverage errors.
We note that there are several different methods of adjustment that have been suggested so far, and we anticipate that others will be proposed. It is possible that a variety of alternatives, including compromise possibilities, will be developed with evidence that each would be an improvement over the census count, but with no obvious basis for choosing among them. In our view, this situation should not by itself preclude the Census Bureau from making adjustments and picking one of the alternatives.
EVALUATING ADJUSTMENT: LOSS FUNCTIONS AND YARDSTICKS
One would like to evaluate the numbers produced by the census (either based on raw counts or based on adjustments to those counts) by comparing them with the true values of those numbers in the population if one had a completely accurate census. Since one cannot know those true values, one must use methods external to the actual census process to obtain an independent estimate of those values. (Some of the methods are described elsewhere in this report.) Each of the methods entails positing a model or assumptions about both the nature of the errors in the census (i.e., about the process by which individuals may be either not included or double-counted in the raw data) and about the nature of the method (and its underlying data) that produced the independent estimate of the census values.
Each of two considerations has a place in the evaluation of census numbers, the error in the number itself and the resulting loss to society due to erroneous treatment of political jurisdictions (or other uses of the census number). By error we mean the difference or the relative difference between the number produced by the census (either the raw or adjusted count) and the true value for that number in the population if we had a completely accurate census. By loss we mean a numeric measure of the impact of the error in the census number both for each political jurisdiction and for the United States as a whole. For this discussion we call these numeric measures “loss functions.” As we are interested in net social gain, our prime consideration is the overall loss function for the country as a whole, and not the separate loss functions that may be adduced for each separate political jurisdiction. A jurisdiction’s gain or loss of funds or political representation
due to error is understood to be always a nonnegative loss from society’s point of view. We are not taking the point of view of a single jurisdiction, which might be that any gain is a good thing, or of a social planner second-guessing the political process, which might be that some errors benefit society by counterbalancing deficiencies in laws and social policies, or even in other data, for example, on income.
The determination of the appropriate loss function for the country as a whole is a difficult task. Moreover, it is impossible to determine a single loss function that is appropriate for evaluating every effect of an error in the census numbers: each use of the census numbers has a different effect resulting in different components of loss.
In the most general setting, loss functions should reflect the cost to society of data collection, data processing, and data dissemination as well as the costs of basing decisions on imperfect information. Decisions on data collection procedures themselves are influenced by costs difficult to evaluate. (For example, what is the cost to the respondent of one additional question on the census form?) Thus, loss functions influence census data collection procedures as well as estimation procedures and hence considerations of loss are involved in decision making for census procedures besides those involved with adjustment.
A discussion of loss functions should not be limited to issues related to the question of adjustment. The need to determine an appropriate loss function underlies most of the decisions that the Census Bureau makes. The determination of an appropriate loss function is typically accomplished, necessarily, without understanding the precise costs associated with various decisions. The panel feels that loss function considerations enter importantly into all aspects of census methodology and the panel’s recommendations in other chapters have implicitly reflected such considerations. We are formally discussing loss functions in the context of adjustment because of the focus in the public debate on how to measure the consequences of introducing adjustment procedures into the census.
In what follows we first discuss loss functions from the point of view of the uses of the census numbers, after which we consider their relationship to adjustment procedures.
A User’s View of Loss Functions and Adjustment
Concern about census coverage error arises less because of net national undercoverage than because of differential undercoverage by geographic location and demographic group. Differential undercoverage causes differences in political representation and distribution of public monies from the allocation that would result if a completely accurate census could be taken, differences that may work to thwart the intent of laws governing represen-
tation and fund distribution and that are often perceived as unfair. One of the principal reasons for adjustment of the counts of census data would be, by reducing differential coverage errors, to reduce the impact of these errors on political representation, fund distribution, and other public programs.
Because the data produced by the decennial census have many uses, the benefit of accuracy in the published numbers is difficult to measure. Indeed, the benefit may vary from use to use. Congressional apportionment, for example, requires only population totals by state, whereas the revenue sharing formula uses population and per capita income for each incorporated place. Whether adjustment of population totals by state—resulting in more accurate congressional apportionment—will also result in more accurate distribution of revenue sharing monies may depend on how the adjustment is distributed within the state and what, if any, adjustments are made to the per capita income estimates. How the different loss functions can or should be reconciled in order to preserve consistency between the uses of census data for different applications is an issue for which the panel has in the abstract little advice to offer.
Even for any single given use of census data, the benefit of adjustment may vary from place to place. Suppose, for example, that midwestern central cities were grouped into a domain and the census results for each city adjusted by the same formula. Since the precise undercounts and characteristics used in the adjustment for each city will differ among the cities, after adjustment some cities will be closer to the “true” count than others. Adjustment might improve accuracy in these cities as a group, but not in all cities equally, nor in every city. Nor would they benefit equally, and some might be adversely affected (lose federal funds or representation).
It must be accepted that no adjustment procedure can be expected to simultaneously reduce the error of all information for every location in the United States. Rather, adjustment should be undertaken when there is reasonable certainty that appreciable reduction in the general differential coverage error will be achieved. A relatively trivial reduction would not be worthwhile, since adjustment will surely cost time and resources to implement, and doubt about whether the adjustment did or did not reduce differential coverage error would impair public confidence in census figures. Furthermore, knowledge of a subsequent adjustment might reduce public cooperation, thus lowering the completeness of the census count.
For an effective adjustment procedure to be widely accepted, given that not all localities will benefit, it is important that there be as widespread understanding and agreement as possible within the professional community of statisticians that a general reduction in differential coverage error is sufficiently desirable to accept adverse impacts on some individual localities. More important but difficult to obtain is this understanding throughout all levels of government (see Keyfitz, 1979).
In other words, localities need to recognize two important points regarding adjustment. First, the standard of comparison should not be the raw census count. That is, an adjustment that lowers the population count for an area may have reduced the error in the estimate for that area as much as an adjustment that raises the count for another area. Second, although adjustment may increase error for some localities, the country as a whole may still benefit if adjustment has reduced overall differential error. One further point: although each locality will know whether its count was higher or lower after adjustment, we can reasonably require of an adjustment procedure that each locality’s error is more likely to be reduced than increased, and that no locality will have good reason to believe otherwise, even post facto.
The panel believes that it is substantially more important to reduce the general error per person than the general error per place. Hence, the panel does not recommend the use of loss functions for measuring the total error that weight each political jurisdiction equally, for example, that determine the proportion of the 39,000 revenue sharing jurisdictions that gained or lost through adjustment, regardless of the number of people in each jurisdiction. Rather, the panel believes that the contribution to total loss attributable to an area should reflect the size of its population.
Recommendation 7.2. In measuring the total loss associated with an adjustment procedure, we recommend that the contribution to this loss attributable to a geographic region should reflect its population size. Thus, we recommend against loss functions based solely on the number of political entities losing or gaining through adjustment.
The next section discusses the properties of several kinds of loss functions and considers specifically how they take into account population size.
Loss Functions and Adjustment
The classical yardstick used by sample survey researchers to assess the accuracy of a single number, chosen principally for its convenient mathematical properties, is the square of the deviation between the number and its true value. Whatever loss function we use to assess the accuracy of a single number, we still must determine a rule for amalgamating the losses associated with each number into an overall loss function for the entire set of numbers produced. The usual tack taken is to sum the individual loss functions.
Using this rule for squared error applied to population gives disproportionate weight to large localities. Consider the following example. Suppose there are two areas, one with true population of 10,000
and estimated population of 11,000, and the other with true population of 5,000 and estimated population of 5,500. The loss for the first area is (11,000 – 10,000)2 = 1,000,000, the loss for the second area is (5,500 – 5,000)2 = 250,000, and the total loss is 1,250,000. The larger area with twice the population of the smaller area and the same percentage error counts for four times as much in the overall loss function.
Using this rule for squared error applied to relative or percentage error (i.e., the square of the percentage deviation between the number and its true value, or squared relative error), also a very intuitive idea, gives disproportionate weight per person to small localities. To continue with our example, the squared relative error for the larger area is [(11,000 – 10,000)/10,000]2 × 100 = 1 percent; for the smaller area is [(5,500 – 5,000)/5,000]2 × 100 = 1 percent; and the total loss is 2 percent. In this case, the larger area counts for no more than the smaller area in the overall loss function.
The following argument gives an in-between notion that may be about right, although we make no absolutist claim for either the argument or the resulting loss functions. Tukey (1983) and Fellegi (1980b) have suggested as an appropriate alternative loss function that of “relative squared error,” that is, squared error divided by the true value. In our example, the respective losses for the two areas would be (11,000 – 10,000)2/10,000 = 100 and (5,500 – 5,000)2/5,000 = 50, with the total loss equal to 150. In this case, the larger area with twice the population of the smaller area and the same percentage error also counts for twice as much in the overall loss function.
Tukey argues for the use of relative squared error on the grounds of its invariance properties. That is, relative squared error has the property that the contribution of the error for one area to the overall loss function is proportional to its size, assuming that the percentage error for all subareas is the same.
Another loss function that has this invariance property and is more tractable computationally (see Kadane, 1984) is squared error divided by the estimated value. Using the same example, the respective area losses would be (11,000 – 10,000)2/11,000 = 91 and (5,500 – 5,000)2/5,500 = 45.5, with the total loss equal to 136.5. Again, the area with twice the population size contributed twice as much to the overall loss function. Both of these loss functions, squared error divided by the true value and by the estimated value, are commonly used in the analysis of contingency tables.1
__________________
1 Note that squared relative error (relative to either the true or estimated value) is different from relative squared error and does not have the same invariance property. All are weighted versions of one another. Thus, relative squared error and squared relative error (relative to the true value) are simple squared error weighted by the reciprocal of the true value and the reciprocal squared, respectively; relative squared error is squared relative error weighted by the true value; and so on.
The foregoing discussion pertains to the construction of a loss function associated with census-produced numbers wherein it is the absolute accuracy of each number that is to be assessed. Concern with minimizing a differential coverage error indicates the need for a loss function that reflects not the error in each number eo ipso but rather that error in relation to the errors in the other numbers within a set of census-produced numbers. For example, we do not so much want to gauge the accuracy of population counts for each county in a state as to gauge whether the inaccuracies are relatively evenly distributed across the counties. The loss functions needing consideration here really measure not the accuracy of the numbers but the “differential inaccuracy” of the numbers. If, for example, each number is 95 percent of its true value, we would like a “differential inaccuracy” loss function to indicate this by having a value of zero.
Tukey (1983) calls such a loss function a “measure of misproportionality” and suggests that one can use for each number the squared difference between the relative error of that number and the relative error of the number of the aggregate of which that number is part. Relative error is defined as the error divided by the true number or, equivalently, as the ratio of the census-produced number to the unknown true number minus 1. If the aggregate is a state total and each component number is a county total, then this measure would be the squared difference between the relative error of the county number and that of the state number or, equivalently, between the ratio of the census to the true number for the county and the ratio for the state. Suppose, for example, that our two areas of population size 10,000 and 5,000, each of which had a relative error of 10 percent, were part of a larger area of population 50,000 that had a relative error of 8 percent. Then the measure of misproportionality for each of the two component areas would be (0.10 – 0.08)2 = 0.0004. If the area of 50,000 population instead had a 10 percent relative error, then the loss function for each of the components would be zero.
To aggregate this loss function across counties, say, Tukey suggests a weighted sum of the component (i.e., county) loss functions, wherein the weights are the true values of each of the components of the sum. In our example, the loss for the area of 10,000 population would count twice as heavily as the loss for the smaller area in the overall loss function.
Research on Loss Functions and Adjustment
One characteristic of the loss functions given above is that they are general in nature and not specific to census data uses, except in distinguishing absolute and differential inaccuracy. Some consideration has been given to use-specific loss functions, in particular in the work by Kadane (1984) on congressional seat allocation and the work by Spencer (1980b) on alloca-
tions of revenue sharing dollars to states. Kadane demonstrates the close relationship between loss functions proposed by Tukey (1983) and the loss function underlying the method currently used in seat allocation. (See Appendix 7.1 for a brief overview of loss functions and apportionment.)
In modeling the revenue-sharing loss function, Spencer suggests that the components are not merely the units receiving revenue sharing dollars but also the (one) source of funding. For each component, he postulates as loss function a constant multiple of the magnitude of the overallocation (if one exists) or a possibly different constant multiple of the underallocation (if any). The overall loss function is an unweighted sum of component loss functions.
The Kadane paper exhibits a loss function for allocating congressional seats among states whose minimization results in the allocation procedure actually used in Congress. In the case of revenue sharing and other major uses of census data, the task of ascertaining an appropriate loss function is more complex. The loss function studied by Spencer was merely a convenient construct, a springboard from which he could proceed to investigate the central issue, the implications of data inaccuracy for revenue sharing
Research on the effect of the choice of loss function on the effectiveness of adjustment procedures has been limited. Spencer (1980a) provides some evidence that the degree of improvement resulting from adjustment is not very sensitive to choice of loss function. Schirm and Preston (1984) studied the effect of a very simple synthetic adjustment (see the discussion of synthetic estimation in a subsequent section), using only two demographic groups, on population proportions across geographic areas using a number of different loss functions:
- The ratio of the sum of absolute errors in the proportions before adjustment to the sum of absolute errors in the proportions after adjustment.
- The ratio of the sum of squares of errors in the proportions before adjustment to the sum of squares of errors in the proportions after adjustment.
- The fraction of total national population that resides in states whose proportions after adjustment are closer to their true proportion than are their proportions before adjustment.
They found, in a limited simulation study, that the decision to adjust is sensitive to selection of the loss function in that the first two loss functions offer consistent recommendations about whether or not to adjust in only about 60 percent of the simulated cases.
Seeking the source of the 40 percent inconsistency can bring us closer to an understanding of the impact of choice of loss function on the adjust-
ment problem. We note first that Schirm and Preston were comparing a particular kind of adjustment procedure with no adjustment. That particular procedure may have been a substantial overadjustment on average in the situations they considered, enough so to be worse than no adjustment in many cases. A milder adjustment might be better in most cases, by either loss function, as far as one can tell.
Second, Schirm and Preston also developed a number of theoretical insights on the effects of a synthetic adjustment, the most important of which was the observation that a synthetic adjustment will probably overcorrect the proportions in states in which the more heavily undercounted group is an unusually large fraction of the population and undercorrect the proportions in states in which it is an unusually small fraction of the population. This implies, of course, that simple synthetic adjustment is inappropriate if one can estimate or guess which states have these properties, or obtain information relevant or related to them. In their simulation study Schirm and Preston found that nearly two out of every three applications of adjustment procedures will bring the majority of the proportions nearer to the truth, and that on average 54 percent of the population proportions will be closer to the true values. Nonetheless, there is a small, but substantial, probability that a possibly large majority of the population proportions is taken further from the true values by adjustment.
In Schirm and Preston’s paper, the choice of loss function does have a strong impact on the choice of adjustment procedure. But when the choice of adjustment procedure depends importantly on the choice of loss function, such dependence suggests that the particular adjustment procedure (or underlying model) under consideration has weaknesses that can be moderated or overcome, perhaps through a combined or compromise procedure. For example, one might average the procedures, or identify the regions for which each procedure is effective and then use the adjustment procedure that is most effective for that region. One might envision an iterative process, with one stage consisting of identification of the improved or compromise procedure and a second stage consisting of the determination of the regions in which the procedure may be improved yet further.
Recommendation 7.3. We believe that, in general, the results of an adjustment are likely to be affected more by the quality of coverage evaluation data and the models and methodology used than by the choice of loss functions. Given a family of loss functions with relatively similar objectives, it should be possible, and desirable, to determine an adjustment procedure that has good performance for most or all of them. We recommend that the Census Bureau investigate the construction of adjustment procedures that are robust to a reasonable range of loss functions.
Modifying Extreme Adjustments
There is a concern that the use of imperfect models could result in adjustments for some small areas that were so different from the census counts as to create a presumption of overadjustment. This could not occur with an ídeal procedure and is very unlikely to occur for large areas and demographic groups. However, the models underlying the methods used for carrying down coverage evaluation information to small areas are rough and make little provision for a small area’s special characteristics. Even if a model is effective by any reasonable definition of the term, it is possible that some very small areas will be adjusted to totals that differ substantially from the census counts. So when the adjustment is essentially finished, a reasonable procedure might involve checking the final adjusted estimates against the original raw counts. One diagnostic check would be to examine all cases in which the adjusted count differed from the census by more than a specified percentage. These might be labeled extreme adjustments. The notion of protection against an extreme adjustment has been discussed in the literature and at the Census Bureau. We mention three procedures that could offer protection against these extreme adjustments.
It has been suggested by Tukey (1985) that one not decrease any area’s count as a result of adjustment. This suggestion is based on the belief that most areas are undercounted, in which case, at least area by area, a no-decrease policy is an improvement. Presumably fewer areas will be critical of an adjustment as long as they are not reduced in population as a result. It appears unlikely that such a constraint will cause undue damage to the primary goal of improving the differential undercount; however, it does not represent protection against extreme upward adjustments.
Hogan (1984c) has raised the possibility of using rough confidence intervals as a buffer against a poor adjustment. These confidence intervals could presumably be developed along the lines discussed below in the section on variance estimation. In his memorandum, Hogan adduces a procedure (one of a family of procedures) that does not adjust as long as the confidence interval includes the original census value. However, if the census counts are outside the confidence interval surrounding the adjusted counts, the adjustment is reduced to the conservative edge of the confidence interval. As an example, should the adjustment be 7 percent plus or minus 3 percent, the area would be increased by 4 percent. This method would help protect against extreme invalid adjustments.
Finally, a policy of refusing to adjust any area up or down by more than so many percentage points could be established. This would share some of the properties of the component protection technique of Efron and Morris (1972), which was used by Fay and Herriot (1979) in their hierarchical
Bayes adjustment of postcensal per capita income estimates (see Appendix 7.2 on hierarchical Bayesian techniques).
These procedures would be needed either because the model for adjustment was imperfect or because the loss function was not appropriate. Since practical considerations inevitably enter into the choice of both model and loss function, such heuristic compromises are a consequence of our currently limited modeling and computational capability. All three methods for protection against extreme adjustments reviewed above are untested in the case of adjusting population counts, have quite different rationales and effects, and are in need of extensive research before they can be recommended for use.
Error Estimation
Our concern to this point has been with the magnitude of the error in the raw census data, that is, the absolute or relative difference between the number produced by the census and the true value for that number in the population if one had a complete census. When one superimposes adjustment procedures on the raw counting process to produce census estimates, an additional consideration enters the picture, namely the statistical properties of the estimation procedure. We are not merely concerned with the error in the estimated census number, but also with the range of variation of that error that is associated with the estimation procedure adopted.
It is convenient to focus our concerns and discussion in terms of two statistical properties of the estimation procedure, its bias and its standard deviation. The determination of these properties presupposes the existence of a model of the process generating the original errors in the census data and, furthermore, knowledge of errors in whatever coverage evaluation information is used. Thus, the bias and variance of, say, synthetic estimation will be quite different depending on whether the unreported data are distributed over subpopulations and regions with probability proportional to size or with probabilities associated in some other specific way with subpopulation or region.
For every underlying model of the census and coverage evaluation error process, estimates of over- and undercoverage and any adjusted census data derived from such estimates will have a range of variation associated with them. A program to estimate the distribution of errors arising from the evaluation and adjustment procedures is needed. Although error can probably be measured only imperfectly, information about the distribution of error is important both for users of the data and for the Census Bureau itself, in the same way that sampling variances for sample surveys are useful even though they omit information on response biases, imperfections in the sampling frame, etc.
The possible errors of local-area estimates, after adjustment, obviously enter into the analysis needed for most decisions discussed in this chapter, for example, models to be used, loss functions, etc. Though we do not discuss error distributions and their impact for each such analysis, some comments on the types of error that affect the adjusted data and the kind of information that is relevant for analysts appear to be useful. We shall use terminology generally applied in sample survey reports, since most users of census data are familiar with those concepts.
The most commonly used models for errors in sample surveys are really about variability of estimates, and start off by decomposing estimation of errors into terms relating to their bias and to their variance. Even in relatively simple sample surveys these concepts cannot always be defined without some ambiguity, and this certainly applies to the complex statistical procedures being considered for use in adjusting the census. However, the decomposition seems useful as a way of thinking about one of the components of errors of the estimates, that due to sampling variability.
Bias can be thought of initially as the national overall error in the census derived from the coverage evaluation program estimate. Components of bias can also be considered, such as breakdowns by race and ethnicity. As in most survey situations, point estimates of bias terms will probably not be available (otherwise they could be used to modify the estimates). However, it may be possible to indicate likely bounds on the biases.
The first element in the variance component consists of the sampling variances of the post-enumeration survey (or allied evaluation efforts). Given usual sampling methods, these variances can be estimated. Distributing the estimated undercoverage among local areas involves another set of errors. The estimation error introduced into the estimate for a particular local area by the method used to carry down the coverage error can be considered as having components of both bias and variance. It is probably useful to think of these components as part of the total mean square error rather than decomposing into the traditional “bias” and “variance” terms. If the data used to provide the “improved” population count are from a post-enumeration survey or some other national sample, it should be possible to calculate between-area mean square errors and estimate parameters of the distribution of errors. An approach similar to the one used for evaluating corrections from the 1970 vacancy check may be feasible (see Waksberg, 1970, 1971). We recognize that the adjustments to be used may be more complex than the fairly simple synthetic adjustment used in 1970, but an adaptation of the general error estimation approach might possibly be applicable. Such calculations would be interesting and useful in assessing the impact of the adjustment procedures on local-area estimates.
We suggest that the Census Bureau explore methods of implementing estimates of error distribution. It may be possible to carry out simulations
with results from the 1980 Post-Enumeration Program. This would be useful, not only as part of a dress rehearsal for 1990 techniques, but also to provide important information for use in loss functions and other factors needed for decision making.
There is, however, another important component of error in the census, namely model error, which is not at all considered by the usual sample survey decomposition of errors because traditional survey methods are model free. The standard sampling variability and bias calculations presume an underlying model of random sampling in the data collection process. Variations in this model, the model of nonresponse and multiple responses to the census, will produce an additional error component. To provide no estimate of it because one knows little about how to calculate this component and to publish merely the sampling variability error components (even if appropriately footnoted) may lead the unwary reader to believe that the published number represents the entire magnitude of the error. We therefore suggest that the Census Bureau investigate methods for providing estimates of this error component as well, for inclusion along with the census figures and the sampling variability error determinations.
There is an alternative way to view the choice of adjustment and the concepts of error and bias. In this alternative view, one does not first produce an “adjustment procedure” and then analyze its error. Rather, one starts with a probability distribution of the true population given the census counts and other information. If a decision is necessary (i.e., to estimate the undercount geographically), a loss function is chosen (see above), and the optimal decision minimizes expected loss (Savage, 1954). Thus, the adjustment procedure is implied by: (a) what the distribution on the true population is and (b) the consequence of various sizes of mistakes one might make, (i.e., the loss function). One implementation of this alternative view for estimated undercount is given by Ericksen and Kadane (1983, 1985) and Kadane (1984).
Recommendation 7.4. We recommend that the Census Bureau explore methods for providing estimates of errors associated with estimates of census over- and undercoverage, with a view to publishing such error estimates along with coverage evaluation results and any adjusted census data that may be issued.
CONSIDERATIONS OF INTERNAL CONSISTENCY
Adjustment of census data could create problems of internal consistency of macro-and microdata from the census. Below we define what we mean by consistency in this context and offer our recommendation for dealing with this problem.
Suppose a set of parameters (unknown population quantities to be estimated) satisfies a mathematical relation. Let each parameter be separately estimated, perhaps even optimally with respect to some specified loss function. Then it does not generally follow that the estimates satisfy the same mathematical relation as the corresponding parameters. For purposes of this discussion we call the set of estimates internally consistent, or for short, consistent, if they satisfy the same relation as the corresponding parameters. This use of the word “consistent” is quite different from the usual usage in statistics, namely, that, as the sample size increases to infinity, the estimator converges in probability to the corresponding population parameter.
The panel believes that there is a valid distinction to be made between the use of statistics designed specifically for a certain purpose and those designed to be used by many people to serve a wide variety of purposes. In the former case the only criterion that should be operative is that the statistics are “best” for the prescribed purpose; they may not be consistent with one another, and there is no requirement of consistency with other statistics or datasets. Typical cases of the latter situation are outputs from the general purpose survey vehicles of government statistical agencies. Given the exceptional range of output and its widespread use, internal consistency is an important quality for general purpose statistics.
The issue of internal consistency is important in relation to the possibility of adjusting census counts on the basis of combining coverage evaluation survey results with modeling. Should adjustment be used, two basic alternatives would arise: a set of adjusted population estimates could coexist with the unadjusted counts implicit in the census microdataset; or the microdataset could be adjusted.
In the former case substantial public confusion is likely to arise. It is difficult to explain, for example, that the population of a county is not necessarily the sum of the populations of its component school districts; or to explain that the population shares might only add up to 97 percent. Similarly, if the microdataset is unadjusted but some higher-level aggregates are adjusted for the estimated undercount, then any substantive tabulation of characteristics at, say, the county level will necessarily have sums for groups or areas at the higher level of aggregation different from the published adjusted population of the county. Given the availability of adjusted counts for higher levels of aggregation, the panel believes that many users will perform their own adjustment of lower-level data, but presumably less effectively than the Census Bureau, at greater total cost, and with the result that different sets of numbers would be in use.
The panel recognizes that current census methodology produces tabulations that are not consistent in every respect. Specifically, the data products prepared from the long-form records are not always consistent with corresponding tabulations in data products produced from the short-form
records. The Census Bureau uses iterative proportional fitting to promote consistency of the short-form and long-form data (see Appendix 3.2 and further discussion in this chapter), but inconsistencies remain. However, each data product from the census is internally consistent; for example, the marginals of a tabulation of income by race and sex contained in summary tape file 3, based on the long-form records, agree with the marginals from the same product of a tabulation of occupation or ancestry by race and sex, and totals for smaller geographic areas agree with those for larger areas. It is consistency in this respect that the panel supports.
Consequently, under the assumption that adjusted population estimates for some geographic aggregations will be produced, the panel favors the alternative of carrying the adjustment down to the level of the microdata. Two basic approaches are available to accomplish this, imputation and weighting. Imputation consists of “creating” the required number and kinds of people in each area and assigning to them a full range of census characteristics, including the detailed set of geographic codes. Weighting attaches to each microrecord a weight calculated in such a manner that the sum of the weights of records coded to an area for which an adjusted count is available is equal to that count. Some methods for carrying adjustment down to the level of microdata are given below in the section on procedures for adjustment.
Weighting and imputation are closely related and each presents some nontrivial problems. Problems arise because the census consists of at least three distinct but closely related microdata files: persons, families, and households. Therefore, together with the total number of persons, the numbers of families and households also have to be adjusted. Previous evaluation studies show that the total number of persons missed has significant proportions of both: (a) persons missed in partially enumerated households and/or families (these cases do not affect the number of families or households but do affect family and household characteristics), and (b) persons missed in completely missed households or families (these, of course, affect the number of such units). Moreover, the proportion of persons missed, either in partially enumerated households or in completely missed households, is known to vary from rural to large urban areas and is likely to vary by race, age, and other characteristics. If adjustment is to be carried out, then it is desirable to estimate the most important of these proportions so as not to cause possibly serious damage to such basic statistics as average family size.
The discussion of methods for carrying down an adjustment later in this chapter notes other problems posed by the various methods in addition to the problem of properly representing both person and family characteristics. Careful evaluation of these methods is essential to the implementation of an appropriate adjustment procedure.
The discussion above relates to the range of outputs provided by what is publicly and officially referred to as “the census.” For special circumscribed purposes it may well be possible and desirable to compute special estimates not consistent with “the census.” Finally, the panel’s brief for consistency is not meant to preclude release of unadjusted census numbers for research purposes. For example, records on the public use microdata sample files could be flagged in such a way that researchers could analyze unadjusted data. As discussed in the next section, it may also be necessary to release unadjusted census figures prior to the availability of final adjusted numbers.
Recommendation 7.5. The panel believes that it is important to strive for internal consistency of published census figures. Should adjustment appear feasible and effective, methods exist for distributing adjusted totals for aggregated groups down to subgroup values. We recommend that one of these methods be used to achieve internal consistency of census figures.
As currently specified by law, the Census Bureau is required to meet two deadlines for specific data products from the decennial census: a deadline for the submission of state population counts within 9 months after Census Day for purposes of reapportionment of the House of Representatives, and a deadline for submission of small-area population counts within 12 months after Census Day for purposes of redistricting (see Chapter 2).
The panel assumes that the above deadlines are likely to be in effect for the 1990 decennial census. It is also reasonable to suppose that there will be pressures in censuses after 1990 for the release of information to meet deadlines at least this prompt. It is certainly conceivable (and considered to be likely by some members of the panel) that it will not be possible to prepare adjusted data in time to satisfy the above time constraints, especially the December 31st deadline for reapportionment. Another possibility is that relatively crudely adjusted state totals could be prepared by December 31st, with more carefully adjusted and more detailed data available later.
Given this contingency, the Census Bureau could first release the unadjusted census figures, to be followed by the adjusted figures when they become available. The first products might be identified as preliminary (or interim), and the later products labeled as final (or revised). Then users, public and private, could decide whether it was worthwhile for their purposes to wait for the adjusted figures. Included in this scenario is the possibility of the preliminary figures being used only for the purpose of reapportionment. This assumes that either the adjustment would be ready in
time for redistricting, or that the redistricting deadline could be postponed enough to accommodate adjustment. In this special case, the inconsistency brought about by the existence of two sets of books would be limited to the counts by states. There is another possibility, that the Census Bureau night be asked to release only adjusted figures and users would wait until they were available. Then, of course, the deadlines given above would possibly have to be extended.
Each of the above scenarios is troublesome. The release of two sets of books would raise the specter of states, litigants, researchers, and others arguing over which set was the “proper” one to consult. It is easy to imagine the furor caused by states that would lose seats in the House of Representatives on the basis of the change from unadjusted to adjusted figures. It is also easy to imagine an equal employment opportunity case resting on the determination of whether the relevant percentage of minorities living in an area was the adjusted or unadjusted statistic. This possibility could be avoided if adjusted data could be released in time for redistricting, thereby releasing only one set of books with microdata. The other scenario, that is, the postponement of reapportionment and redistricting until possibly late 1991 (which corresponds to the date of completion of an initial version of the 1980 coverage evaluation program), extends the period during which political representation is based on population counts a decade or more out of date. Even if the postponement is politically acceptable, the misproportional representation implied by delay needs to be weighed against that implied by use for apportionment (and possibly redistricting) of figures somewhat less accurate than a careful adjustment might produce.
The existence of revised estimates is common today in the statistical system of the U.S. government. Statistics of the gross national product, energy production, consumer prices, and others all experience revisions and alterations, some on a regular basis, others as needed. Users accept the price of revisions and inconsistency (two sets of books) as the necessary cost of accuracy. Continued reliance for a decade on less accurate census data because adjustments to increase accuracy could not be completed by a specific date would, under that scenario, deny the country the potential benefits of more accurate data for uses other than apportionment.
The burden of choice among the above scenarios, which is essentially political, should not be left to the Census Bureau alone. Assuming that adjustment turns out to be feasible and desirable, but that adjusted data cannot meet legislated deadlines, it would be important to have a firm expression from Congress as to which scenario is preferable.
Recommendation 7.6. Census data used for reapportionment and redistricting are required by law to be produced no later than specific dates. It is possible that adjustment of the 1990 census will prove
feasible and effective in all respects, except for the ability to meet the required deadlines. This should not necessarily preclude subsequent issuance of adjusted data for other uses. In this situation, we recommend that the Census Bureau seek determination by Congress of whether it desires that adjusted data be used and will therefore extend the deadlines, or wishes to adhere to current deadlines and will therefore stipulate the use of unadjusted (or partially adjusted) data for reapportionment and redistricting.
Inputs to Adjustment Procedures
Adjustment of the census must be based on one or more sources of information on the number of persons likely to have been missed, either nationally or in a given geographic region. Efforts to obtain good estimates of census over- and undercoverage have now been under way for four decades, and several methods exist for estimating coverage error (see Chapter 4). Up to now, these estimates of coverage error by race, sex, and age were made available to the public in the form of published reports, but they were not used to adjust the census results.
Among the reasons for not making such adjustments have been limitations on the quality of the information used to estimate coverage error and delayed availability of such information, as well as concerns about the public acceptability of adjusted data and about their legality for certain uses. Of these considerations, this panel has been concerned primarily with the technical possibilities for obtaining improved coverage estimates and adjustment techniques and using them in a timely manner. If the technical capability for adjusting the census in such a way as to increase its accuracy exists, we believe public acceptance of adjusted data will follow. (We note that there have been numerous questions raised about the quality of unadjusted data in 1980, evidenced in part by the litigation on this issue, and it is unclear that adjustment would appreciably increase the public concern.) Our detailed recommendations for improved evaluation of census coverage are given in Chapter 8. Here we briefly summarize the basic approaches to coverage evaluation that are available.
Until 1980, the Census Bureau felt that the best source of information about the completeness of the census counts was the demographic method first developed by Coale (1955). This method is designed to provide estimates of differential coverage by demographic groups. However, reasonably accurate estimates by geographic region within the country, using this methodology, have so far not been possible. A further limitation, which proved quite serious with respect to the 1980 census, is the failure of these
estimates, as traditionally constructed, to include any estimate of the number of undocumented aliens. Several million undocumented aliens are believed to have been resident in the United States in 1980 and a substantial, but unknown, fraction of them to have been counted in the census. Thus, the census count included a large group of people (not readily identifiable in the census data) excluded from the demographic estimate. This definitional difference was of sufficient practical importance by 1980 to severely limit the usefulness of demographic analysis for coverage evaluation or for adjustment. Estimates of the number of undocumented aliens counted in the 1980 census by age, race, and sex have now been constructed and used to develop demographic estimates of the coverage of the legally resident population (see Passel and Robinson, 1984; Warren and Passel, 1983). However, only very rough estimates exist for the total population of undocumented aliens, and, hence, demographic analysis can at this time provide only very rough estimates of the coverage of the total population. In addition, the lack of subnational detail remains a serious limitation on the use of estimates from demographic analysis in any adjustment procedure, especially for reducing differential geographic coverage errors.
A program similar to the 1980 Post-Enumeration Program (PEP) provides an alternative approach to estimating coverage errors in the 1990 census. In Chapter 8, we identify four major areas of PEP methodology in need of improvement, some with more, others with less, concrete suggestions on how to proceed. Progress with respect to most of these problem areas is needed for PEP to provide usable estimates for adjustment—either to substantially reduce the errors in PEP or at least to obtain a substantially better understanding of the combined impact of the errors on the resulting estimates.
Other possible approaches to estimating coverage error, not used for coverage evaluation in the United States except in a testing mode, include the reverse record check, which has been used in Canada (see Fellegi, 1980a), systematic observation in a sample of areas, and the matching of census results against a sample drawn from the union of several lists of persons. We discuss some of these alternatives and give our recommendations for further research in Chapter 8.
Below we discuss possible technical approaches to the use of information generated from coverage evaluation programs for purposes of adjusting the decennial census data. Since the estimates derived directly from the coverage evaluation programs are necessarily restricted to a limited number of large areas, and since it is desirable for many purposes that the adjustment apply to small areas, adjustment procedures naturally separate into two components: (1) the manner in which the original estimates are derived for the limited number of large areas, and (2) the manner in which the estimates are carried down from these larger areas to smaller areas. The
objective of consistency argued for above results in the need for adjustment down to the level of the person or household, that is, for some type of reweighting or imputation. Therefore, our discussion of methods for carrying the adjustment down to small areas focuses on carrying down to the level of the person or the household.
Methods for Starting Out
Combining Estimates from Different Programs
It appears that for 1990 the Census Bureau plans to concentrate on two techniques of coverage evaluation: demographic analysis and some version of a pre- or post-enumeration survey. In future censuses, additional techniques may become central to the coverage evaluation program. Indeed, the panel recommends in Chapter 8 that the Census Bureau, as part of its 1990 research program, work on developing other techniques of coverage evaluation, specifically, reverse record checks and systematic observation. Given the substantial indeterminacies involved, not surprisingly, different evaluation programs yield differing estimates of census errors. This is true even for variants of the same procedure. The Census Bureau has produced a range of coverage error estimates from the 1980 PEP based on alternate assumptions (e.g., about the nonresponse in PEP) and did not reach a conclusion as to which estimate was best. Thus, there arises the problem of combining information from various coverage evaluation programs.
One method of combining the information from the different evaluation programs is to use some methods to “benchmark” others. This approach is used when the totals from one method are considered to be much more reliable than the totals from another, even though the internal proportions of the latter are useful. For example, it is quite likely that the estimate of the black national undercount for various age-sex groups derived from demographic analysis will be quite accurate in 1990, since it will be relatively unaffected by the treatment of undocumented aliens.
A more general approach, encompassing benchmarking, is to consider combining the estimates from the various programs in some way. There has been very little work to date on the problem of determining reasonable weights to use in averaging the information from, say, demographic analysis and the PEP, or from various PEP estimates based on different assumptions to deal with nonresponse and record matching problems. More research needs to be conducted to identify models that might be useful in trading off the strengths and weaknesses of the various census coverage measuring instruments so as to form a superior estimate.
Modifying Estimates from Within One Program
Tukey (1985) has suggested that an effective way of tabulating the information from the PEP or a reverse record check with a view to subsequent adjustment is through cross-classification by homogeneous domains. That is, instead of directly producing estimates for political entities such as states, which have heterogeneous populations and therefore on average do not differ very greatly in coverage error, estimates can be produced for combinations of areas that are homogeneous on variables believed to be related to the undercount. For example, one domain might comprise central cities in northeastern industrial states and another nonmetropolitan areas in the Southwest. A benefit from the use of these domains is that the homogeneity within strata should result in lower variances within strata.
Given estimates at the level of homogeneous domains, it may still be possible to improve on these estimates. One can think of the PEP information as being composed of a systematic component and a random component. If the systematic component can be effectively modeled, the model can be used to modify the raw PEP estimates of undercoverage.
Regression is one technique for distilling the systematic component from the observed coverage estimates of the PEP. Variables are examined for their ability to explain the differences in PEP from domain to domain. If these variables (or close surrogates) can be identified, and how they affect the PEP estimates determined, then a model relating the PEP estimates to these variables will help reduce some of the random fluctuation present in the PEP estimates. The choice of these variables involves considerations such as the strength of the relationship to the observed PEP undercount estimates and the quality and availability of the data. Ericksen and Kadane (see Ericksen, 1984) have proposed an adjustment model that uses as variables for each area: percentage minority (black and nonblack Hispanics), percentage conventional census (i.e., the method used largely in rural areas, where enumerators call in person to collect census forms), and the crime rate. The testing of other variables for their explanatory power and robustness, already started, should continue so that these types of models are better understood and the pool of useful variables is better developed.
In considering regression, another benefit from the use of domains is obtained. The values of the covariates for domains that enter into the estimation of regression coefficients should have wider ranges than they would have if one were using states because the domains should be less alike than the states. This increased range of values is known to reduce the variance of the estimated regression coefficients.
The hierarchical Bayesian method (see Appendix 7.2), advanced by Ericksen and Kadane (1985) in the adjustment context, is one technique for assessing the degree to which the systematic part of the PEP has been distilled
and for assigning weights to the regression estimate and the estimate derived directly from the PEP program. Roughly, the observed sampling variances of the PEP estimates are compared with the estimated variances due to the regression. Estimates are combined with weights inversely related to their variances—those estimates with less variance getting more weight. As is true of all models, the hierarchical Bayesian method depends on a number of assumptions, which should be analyzed to the extent feasible to determine the degree to which they obtain. Freedman and Navidi (1986) question the validity of the assumptions underlying the application cited above and observe some lack of robustness with respect to departures from these assumptions as well as the choice of variables. Their work emphasizes the need to validate the assumptions underlying any models made use of in adjustment.
Tukey (1985) has proposed a similar adjustment technique that uses the regression estimates alone uncombined with the observed PEP estimates. The relative merits of regression uncombined with the direct PEP estimates, the observed PEP estimates uncombined with regression estimates, or the combinations possible through the use of hierarchical Bayesian techniques as well as other models need to be researched.
Methods for Carrying Down
Assuming that usable adjusted estimates have been created for domains or states, it still remains to carry the adjustment down to lower levels of geographic and demographic aggregation. At least four methods have been advanced for this purpose: (1) synthetic estimation, (2) iterative proportional fitting, (3) imputation, and (4) regression. We discuss these techniques in turn below.
Synthetic Estimation
The synthetic method, in the context of adjustment, is defined as an estimation process that apportions an overcount or undercount for an area to subareas on the basis of the population sizes of the subareas (see Hill, 1980). This is usually done by maintaining the larger areas’ under- or overcount percentages for demographic groups in the subareas. For example, suppose that there were two demographic groups, I and II, and we were calculating a synthetic estimate of the undercount for a small area A1 within the larger area A. Also suppose, for the larger area, the census and a coverage evaluation program each estimated the population counts illustrated in Table 7.1. The synthetic method would now assume a 5 percent overcount of group I individuals and a 25 percent undercount of group II individuals in every subarea of area A. Thus, the synthetic estimate for area A1 as shown in the table would be 20 × (95/100) + 9(40/30) = 31.
TABLE 7.1 Simple Example of Synthetic Estimation
| Demographic Group I | Demographic Group II | Total | |
| Area A | |||
| Census count | 100 | 30 | 130 |
| Coverage evaluation program estimate | 95 | 40 | 135 |
| Area A1 | |||
| Census count | 20 | 9 | 29 |
| Synthetic estimate | 19 | 12 | 31 |
NOTE: This procedure can be carried out for any number of subareas.
Adjustment via synthetic estimation involves reweighting each individual belonging to a domain and demographic group by the ratio of the count determined by a coverage evaluation program and that determined by the census. Since this procedure reweights individual records, it results in a consistent data set. To arrive at the resulting estimate for any subnational area, the weights for the individuals residing within the area are totaled. (Appendix 7.3 contains a discussion of a problem encountered through the accumulation of synthetic estimates.)
Iterative Proportional Fitting
Iterative proportional fitting is a generalization of synthetic estimation to multiway fitting. Consider first a two-way matrix or table, for which new totals are set for both rows and columns. A synthetic estimate can be computed for each row so that the row totals of the adjusted table agree with the new row totals. Next the columns of the adjusted table can also be adjusted via synthetic estimation, after which one returns to readjust the rows, then the columns, etc., with the entire process iteratively continued. Convergence will occur in most practical situations. This procedure generalizes to any multiway contingency table. The resulting estimated table entries will be completely consistent with the new totals for marginals of the multiway table.
Iterative proportional fitting is currently used by the Census Bureau to force certain tables produced from the sampled long-form records to be essentially consistent with the corresponding short-form data produced on a percent basis2 (see Appendix 3.2). It is a potential adjustment procedure
__________________
2Consistency extends only to row and column totals of tables that are used directly in the iterative proportional fitting algorithm. For tables of data at either different levels of aggregation or cross-tabulated with variables not involved in the iterative proportional fitting, the algorithm will often result in less inconsistency, but not necessarily complete consistency.
for using external totals to adjust the census counts as well. As an example, one could use totals for demographic groups (provided by an improved demographic method) and PEP totals for domains (provided by an improved PEP method) with iterative proportional fitting so that the adjusted counts agreed with the more reliable totals. (This assumes that the overall totals of the national PEP and demographic estimates have been made to agree, perhaps after a combination or reconciliation of some kind.)
When the classification variables are related to the undercount, and reliable estimates of the marginal totals are available, iterative proportional fitting can be expected to result in improvements in the estimated counts (see Oh and Scheuren, 1978). However, when the estimates of the marginal totals are not reliable, or the classification variables are not related to the undercount, iterative proportional fitting can have a detrimental impact on the resulting estimated counts. Research needs to be carried out to determine what the problems are with the use of this technique in the adjustment setting.
Imputation
Imputation (in a manner somewhat similar to that used by the Census Bureau for unit nonresponse adjustment) has also been proposed as a method for carrying down an adjustment to lower levels of aggregation. This procedure is very closely related to synthetic estimation. Suppose that one determined from PEP or another coverage evaluation program that certain percentages of persons belonging to various demographic groups living in a particular domain were missed in the census. Then, instead of reweighting the records for the individuals belonging to each of these demographic groups, as one would in a synthetic adjustment, the number undercounted could be added by duplicating at random the records of people already counted in the census in that domain and demographic group.
Regression
Another potential method for carrying down adjustment to lower levels of aggregation is regression. The use of regression methodology to carry adjustments to lower geographic levels consists of estimating the coefficients of the covariates in a regression model at one level of aggregation as already described, and then estimating the undercount for each subarea by using the same model, with covariate information for that particular subarea.
The panel believes that synthetic or iterative proportional fitting methods of carrying down are superior to simple regression because the regression model used in this way is fitted to a more aggregated set of data than the set to which it will be applied. Moreover, since the covariate
information for smaller areas will have more extreme values than would have been used in fitting the model, there is the potential for extreme adjustments.3
However, the above comments do not rule out a regression approach that is modified by some type of limitation of the adjustment, constraining it to lie not too far away from the original census count (see the previous discussion of this topic). For example, one can use regression to construct weights for individual respondents such that weighted sums match designated population totals for a number of auxiliary variables. In this way regression can be used to derive a consistent dataset. The generalized regression estimator of the total can be written as a weighted sum of the area subtotals, wherein the weights are functions of the auxiliary variables and are so constrained that the weighted sum of each of the auxiliary variables equals the known total of the auxiliary variable used in the construction of the weights. In the census adjustment context, the totals of each of the auxiliary variables might be the adjusted estimates of the total number of individuals in age-race-sex categories at a reasonably high level of aggregation, such as state.
Huang (1978) and Huang and Fuller (1978) have discussed the application of the regression technique to survey sampling for both discrete and continuous auxiliary variables. A computer program that implements the regression weight method is avaílable (Huang, 1983).
Finally, it should be kept in mind in considering the use of any of the above methods of carrying down adjustments to the microdata level that there are unresolved problems of allocating “additional persons” resulting from an adjustment to partially counted households and/or families. These problems, not fully researched, need further investigation.
CENSUS BUREAU PLANS FOR RESEARCH AND TESTING ON ADJUSTMENT
The purpose of the last two sections is to describe the research and testing plans of the Census Bureau with respect to adjustment and present the panel’s reactions to these plans and recommendations for priority research areas. Two documents—“Pretest of Adjustment Operations” (Bureau of the Census, 1984c) and “Requisite Planning and Research Relating to a Decision on Census Adjustment for 1990” (Wolter, 1984)—describe the Census Bureau’s adjustment research and testing program, the former document
__________________
3 It may be confusing to some that we recommend synthetic estimation but not regression, when regression is merely a generalization of the synthetic method. The synthetic method is a special type of regression in that it has only one covariate, the census count, which is presumed to be well-behaved for even fairly small areas.
relating solely to the 1986 pretest, and the latter document giving an overview of the research up until the 1990 census. Much of what is discussed in these two papers relates to coverage evaluation and is covered in Chapter 8. Here we concentrate solely on the aspects related to adjustment. The line separating these topics is not easily drawn, and the reader is referred to Chapter 8 for further discussion.
The paper on “Pretest of Adjustment Operations” outlines a plan for the adjustment of data collected in a census pretest. The idea is to carry out an adjustment and study its timing, costs, and quality. The quality of the adjustment cannot be directly measured, but the Census Bureau intends to examine various indirect indicators of quality, such as: (1) consistency of independent estimates, (2) estimates of components of variance of the estimated undercoverage, and (3) size of nonresponse. There is also the hope that this pretest can identify any unanticipated operational problems with carrying out an adjustment. The product of this pretest will be adjusted tabulations and mock-up publications.
In order to carry out an adjustment, there will have to be a pretest of a coverage evaluation program. This same paper mentions two pretests, one of a post-enumeration survey akin to the 1980 census PEP program, and the other a pre-enumeration survey, whose purpose is to determine the time savings achieved by taking the independent sample survey before the census, balanced against the possible effects on data quality introduced by sensitization of the population (see Chapter 8 for a discussion of this point). The paper stresses the importance of conducting both types of surveys in the same pretest site so that they can be compared on equal terms.
Wolter (1984) describes the current attitude and approach of the Census Bureau toward planning and research with respect to making a decision on adjustment. The needs identified in this position paper are to: (a) measure coverage errors in the decennial census, (b) measure errors for small areas, (c) set standards to judge adjusted data against unadjusted data, (d) supply the input to these standards, and (e) develop the operational techniques and methods to implement an adjustment should it be decided to do so on the basis of (d).
Wolter outlines five major steps as necessary to address the above needs: (1) summarize the 1980 coverage evaluation studies, (2) determine criteria that can be used to assess when adjusted counts are better than unadjusted counts, (3) develop techniques for measuring the undercoverage, (4) decide on an adjustment methodology should the decision be made to adjust, and (5) make the final decision on adjustment. Of these five steps, steps two, four, and five concern plans on adjustment, and we discuss their details below. Steps one and three are covered in Chapter 8.
Step two deals with determining what criteria or loss functions to use in comparing adjusted data with unadjusted data. While there are few details
given with respect to testing and research, the basic approach taken by the Census Bureau will be to: (1) examine the previous literature, including that of Fellegi (1980b), Tukey (1983), and Spencer (1980a, 1980b), some of which were discussed above; (2) examine appropriate loss functions specific to special uses of the census data, for example, examine the revenue sharing formula; and, finally (3) look at the losses incurred by an inaccurate adjustment compared with losses when there is no adjustment. This third substep will be accomplished by: (a) assuming one post-enumeration survey estimate yields “true” counts and then examining the costs of using one of the other estimates based on alternative imputation techniques; (b) assuming regression yields “true” counts and then evaluating the loss incurred by using synthetic estimation; and (c) developing a decision theory analysis to balance probable gain from adjustment with the cost of the adjustment program. This program is related to the discussion on loss functions above, and recommendation 7.3 and the accompanying text are relevant as a comment on these plans.
Step four is concerned with the choice of methodology to use in carrying out an adjustment. The factors underlying this decision are measures of bias and variance for various components of the adjustment methodology for each of the proposed methodologies. For example, the sampling variances and biases given by the post-enumeration survey and the potential biases through the use of a synthetic adjustment might be included in making such a choice.
Finally, there is the decision on the degree of an adjustment. The three components making up the degree of an adjustment are the timing, the geography, and the characteristics detail. The first issue is whether evaluation data will be ready for adjustment in time for reapportionment, redistricting, or later. The second issue relates to which level the adjustment will be carried down to, e.g., states, major cities, counties, census tracts, enumeration districts, or city blocks. Finally, the third issue relates to whether any of the content data will be adjusted, or merely the counts.
Wolter introduces the concept of what is labeled a “complete census adjustment” or an adjustment that is in time for reapportionment carried down to the individual household level, and carried out for all characteristics collected on the census questionnaire. Wolter states that a complete census adjustment is the Census Bureau’s preferred outcome. He also notes that the Census Bureau would plan to make the unadjusted data available for interested researchers. The panel earlier in this chapter expressed its preference for carrying down an adjustment to the microdata level in order to promote consistency. With regard to timing, the panel indicated that it does not want to ignore the benefits of an adjustment if one can be developed effectively except for the fact that it may not be ready by December 31, 1990. The panel comments further on Wolter’s paper in Chapter 8.
PRIORITIES FOR RESEARCH AND TESTING ON ADJUSTMENT
The panel recognizes that there are many issues and aspects of adjustment that need and would benefit from additional research. The panel believes that an intensive research program is called for in the area of adjustment and believes that researchers both within the Census Bureau and in the academic community can make significant contributions to furthering the development of feasible and effective adjustment methods. It is in the Census Bureau’s interest to encourage related studies by academic researchers as well as to pursue a vigorous research program of its own in the area of adjustment. As mentioned earlier in the report, one of the major constraints on the Census Bureau’s abilities to carry out research is the resulting increased demand on its technical staff. The opportunity to augment the staff through the use of academics and other researchers should therefore be investigated, not only for issues in adjustment, but also to perform research on many of the other research issues suggested throughout this report.
Recommendation 7.7. The panel recognizes that considerable work is still necessary and likely to lead to improved procedures for adjusting census data. We therefore support the Census Bureau’s stated plans to pursue, internally, research and development of adjustment procedures, and we also recommend that the Census Bureau vigorously promote and support related statistical research in the academic community.
The panel concurs in the need for the Census Bureau to carry out an adjustment, as an exercise, in its pretest plans for 1986, including the preparation of adjusted tabulations. Only in this way will the Census Bureau learn how to develop an operational capability to adjust. The identification of any unknown logistical problems with adjustment needs to be made as soon as possible. Thus, the panel is strongly in support of the plan to carry out a pretest of adjustment-related operations in 1986, even though one cannot completely determine the effectiveness of an adjustment in 1990 through any pretesting or research done in 1986.
Recommendation 7.8. The panel supports the Census Bureau in its plans for a 1986 pretest of adjustment operations, including the production of mock tabulations of adjusted census data. We recommend analysis of the resulting adjusted and unadjusted datasets, to help identify the strengths and weaknesses of the particular methods tried.
With respect to the theoretical investigation of an adjustment methodology, the panel has identified research it would like to see pursued that is
not specifically mentioned in either of the above papers. The appropriateness of an adjustment procedure can certainly be measured to some extent by investigating the agreement between estimates based on different models, the errors involved in the adjustment process, and nonresponse. Two examples of this were mentioned in our interim report (National Research Council, 1984:39-40):
We suggest starting with the national age-race-sex undercount estimates derived from demographic analysis for 1980 and deriving from them, through synthetic and related means, state-level estimates. . . . Comparison of the synthetic estimates with the “direct” PEP-derived undercount estimates for states should then be made to see whether the results shed light on the feasibility of using synthetic estimates based on national demographic estimates of the undercount to produce state and substate undercount estimates.
The United States should be divided into two (or three) blockings of about 20-60 relatively homogeneous and not necessarily contiguous domains. . . . Then, using the first blocking, a regression model should be estimated, using from three to six covariates, which fits the PEP undercount estimates derived for the domains. The same should also be carried out, for the second blocking (and perhaps the third), attempting to use a different set of covariates. Estimates for substate regions would make use of synthetic techniques based on the regression estimates for the homogeneous domains. Then the undercount estimates for the two (or three) models should be compared in a variety of ways. It would be interesting to see whether the substate regression estimates summed to the state-level PEP estimates. The effect of these estimates on redistricting or reapportionment could also be examined.
Since publication of our interim report, the Census Bureau undercount research staff has been actively pursuing research along these lines.
There are other aspects of adjustment methods that can also be researched. One important component of any statistical estimation process is the assumptions that underlie it. Thus, the degree to which the assumptions hold for all the competing procedures should be investigated. This work has already begun through the efforts of Freedman and Navidi (1986). The robustness of the various procedures to assumptions should be examined as well.
The methods proposed for carrying down the adjustment to lower levels of geographic aggregation should also be investigated. In some respects this is even more important than similar investigations for higher levels of geographic aggregation, since the methods used to carry the information down are necessarily rough, being less specific to the population of
the area being estimated. These methods are used as much for convenience as for validity. The validity of the models underlying the methods used to carry information down should also be investigated on the basis of considerations of variance, nonresponse, and plausibility of and sensitivity to the underlying assumptions.
Finally, the panel believes that the impact of adjusted data on a variety of users should be examined. This area is mentioned in the Wolter (1984) paper, but the panel believes that it should be explicitly given priority. An investigation would include the problems posed by the possible existence of two sets of books, the difficulties brought about by the need to allocate additional counts to households and families, and the effect on estimation for families, should these additional counts not have imputed family relationships.
Recommendation 7.9. We recommend that research on adjustment include: (1) investigations of the assumptions underlying the procedures, (2) an attempt to empirically evaluate the more important of the assumptions as well as the sensitivity of methods to violation of assumptions, (3) study of methods used for carrying down estimates to lower levels of aggregation, and (4) a study of the impact of adjustment on uses of census data.
APPENDIX 7.1
A QUICK LOOK AT LOSS FUNCTIONS AND APPORTIONMENT4
The method currently used to apportion the House of Representatives derives from Hill (1911). Let ai be the number of seats allocated to state i, and pi be the known population of state i. Suppose h seats are to be allocated. The algorithm used proceeds as follows:
- Set ai = l for i = 1, . . . , 50
- Suppose h′ seats have been allocated, that is,
![]()
Choose a state j for which ![]() is a maximum. Increase ai by 1, and h′ by 1.
is a maximum. Increase ai by 1, and h′ by 1.
- If h′ < h, then return to step (2).
Otherwise stop.
It has been shown (Huntington, 1921) that this method is equivalent to the minimization of
![]()
given that each ai is at least 1. To see this, roughly, consider that the choice at some stage of the process has been to give the last representative to state A by minimizing criterion (7.1). We now show that this choice also satisfies the Hill algorithm. Assume that state A has parameters pA and aA and state B has parameters pB and aB, respectively, for their population and number of representatives. Since (7.1) has been minimized, we must have that:
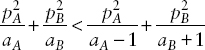
for any choice of B, or, equivalently,
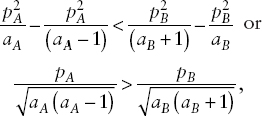
and therefore the choice of A to minimize criterion (7.1) also maximized the Hill criterion.
__________________
4Much of the discussion is taken from Balinski and Young (1982) and Kadane (1984).
The function L, the Huntington criterion, does not have the form of a loss function in a strict sense. But it is equivalent to an index of misproportionality, as defined above in Chapter 7. For purposes of reapportionment, the loss due to any state could well be a function of how relatively under- or overrepresented the people of that state are, probably a function of [(pi /ai) – (p+/h)]2, where p+ is the total population of the United States.
Amalgamating these losses by forming the weighted sum
![]()
is reasonable. This can be seen by the following argument. If state A has k times the number of representatives as state B, and if states A and B are equally underrepresented by some apportionment of the House of Representatives, then the number of seats needing change for state A will be k times the number of seats for state B. Rewriting the sum
![]()
as the sum of three terms by taking the square of the indicated expression, it is easy to see that this loss function can be rewritten as
![]()
Since the second term is a constant, minimizing this index of misproportionality is equivalent to minimizing the Huntington criterion.
APPENDIX 7.2
AN INTRODUCTION TO HIERARCHICAL BAYESIAN TECHNIQUES
An important problem in statistics is how to effectively weight information obtained about certain quantities from more than one source, with each source’s means and variances estimable but unknown. This problem arises in the decennial census in more than one context. For example, how to combine information from the raw data collected in the decennial census and information from the coverage evaluation programs is the fundamental statistical problem faced in the determination of a method for adjustment. In addition, the combination of postcensal estimates based on sampled long-form responses for small areas with information from more highly aggregated areas that enclose the smaller areas, investigated by Fay and Herriot (1979), is again a problem of combining information from more than one source.
Hierarchical Bayesian methods (Lindley and Smith, 1972) provide a technique for weighting information from different sources. There is a strong similarity between the empirical Bayesian model and the components of variance model (see, e.g., Kackar and Harville, 1984; Henderson, 1975). In this section we describe the basic approach used.
As an example, assume that we have a process that generates n values mi, so that each mi is normally attributed with mean m and variance t2 (denoted mi ~ N(m, t2)). Then, assume that the n random variables xi are independently distributed according to N(mi, s2), with m, s2, and t2 known. Unconditionally, xi ~ N(m, t2 + s2). The problem is to estimate the value mi after observing xi. Bayesian methods direct one to determine the posterior distribution of mi given xi, which can be calculated given the prior distribution for mi, and the distribution of xi given mi. The Bayesian estimate of mi, under squared error loss, is then the mean of this distribution, (t2xi + s2m)/(t2 + s2). It is a weighted combination of xi and m, with weights t2/(t2 + s2) and s2/(t2 + s2). Thus, the two sources of information for the value of mi are weighted in an appropriate fashion to arrive at a reasonable estimate. However, the estimator requires m, s2, and t2 to be known.
One form of empirical Bayesian methodology (see Efron and Morris, 1973; Harville, 1976) generalizes this basic approach by treating m, s2, and t2 as unknown parameters to be estimated from the data, rather than known a priori.
The term hierarchical derives from the realization that the modeling need not stop at a distribution for the mean and the estimation of the parameters for this distribution. It is, for example, possible, instead of estimating m and t2 from the data, to place a prior on them. Furthermore, if the data have a hierarchical structure such that independent realizations of m and t2 are available, they can be used to estimate the parameters of that
distribution. Moreover, more complicated linear structures than components of variance, such as multiple regression with “random” coefficients, can be handled. This can go on indefinitely, as long as estimates for the various parameters can be achieved in some way. This nesting of models allows incomplete knowledge about quantities that affect the quantity to be estimated to be incorporated into the estimation process.
In the case of adjustment, one possible hierarchical model might be developed based on the following reasoning. For major central cities and states and remainders of states with these cities in them, or for homogeneous regions, it is reasonable to consider modeling the ratio of the census counts to the true counts, that is, percentages of undercount. One could assume that the ratios of Post-Enumeration Program counts to the census counts, denoted pi , or some appropriate transformation of the pi , were distributed approximately as N(mi, vi). The next step might be to hypothesize a model for the means mi. One possibility for this model could be a regression model such as that suggested in Fay and Herriot (1979). Then, mi ~ N(XiB,A), where A is unknown. The regression model for percentage undercount could include as explanatory variables such variables as mail return rate, percentage undercount in the previous census, percentage minority, crime rate, percentage conventional enumeration, socioeconomic status, and so on (see Ericksen, 1984). Here, XiB is assuming the role of the mean of the “true” undercount. The variance of the parent distribution, vi, can be derived from the Post-Enumeration Program specifications, such as the sampling rate. However, this alone is not sufficient, since there are other components to the variance of the Post-Enumeration Program besides sampling variance, for example, variance due to nonresponse. As a third stage, one could estimate B using classical least squares, or hypothesize a model for it as well. The only remaining difficulty is that of estimating A.
If we had hypothesized the vi to be constant, over i, it would be relatively easy to estimate the common value by computing the sum of squared deviations of pi about XiB, and making some adjustments. This is what is suggested in the work by James and Stein (1961), and later in the work by Efron and Morris (1973). However, the variance heterogeneity forces one into a more sophisticated methodology. One relatively easy but unsatisfying way around this difficulty is to assume that A, the variance of the prior distribution, is not constant over i, but instead, is equal to Avi. Carter and Rolph (1974) propose a method of moments estimator for the case with constant variance, A, for the prior distribution, which is a more satisfying assumption.
APPENDIX 7.3
AGGREGATION OF SYNTHETIC ESTIMATES: A COUNTERINTUITIVE EXAMPLE
While synthetic estimation is suggested for adjustment because of its arithmetic and computational simplicity, synthetic estimation is not necessarily an improvement over the census counts. Let us assume the situation depicted in Table 7.2.
An examination of the table shows that the estimates of area totals using synthetic estimation are further from the truth than the unadjusted census estimates for areas I and III, and no better for area II. That is, the synthetic values 108 and 92 are not equal to the true counts of 100, which is the case for the unadjusted census counts. This is indicative of the fact that the near-optimality of synthetic estimation, discussed by Tukey (1983) for subgroups, is not necessarily preserved when synthetic subgroup estimates are accumulated to synthetic geographic area estimates.
TABLE 7.2 An Example: Problems in Aggregating Synthetic Estimates
| Area | Subgroup 1 | Subgroup 2 | Total | ||||||
| Census | Synthetic | True | Census | Synthetic | True | Census | Synthetic | True | |
| I | 10 | 9 | 5 | 90 | 99 | 95 | 100 | 108 | 100 |
| II | 50 | 45 | 45 | 50 | 55 | 55 | 100 | 100 | 100 |
| III | 90 | 81 | 85 | 10 | 11 | 15 | 100 | 92 | 100 |
| Total | 150 | 135 | 135 | 150 | 165 | 165 | 300 | 300 | 300 |
This page intentionally left blank.


