
Radar studies of the planets and smaller bodies in the solar system are driven by the desire to understand how our solar system formed and evolved and, in the case of near-Earth asteroids (NEAs), by the concern that some of these small objects may pose a threat to Earth. This chapter will give a brief historical introduction to planetary radar astronomy, a description of the technical needs of the field, and a brief survey of current U.S. planetary radar systems, including their use of the spectrum. This is followed by a discussion of the techniques used to obtain and analyze the data. The section “Science Applications” discusses the research programs with some emphasis on studies of near-Earth asteroids due to Earth-based radar’s unique capability to obtain detailed information about the orbits and characteristics of these objects. Finally, the sections “Future Science Drivers and Technical Requirements” and “Frequency Assignment Requirements” look to the future, discuss plans for new radar systems, and speculate on possible requirements for additional spectrum assignments.
The rapid development of radar during World War II opened the possibility of utilizing this new technology to learn more about our solar system by detecting radar echoes from large and small solar system bodies. With today’s ability to image our sister planets from orbiting spacecraft, it is hard to realize how little was known about our solar system until the early 1960s with the advent of the first space missions and the development of more capable ground-based instruments, including radar. The overall scale of the solar system, as represented by the astronomical unit
(AU), the mean distance between Earth and the Sun, was still imperfectly known; Venus was postulated to have rain forests below its clouds; science fiction had not given up on the idea that Mars had canals; and there was continuing discussion as to whether lunar craters were of impact or volcanic origin.
In 1946, radar systems in Hungary and the United States first detected echoes from the Moon. However, detecting echoes from our nearest planet, Venus, required an improvement in radar sensitivity by a factor of over a million. This was achieved in the late 1950s, resulting in detections of the planet at its close approach to Earth in 1961 by five different radar systems in the United States, Great Britain, and the Soviet Union. By the mid-1960s, three new, much more powerful radar systems were available for this new field of planetary radar astronomy. These were the 305 m Arecibo telescope of the National Science Foundation (NSF) in Puerto Rico, the 37 m Haystack antenna in Massachusetts, and the 64 m Deep Space antenna of NASA in Goldstone, California. Progressive upgrades of the NASA Goldstone and NSF Arecibo systems, primarily by moving to higher frequencies and more powerful transmitters, have made these two radar systems the dominant instruments for current radar studies of the solar system (Figure 6.1). Until recent events shuttered its scientific work, the Russian 70 m Evpatoria telescope in the Crimea was the only other currently operating planetary radar system. The telescope’s limited sensitivity restricted it to rare observations of NEAs. However, there are discussions underway that may lead to one or two more transmitting systems in the United States and further upgrades to the Arecibo and Goldstone systems aimed, primarily, at orbit determination and characterization of NEAs.
CURRENT RADAR ASTRONOMY SYSTEMS
The sensitivity of a planetary radar system is proportional to the average transmitter power and the effective area of the transmitting and receiving antennas, which are the same for a monostatic system but may be different for a bistatic system (Figure 6.2), and inversely proportional to λ3/2, where λ is the operating wavelength, and to the system temperature, which characterizes the noise contributions from the receiver, Earth’s atmosphere, our galaxy, and the cosmic microwave background. For a particular target body, the ability to detect an echo is dependent on R–4, where R is its distance from the radar, plus the size, surface electrical and physical properties, and rotation state of the body. The very large distances of solar system bodies from Earth dictate the need for very high transmitter powers and large transmitting/receiving collecting areas and very low system temperatures. Table 6.1 lists the characteristics of the currently operating planetary radars and the antennas that are occasionally used during bistatic observations.
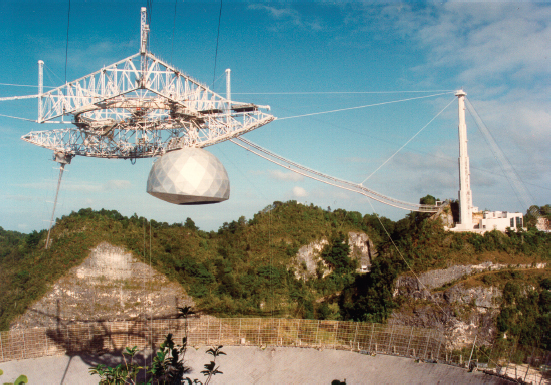
FIGURE 6.1 (Left) the 305 m NSF Arecibo antenna. The 2.38 GHz transmitter is housed in the dome, while the 430 MHz transmitter is in the operations building with the power being delivered to the line feed to the left of the dome via a waveguide coming up the catwalk from the base of the tower in the image. (Right) The 70 m NASA Goldstone DSN-14 antenna. SOURCE: (Left) Courtesy of NAIC/Arecibo Observatory, a facility of the NSF. (Right) Courtesy of NASA/JPL.
The great advantage of radar versus passive observations is the ability to control the properties of the transmitted waveform and measure the changes in these properties in the received echo. These properties are the following:
- The time origin of the transmitted waveform,
- Frequency or wavelength,
- The effective isotropic radiated power (EIRP), and
- Polarization state.
The time origin allows precision measurement of the distance to the target body, while the frequency of the echo relative to the transmitted frequency, the
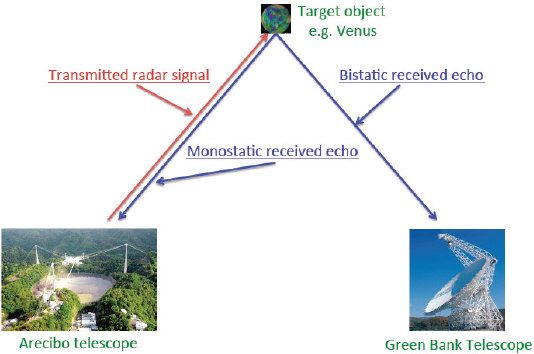
FIGURE 6.2 Monostatic and bistatic configurations for radar observations of Venus and near-Earth asteroids. SOURCE: Lower left: Courtesy of Donald B. Campbell, Cornell University; lower right: National Radio Astronomy Observatory; image of Venus: Courtesy of NASA/JPL/USGS (PIA00157: Hemispheric View of Venus Centered at 0 Degrees East Longitude).
Doppler shift, allows the radial velocity of the target body to be determined. It was these radar astrometric measurements to Venus that refined the value of the AU, and they are now primarily used to obtain precise orbits for potentially hazardous NEAs. The width and shape of the rotationally Doppler broadened echo provides information about the rotation state and surface roughness of the body (Figure 6.3). Given the distance to the target body and its size, the strength of the echo, combined with the shape of the Doppler-broadened echo, gives insight into the electrical properties of the surface material. Measuring the echo power as a function of time delay and Doppler shift relative to the sub-Earth location on the target body provides an image of echo power versus these two coordinates, which can be converted into a more normal latitude-longitude image if the size, shape, and spin vector of the body are known. However, as is clear from Figure 6.3, two locations symmetrically placed north and south of the equator have the same time delay and Doppler shift relative to the radar and the sum of the echo powers from these locations is imaged, leading to what is known as the N-S ambiguity problem (Figure 6.4). Irregular bodies such as near-Earth objects can have two or more
TABLE 6.1 Current U.S. Planetary Radar Systems
| Transmitting Location | Frequency (GHz) | Bandwidth (MHz) | Power (MW) | Receive Location |
| Arecibo, Puerto Rico | 2.380 | 20 | 1.0 (CW) | Arecibo, Puerto Rico GBT, Green Bank, West Virginia VLA, Socorro, New Mexico LRO, Lunar orbit |
| 0.430 | 0.6 | 2.5 (pulsed) | Arecibo, Puerto Rico GBT, Green Bank, West Virginia | |
| Goldstone, California DSS-14 | 8.560 | 50 | 0.5 (CW) | Goldstone, California GBT, Green Bank, West Virginia Arecibo, Puerto Rico VLA, Socorro, New Mexico 10 VLBA sites |
| Goldstone, California DSS-13 | 7.190 | 80 | 0.08 (CW) | Goldstone, California GBT, Green Bank, West Virginia Arecibo, Puerto Rico |
NOTE: Close asteroid observations require bistatic operation. Goldstone DSS-14 has NTIA assignment of 8.50 to 8.70 GHz. Goldstone DSS-13 has NTIA assignment of 7.150 to 7.230 GHz. Acronyms are defined in Appendix D.
locations with the same delay and Doppler shifts, and multiple observations at different aspect angles are needed to obtain a true shape.
Normally, the transmitted signal is circularly polarized, and both senses of circular polarization are received, allowing the polarization Stokes parameters of the received echo to be computed. For a surface normal to the incident wave and smooth at the radar wavelength, the echo power will be in the opposite sense of circular polarization to that received—the “expected” sense. Echo power at non-normal incidence angles arises from scatter from surface and/or subsurface wavelength-scale “roughness” within the penetration depth, typically about 10 wavelengths for the very dry surfaces of all solar system bodies apart from Earth, dependent on the loss tangent of the surface material. These scattering processes also couple power into the same (unexpected) sense of circular polarization, and the ratio of this power to that in the expected sense is used as a measure of relative surface/subsurface roughness. At moderate to high incident angles, the transmission coefficients into the surface for linear polarizations parallel and perpendicular to the plane of incidence diverge, so that the presence of a linearly polarized component in the radar echo is indicative of subsurface scatter and can be used to estimate the dielectric constant of the surface material.

FIGURE 6.3 Radar imaging geometry for a spherical target. Lines of constant delay are concentric with sub-Earth point (the location on the sphere closest to Earth), and the lines of constant Doppler shift intersect these concentric delay circles at two locations. Measuring the radar echo power as a function of time delay and Doppler shift relative to the sub-Earth location provides an image in time delay and Doppler shift coordinates. When, as is usual, the angular resolution of the radar telescope is larger than the angular diameter of the target object, two locations, A and B in the diagram, have the same delay and Doppler shift, and what is measured is the sum of the echo powers from these two locations (Figure 6.4). SOURCE: A. Vardy (ed.), Codes, Curves, and Signals: Common Threads in Communications, Springer, New York, 1998, doi:10.1007/978-1-4615-5121-8, with permission of Springer Science+Business Media.
During the 1960s, radar astronomy made major contributions to our knowledge of the solar system and to basic physics. These included a significant improvement in our knowledge of the AU, enabling accurate navigation of early spacecraft planetary missions; the discovery of the slow retrograde rotation of Venus and the very surprising 59.6-day rotation period of Mercury; the first low-resolution images of the surface of Venus below its cloud cover; the first radar detection of an asteroid,
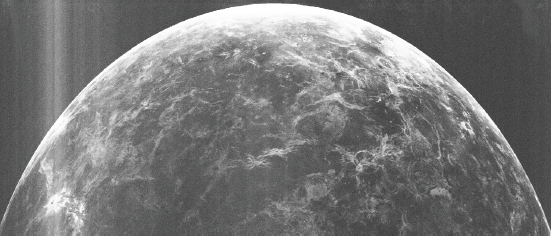
FIGURE 6.4 An image of Venus at about 1 km resolution in delay and Doppler coordinates made by transmitting at 12.6 cm wavelength with the Arecibo telescope in Puerto Rico and receiving the echo with the Green Bank Telescope in West Virginia. Because of the hemispheric ambiguity, it is not possible to tell in which hemisphere the various features are located. Increasing delay is from the top down and Doppler shift left to right, with the west limb of the planet to the left. The large volcano, Theia Mons, is at lower left. SOURCE: Courtesy of Bruce A. Campbell, Smithsonian Institution.
the NEA Icarus; imaging of the Moon and other investigations of the lunar surface in support of the Apollo missions; and tests of general relativity (GR) via time delay measurements to Venus as it passes behind the Sun (the fourth, or Shapiro, test of GR) and to Mercury to measure the rate of advance of its orbit’s perihelion.
In the first half of the 1970s, the sensitivity of the Arecibo radar system was significantly increased by replacing the wire mesh surface of the telescope’s reflector with 38,788 aluminum panels, allowing operation up to 5 GHz, and installing a 450 kW transmitter operating at 2.38 GHz (12.6 cm wavelength). At the same time, a 400 kW transmitter operating at 8.56 GHz (3.5 cm wavelength) was installed on the 64 m Goldstone antenna, greatly increasing its sensitivity. A major driver for the upgrading of Arecibo’s radar system was the imaging of the surface of Venus at high resolution. Initial maps of the planet’s surface had resolutions of about 15 km covering 40 percent of the planet’s surface, allowing the first large-scale look at the surface of our nearest planetary neighbor and the first indication that its surface is very young compared to those of Mars, Mercury, and the Moon, about 700 million years. The Galilean satellites of Jupiter were detected in the 1970s, resulting in the discovery of the unusual radio wavelength scattering properties of the low-temperature water ice surfaces of Europa, Ganymede, and Callisto. These surfaces are radar retroreflectors due to internal scattering in the ice, which has very low loss at radio wavelengths. The sense of received circular polarization is also
inverted, with the unexpected sense dominant over the expected sense. It was these properties that led to the discovery in the early 1990s of ice deposits at the poles of Mercury and a continuing “discussion” as to whether similar multiwavelength-sized deposits exist in the permanently shadowed parts of impact craters at the poles of the Moon. This period also saw the first radar detection of the rings of Saturn, clearly demonstrating that the rings were composed of centimeter- and larger-sized particles and not small millimeter-sized ones.
Through the mid-1990s, about 50 NEAs, almost 40 main-belt asteroids, and several comets were studied by the Arecibo and the Goldstone radar systems. These studies were a harbinger for the current emphasis of the Earth-based planetary radar program on astrometric and characterization observations of NEAs.
Incremental improvements in the Goldstone planetary radar system were obtained by the expansion of the NASA Goldstone antenna from 64 m to 70 m in 1988 and a small increase in transmitter power due to improved X-band klystrons in the 1990s. In the mid-1990s, a major modification of the optics of the Arecibo 305 m antenna and installation of a 1.0 MW transmitter at 2.38 GHz increased its sensitivity as a planetary radar system by a factor of 10 to 20, depending on the target. This left the Arecibo radar system with about 20 times the sensitivity of the Goldstone system. However, the Arecibo telescope has limited steerability, so it can only observe about 33 percent of the sky (declinations from 2 degrees S to 38 degrees N). The Goldstone antenna is fully steerable and can observe declinations of ~40 degrees S to the North Pole. This makes the two radar systems very complementary, especially for observations of NEAs.
Current Science Programs
Current science activities revolve around three observational modes: (1) astrometry based on precision distance and radial velocity measurements, (2) imaging based on measuring echo power as a function of position on the surface of a solar system body, and (3) speckle interferometry (see Box 6.1). Much of the emphasis of planetary radar observations is now directed to the characterization of NEAs and the determination of their orbits. However, radar’s sensitivity to centimeter-scale and larger surface roughness, its ability to penetrate dry surfaces, and its unique ability to detect water ice has kept it relevant to investigations of the Moon and terrestrial planets as well. Furthermore, its ability to make precision measurements of rotation vectors via speckle interferometry is providing information about the interior structure of planets and satellites and potentially giving insight into phenomena such as the transfer of angular momentum between the atmosphere and the solid body of Venus.
The interest in NEAs is driven by scientific curiosity, by what NEAs can tell us about the formation and evolution of our solar system, by concern about the poten-
BOX 6.1
Radar Speckle Interferometry
The ability of radar to measure range and range rate (Doppler shift), and to image solid surfaces in two and three dimensions is well known. However, a recently introduced technique called radar speckle interferometry (RSI) is less well known. RSI can be used to make very precise measurements of the rotation vectors of Mercury, Venus and, perhaps, the icy Galilean satellites of Jupiter and estimates of the spin state direction of near-Earth asteroids. The reflected radar echo from a rough surface can be thought of as the incoherent sum of the echoes from a large number of point reflectors (e.g., wavelength-scale rocks on the surface). Since the point scatterers (rocks) do not move on the surface, the resulting speckle (diffraction) pattern, corresponding to the radar echo power as a function of direction, rotates with the planet, and part of it sweeps over Earth at a rate primarily determined by the rotation period of the planet and its distance. In angle, the speckle pattern changes very rapidly, on the scale of approximately λ/D, where λ is the wavelength of the radar signal and D is the diameter of the area that contributes to the radar echo. In the case of, say, Mercury, D is about 2,000 km and, assuming a wavelength of 3.5 cm, the scale over which the speckle pattern changes is ~3.5 milliarcsec. At Mercury’s close approach to Earth of about 0.7 AU (~108 km), this corresponds to a distance on the surface of Earth of ~2 km.
The technique is implemented by transmitting from one antenna and receiving the echo with two widely spaced antennas, preferably several thousand kilometers apart. If the apparent rotation axis of the body being observed and projected on the sky is perpendicular to the vector joining the two receiving antennas, then the same speckle pattern determined, in the case of Mercury, by the ~2 km scale of change, sweeps over both antennas and the received signals are correlated at a time delay dictated by the rate at which the diffraction pattern sweeps over Earth. Because of the very small scale of the speckles, the time at which correlation occurs gives the orientation of the projected rotation axis to high accuracy and the time delay gives the rotation period with, in some instances, an accuracy of 1 part in 105. Multiple observations at different orbital orientations for Earth and the target body allow the full rotation vector to be determined.
tial threat posed by large and small NEA impacts with Earth, and by the potential of NEAs as resources for minerals for use on Earth or in space. NEAs are also being considered as possible stepping stones for human exploration of the solar system.
Over the past two decades, there has been an increasing awareness of the potential hazards posed by small asteroids in the inner solar system with orbits that may allow them to impact Earth. The impact histories on Earth, the Moon, and other bodies in the solar system, as evidenced by the large number of impact craters on their surfaces, make the threat very real. For Earth, the best-known impact is the one that likely caused the extinction of the dinosaurs about 65 million years ago. The roughly 10-km-sized asteroid that crashed into the Yucatan peninsula of Mexico at about the same time is generally believed to have been the cause.1 The
___________
1 P. Schulte, L. Alegret, I. Arenillas, J.A. Arz, P.J. Barton, P.R. Bown, T.J. Bralower, G.L. Christeson, P. Claeys, C.S. Cockell, G.S. Collins, et al., The Chicxulub asteroid impact and mass extinction at the Cretaceous-Paleogene boundary, Science 327(5970):1214-1218, 2010.
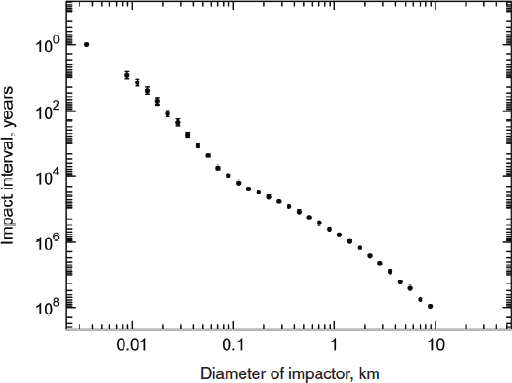
FIGURE 6.5 Current estimates of the average interval in years between collisions with Earth of near-Earth objects (NEOs) of various sizes from about 3 m to 9 km in diameter. (NEOs comprise comets as well as asteroids.) SOURCE: Alan W. Harris, Space Science Institute.
February 15, 2013, airburst of a ~20 m asteroid over Chelyabinsk, Russia, releasing energy equivalent to approximately 500 kilotons of trinitrotoluene (TNT) and injuring about 1,500 people, has highlighted the potential threat from very small NEAs, which are vastly more numerous than large ones.
Figure 6.5 shows the expected interval between impacts of NEAs on Earth as a function of their size. However, there have been recent suggestions based on analysis of the Chelyabinsk event and the number of small impact events in the interval 1984-2013 that the number of NEAs between 10 and 50 m in size may be considerably greater than previously thought, increasing the risk from the airbursts of these objects.2
In the 1990s, as awareness increased of the potential hazard from NEAs,
___________
2 P.G. Brown, J.D. Assink, L. Astiz, R. Blaauw, M.B. Boslough, J. Borovička, N. Brachet, D. Brown, M. Campbell-Brown, L. Ceranna, W. Cooke, et al., A 500-kiloton airburst over Chelyabinsk and an enhanced hazard from small impactors, Nature 503:248-251, 2013.
Congress placed a mandate on NASA to find 90 percent of NEAs with diameters greater than 1 km by 2008. Known as the Spaceguard survey, the NASA project largely achieved this goal by 2009. However, in 2005 Congress established a second mandate for NASA via the George E. Brown, Jr. Near-Earth Survey section of the 2005 NASA authorization bill to find 90 percent of the potentially hazardous NEAs larger than 140 m by 2020.
The 2010 National Research Council report Defending Planet Earth: Near-Earth Object Surveys and Hazard Mitigation Strategies3 strongly supported the use of both the Arecibo and Goldstone radar systems for orbit determination and characterization of near-Earth objects (NEOs). The report describes search programs for NEAs, plus orbit determination, characterization and mitigation strategies for potentially hazardous NEOs, primarily NEAs.
Earth-based radars are not effective at finding NEAs; they are discovered either optically via reflected sunlight or at infrared wavelengths via their thermal emissions. However, once found, radar is by far the best means for characterizing their sizes, shapes, rotation states, surface properties, and whether they are in multiple-body systems. No other technique short of a spacecraft flyby or orbiter can achieve the 4 m to 15 m image resolution on NEAs offered by the Goldstone and Arecibo radars. Figure 6.6 shows a series of Arecibo radar images, in delay and Doppler coordinates, of the NEA 1999 JM8 at different orientations as viewed from Earth. A series of such images at different aspect angles can be used to construct a detailed shape model of the NEA.
Radar can provide physical characterization and precise orbit information for spacecraft mission planning and navigation. Figure 6.7 shows delay-Doppler images and the derived shape model for 101955 Bennu, the target of NASA’s OSIRIS-Rex orbiting and sample return mission scheduled for launch in 2016. Bennu was discovered in 1999 by the LINEAR NEA survey. Its orbit varies from 0.90 to 1.36 AU from the Sun crossing that of Earth and making it both the most accessible carbonaceous asteroid and one of the most potentially hazardous asteroids (PHAs) known. Analysis of precise radar astrometric measurements gives Bennu a cumulative probability of impact with Earth of order 10-3 through the 22nd century, with most of the risk associated with a potential encounter with Earth in 2182.4
Radar observations have shown that NEAs come in a multiplicity of sizes, shapes, and configurations—single body, contact binary, binary, and triple systems (Figure 6.8). Approximately 15 percent are in a binary configuration, and another
___________
3 National Research Council, Defending Planet Earth: Near-Earth Object Surveys and Hazard Mitigation Strategies, The National Academies Press, Washington, D.C., 2010.
4 S.R. Chesley, Michael C. Nolan, D. Farnocchia, A. Milani, J. Emery, D. Vokrouhlický, D.S. Lauretta, P.A. Taylor, L.A.M. Benner, J.D. Giorgini, M. Brozovic, et al., The trajectory dynamics of near-Earth asteroid (101955) 1999 RQ36, American Astronomical Society Division of Dynamical Astronomy Meeting 43, Mt. Hood, Ore., Paper 7.08, 2012.
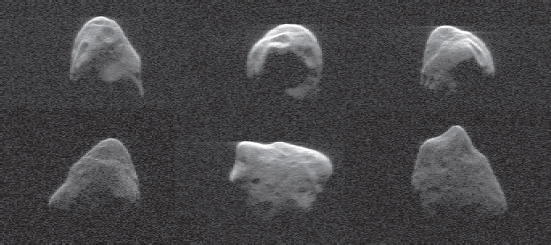
FIGURE 6.6 Arecibo delay-Doppler images of the ~3 km NEA 1999 JM8 taken at different aspect angles at a resolution of 15 m. Delay is measured from the top. SOURCE: Courtesy of Jean-Luc Margot, UCLA.
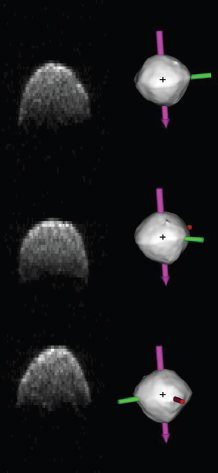
FIGURE 6.7 The Arecibo delay-Doppler images of the ~500 m diameter NEA 101955 Bennu, the target of NASA’s OSIRIS-Rex mission; right column, the shape model derived from the delay-Doppler images shown at the orientation of the observations. SOURCE: Courtesy of Michael C. Nolan, Arecibo Observatory.
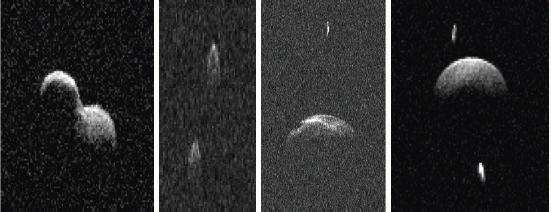
FIGURE 6.8 NEA multiple system types, delay-Doppler images. From the left, contact binary, binary with the two bodies of roughly equal size (rare), binary with a small companion, triple system with two small companions. SOURCE: Courtesy of Michael C. Nolan, Arecibo Observatory.
~16 percent are contact binaries. Only two triple systems have been discovered. Earth-based radars provide the orbit information needed to determine whether a NEA is potentially hazardous to Earth and characterization information, including whether the NEA is a multiple object system, needed to design a mitigation efffort.
For binary and triple systems, analysis of the orbits of the bodies about the center of mass of the system allows their masses to be derived. Their densities can then be determined from their volumes derived from the shape models. Density information provides insight into whether an NEA is a “rubble pile” body with high porosity or whether it is a solid body, usually a remnant of larger asteroid disrupted by a collision with another asteroid. This is critical information for designing a mitigation procedure for a potentially hazardous NEA.
Distance (time delay) and velocity (Doppler shift) measurements to NEAs can be made with a precision of about 10 m and a few mm sec-1, respectively. This precision has a long-term practical value as it allows accurate orbits of NEAs to be projected into the future (and past) for about 5 times longer than is possible based on just optical position measurements. This translates roughly from about 80 years to 400 years. High-precision radar astrometry, when combined with optical plane of sky measurements, can identify which NEAs are truly potentially hazardous to Earth. The biggest uncertainty in this determination is the Yarkovsky effect (see Box 6.2),5 and one of radar astronomy’s major achievements was the confirmation that
___________
5 J.D. Giorgini, S.J. Ostro, L.A.M. Benner, P.W. Chodas, S.R. Chesley, R.S. Hudson, M.C. Nolan, A.R. Klemola, E.M. Standish, R.F. Jurgens, R. Rose, et al., Asteroid 1950 DA’s encounter with Earth in 2880: Physical limits of collision probability prediction, Science 296:132-136, 2002.
BOX 6.2
The Yarkovsky and YORP effects
The Yarkovsky effect is the very small nonradial acceleration on a solar system body due to the absorption of solar radiation and its re-emission as heat. For the same reason that hot days on Earth are hottest in the early afternoon and not at midday, for an asteroid the re-emission is not back toward the Sun but rather centered on an angle that, depending on the spin state and surface properties of the asteroid, is typically about 30 degrees producing, owing to the momentum carried by the emitted infrared photons, a tiny force in the opposite direction (Figure 6.2.1). Over very long time spans, this force can significantly modify the orbit of a small solar system body and is the greatest source of uncertainty in the long-term prediction of the orbits of near-Earth asteroids (NEAs). The possibility of this effect has been known for a long time, but its effectiveness was only demonstrated in 2003 by precise distance and velocity radar measurements to a small NEA, Golevka, over a number of years. Golevka’s distance and velocity during the last measurement could only be accounted for if the Yarkovsky effect was real. Apart from its effect on NEA orbits, the confirmation of the Yarkovsky effect had profound implications for our understanding of how small bodies in the main asteroid belt between Mars and Jupiter are translated into the inner solar system.
The YORP (Yarkovsky, O’Keefe, Radzievskii, Paddack) effect is similar to the Yarkovsky effect except that it acts over very long time scales on surface irregularities to spin up or down a small body and, potentially, change its spin axis direction. It was confirmed by a combination of optical and radar observations in 2007. The YORP effect is thought to be responsible for producing binary NEAs by spinning them up until they become gravitationally unstable.
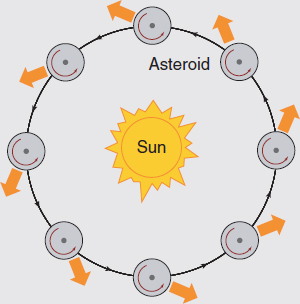
FIGURE 6.2.1 A diagram showing the direction of the force due to the Yarkovsky effect on a small body orbiting the Sun. The direction is dependent on the near-Earth asteroid’s rotation direction and period. SOURCE: D.P. Rubincam, Yarkovsky thermal drag on small asteroids and Mars-Earth delivery, Journal of Geophysical Research: Planets 103( E1):1725-1732, 1998.
the Yarkovsky effect can alter the orbits of small bodies in the solar system.6 This resolved a long-standing issue in solar system research, namely how the population of NEAs is replenished from the main asteroid belt between Mars and Jupiter since the average life of an NEA is only a few million years due to collisions with the Sun, planets, and smaller bodies. The Yarkovsky force on small bodies in the main asteroid belt is capable of moving them into resonance orbits with Jupiter, from which they can be transported into the inner solar system.7
Estimates of the Yarkovsky force based on estimates of the mass and thermal inertia of an NEA allows improved orbit predictions. Alternatively, measurements of the Yarkovsky drift rate for a NEA can be used to estimate its mass and rotation direction.8 Knowledge of its approximate size allows its density to be estimated, providing, in the case of a hazardous object, critical information for mitigation planning that is not biased by the requirement that the NEA be in a binary or triple system.
Radar observations from Earth continue to provide new information about the terrestrial planets and the Moon despite the many spacecraft flybys, orbiters, and landers. The unique radar back-scattering properties of water ice led to the discovery by ground-based radar of ice deposits in the permanently shadowed portions of impact craters at Mercury’s poles. High-resolution (1.5 km) radar imaging of these deposits has mapped out their distribution with high precision9 (Figure 6.9). Further study of the deposits was a high priority of NASA’s current Messenger mission to Mercury. Radar speckle interferometric measurements of Mercury’s spin vector revealed the presence of a liquid outer core, a major advance in our understanding of this planet (Figure 6.10).
Radar is the only effective means for detailed studies of the surface of Venus due to its optically opaque cloud cover. With no new radar missions planned for the foreseeable future, only Earth-based radars, primarily the one at Arecibo, are capable of monitoring the planet’s surface. Major objectives for continuing observations of Venus are the confirmation of current volcanic activity by direct observation of new surface lava flows; the investigation via the polarization properties of the reflected echo of potential landing sites, especially those on tesserae terrain,
___________
6 S. R. Chesley, S.J. Ostro, D. Vokrouhlický, D. apek, J.D. Giorgini, M.C. Nolan, J.-L. Margot, A.A. Hine, L.A.M. Benner, and A.B. Chamberlin, Direct detection of the Yarkovsky effect by radar ranging to Asteroid 6489 Golevka, Science 302:1739-1742, 2003.
7 W.F. Bottke, D. Vokrouhlicky, D.P. Rubincam, and D. Nesvorny, The Yarkovsky and YORP effects: Implications for asteroid dynamics, Annual Review of Earth and Planetary Sciences 34:157-191, 2006.
8 C.R. Nugent, J.L. Margot, S.R. Chesley, and D. Vokrouhlicky, Detection of semi-major axis drifts in 54 near-earth asteroids: New measurements of the Yarkovsky effect, The Astronomical Journal 144:60, 2012.
9 J.K. Harmon, M.A. Slade and M.S. Rice, Radar imagery of Mercury’s putative polar ice: 1999-2005 Arecibo Results, Icarus 211:37-50, 2011.
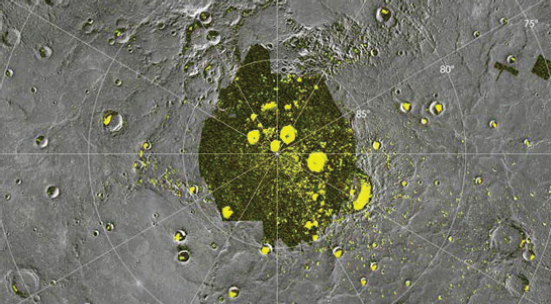
FIGURE 6.9 Arecibo radar image of the distribution of ice deposits at the north pole of Mercury (yellow), superimposed on a mosaic of Messenger orbiter images showing the coincidence of the ice deposits with the shadowed portions of impact craters. SOURCE: NASA/Johns Hopkins University Applied Physics Laboratory/Carnegie Institution of Washington.
believed to be the oldest extant surfaces on the planet; and radar speckle interferometric measurements of the planet’s spin vector to monitor changes thought to be due to the transfer of angular momentum between the atmosphere and the solid planet. New Arecibo/Green Bank Telescope (GBT) bistatic observations of Venus were made in 2012 (Figure 6.11) and compared with reprocessed Arecibo imagery from 1988 and Magellan images to look for possible surface changes due to volcanic activity, but, to date, no evidence of change has been detected. Arecibo to the Very Large Array (VLA) bistatic observations have the potential to provide high resolution radar imagery of Venus free of the North-South (N-S) range-Doppler ambiguity issues apparent in Figure 6.11.
Radar’s ability to penetrate into dry, low-electrical-loss surfaces enables the investigation of the near subsurface. This is especially useful for the Moon, where the regolith, the upper 5 m to 15 m of the surface that has been pulverized into fine material by meteoritic impacts, masks the underlying stratigraphy, and for Mars, where dust deposits over many areas also mask the underlying rocky surface. Figure 6.12 shows an Arecibo radar image of Mare Serenitatis on the Moon made at 70 cm wavelength, where the penetration depth is 5 to 10 m, compared with an optical image. Extensive subsurface structure is apparent in the radar image, sug-
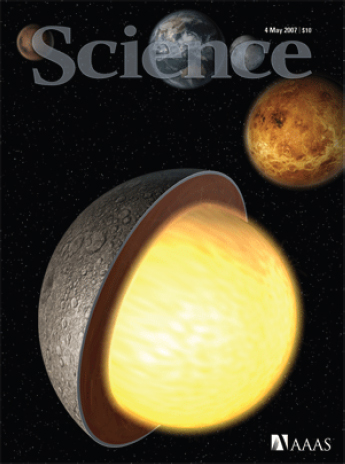
FIGURE 6.10 Cover page of Science magazine from May 4, 2007, highlighting the paper “Mercury librations measured by Earth-based radar” by J.L. Margot, S.J. Peale, R.F. Jurgens, M.A. Slade, and I.V. Holin (Volume 316, No. 5825, pp. 313-330), which showed that Mercury has a liquid outer core. Reprinted with permission from AAAS.
gesting volcanic flow fronts, channels, and the like. The demonstrated ability of Arecibo’s 70 cm wavelength radar to probe several meters below the surface of the Moon (Figure 6.12) will be used to study layered volcanic ash and lava deposits, potentially ice-bearing polar craters, and early mare-forming volcanic deposits now buried by basin debris. High-resolution (~20 m) 2.38 GHz imagery will be obtained to complement the similar resolution and frequency imagery from the mini-radio frequency (RF) radar that was on the Lunar Reconnaissance Orbiter.
Moon sensitivity is not an issue, but the range resolution of the radar images is limited by the bandwidth of the transmitter system, in this case about 200 m, due to the small bandwidth of the Arecibo 70 cm wavelength transmitter.
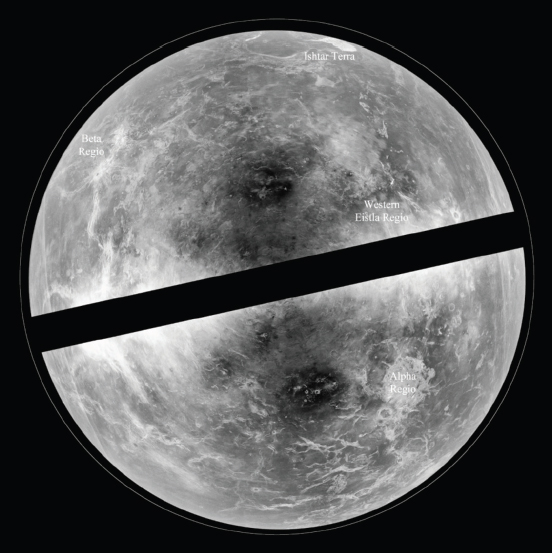
FIGURE 6.11 Arecibo/GBT radar image of Venus made from data acquired in 2012. The resolution is 1 to 2 km. Problems related to the N-S range-Doppler ambiguity causes ghost images in the opposite hemisphere, especially for radar bright features such as Alpha Region. The black bar is the location of the Doppler equator, which is perpendicular to the apparent rotation axis as viewed from the radar. It is not possible to image the surface close to this equator. The outer line is the edge of the planet’s projected disk. SOURCE: Courtesy of NASA/GSFC/Arizona State University.
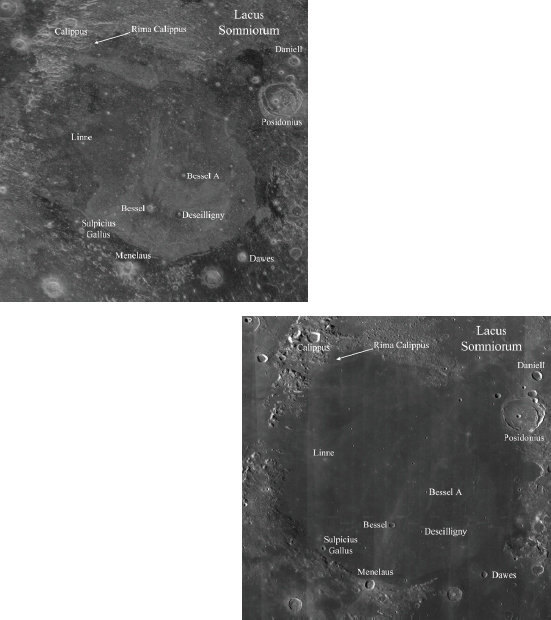
FIGURE 6.12 (Left) An Arecibo 70 cm wavelength image of Mare Serenitatis on the Moon showing echo power differences thought to arise from the blocky transition zone between the upper lunar regolith and the solid bedrock. The backscatter differences highlight lava flow units, lobes, channels and what is thought to be a large graben that has been flooded by lava flows. (Right) A lunar reconnaissance orbiter wide-angle camera mosaic optical view of the same region. There is little evidence of the structures apparent in the radar image. SOURCE: NASA/GSFC/Arizona State University; see B.A. Campbell, B. Ray Hawke, G.A. Morgan, L.M. Carter, D.B. Campbell, and M. Nolan, Improved discrimination of volcanic complexes, tectonic features, and regolith properties in Mare Serenitatis from Earth-based radar mapping, Journal of Geophysical Research-Planets 119:313-330, 2014, doi:10.1002/2013JE004486.
FUTURE SCIENCE DRIVERS AND TECHNICAL REQUIREMENTS
Near-Earth Asteroids
For at least the next decade, the emphasis of the Earth-based planetary radar program will be on astrometric and characterization observations of NEAs. None of the kilometer-sized and above known NEAs pose a risk to Earth over the foreseeable future.10 It is from the vast number of smaller bodies, as small as a few tens of meters, that the perceived near-term threat arises. It is this threat that is driving the desire for higher-resolution radar imaging and, due to the lower echo strength from each resolution cell as the resolution improves, higher sensitivity to improve the characterization capabilities.
The required modulation bandwidth of the transmitter to achieve a range resolution of ~8 m is 20 MHz. This is the current limit of the Arecibo 2.38 GHz radar system set by the maximum bandwidth of its klystrons of ~25 MHz. The maximum bandwidth of a klystron is normally a fraction, about 1 percent, of its operating frequency but can be increased at the cost (apart from dollars) of lower gain, lower efficiency, and greater weight. The two 250-kW 8.56-GHz klystrons currently in the transmitter on the Goldstone antenna have a bandwidth of 50 MHz, allowing a range resolution of ~4 m. New signal-processing instrumentation is allowing researchers to take advantage of this bandwidth with spectacular results (Figure 6.13), and a new klystron design has been developed that would have a bandwidth in excess of 100 MHz, allowing range resolutions of about 2 m. In the direction orthogonal to range, the azimuth or Doppler direction, the Doppler broadening of the radar echo from a rotating NEA is linearly dependent on the transmitter frequency. This means that achieving the spectral resolution corresponding to the size of the desired resolution cell is easier at higher frequencies.
For a given antenna, higher resolution in both range and Doppler plus increased sensitivity can be achieved most easily by moving the radar to a higher frequency, since sensitivity is proportional to λ–3/2 and the klystron bandwidth is about 1 percent of the transmitted frequency. For the 70 m Goldstone antenna, surface accuracy is a limitation to going to significantly higher frequencies. For Arecibo, doubling the frequency to 4.6 GHz, where there are existing high-power klystrons used by the particle accelerator community, is being considered. This would allow a bandwidth of about 50 MHz, giving a range resolution of ~4 m.
For the current Arecibo and Goldstone radar systems, two other means for increasing their sensitivities are to increase transmitter power and/or to use a
___________
10 It is estimated that there remain approximately 1,000 undiscovered kilometer-sized NEAs. As of February 17, 2015, there were approximately 866 km-sized (or above) NEAs known (per http://neo.jpl.nasa.gov/stats/). The population is believed to contain 1,090 ± 180 objects (per Stuart and Binzel 2004), or about 940 (per Harris 2008).
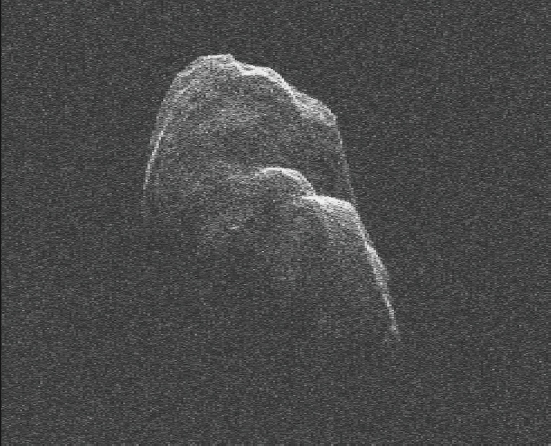
FIGURE 6.13 Goldstone radar image at 4 m resolution of the 4.8 km sized NEA Toutatis made on December 12, 2012 as it passed within 18 lunar distances from Earth. SOURCE: NASA/JPL-Caltech; see PIA16599: Tumbling Asteroid Toutatis, http://photojournal.jpl.nasa.gov/catalog/PIA16599.
larger antenna for reception. For Arecibo, neither of these options is possible as no other antenna has a larger collecting area, and it is already transmitting close to a megawatt. Any increase in power would require an unacceptable increase in weight on the suspended structure of the antenna. Doubling the power of the Goldstone transmitter to 1 MW is being considered, utilizing four of the newly designed wideband klystrons. Utilizing the 100 m GBT in West Virginia for echo reception would increase the sensitivity of the Goldstone radar by a factor of two to three, and utilizing Arecibo for reception for those objects that are within Arecibo sky coverage would increase sensitivity by a factor of about four.
The possibility of an 8.6 GHz radar system on the 100 m GBT is being discussed. Assuming a 500 kW transmitter similar to that on the Goldstone 70 m antenna, a GBT-based radar system would have about four times the sensitivity of
TABLE 6.2 Possible Upgrades to Current Radar Systems and Potential New Systems
| Transmitting Location | Frequency (GHz) | Bandwidth (MHz) | Power (MW) | Receive Location |
| Green Bank Telescope, West Virginia | 8.6 | 100 | 0.5 | GBT, West Virginia VLA, New Mexico Goldstone, California |
| Arecibo, Puerto Rico | 4.6 | 50 | 0.5 | Arecibo, Puerto Rico GBT, West Virginia |
| Goldstone DSS-14, California | 8.60 | 120 | 1.0 | Goldstone, California GBT, West Virginia Arecibo, Puerto Rico |
the Goldstone radar and would be more available since the 70 m Goldstone antenna is a prime component of NASA’s Deep Space Network (DSN).
For NEAs that pass very close to Earth, within a few lunar distances, nimbleness is more important than sensitivity because of the R–4 dependence on echo strength, where R is the distance to the NEA. These are typically small NEAs that are discovered only a short time before their close approach to Earth, so it is important to be able to react quickly. To foster this, NASA/Jet Propulsion Laboratory (JPL) has recently equipped one of its 34 m DSN antennas with an 80 kW transmitter operating at 7.210 GHz. Reception will be with another nearby 34 m DSN antenna, DSS-28.
Table 6.2 lists possible upgrades to the current planetary radar transmitting systems, and one potential new system, in the United States. None of these systems is currently funded, except for the new NASA Goldstone radar at 7.210 GHz.
Venus, the Moon, and the Galilean Satellites
Owing to the difficulty of seeing through its cloud cover, Venus remains the least-explored terrestrial planet. Yet, given how close it is to Earth in size, we clearly have much to learn from it related to Earth’s evolution. Since the atmosphere of Venus is relatively transparent for radio waves at frequencies below about 3 GHz, radar is the only method for obtaining large-scale imagery and topographic information for the planet. With no radar-equipped spacecraft mission currently planned, a program of Earth-based radar imaging at 1 to 2 km resolution searching for active volcanism (Figure 6.14) and studying potential landing sites for future lander missions will continue over the next decade. Observing small changes in the surface of Venus over time requires high-quality imaging. The quality of the current monostatic, Arecibo to Arecibo, and bistatic, Arecibo to the GBT, imaging is compromised by the N-S ambiguity problem (Figure 6.11). The recent upgrading
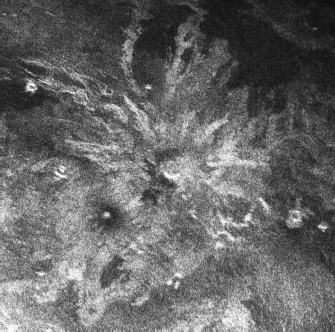
FIGURE 6.14 An Arecibo radar image of the volcano Sif Mons on Venus made in 1988. Future Arecibo radar images will be used to look for changes indicating very recent volcanic activity. SOURCE: Courtesy of Donald B. Campbell, Cornell University.
of NSF’s VLA in New Mexico has equipped it with receivers at the S-band, the frequency of the Arecibo radar system, allowing a return to the use of interferometry to resolve the N-S ambiguity and provide very-high-quality, 1- to 2-km imagery free of ambiguity defects. Some modification of the VLA’s data acquisition system will be needed before this technique can be implemented.
Radar speckle interferometric measurements of Europa and Ganymede, two of the icy Galilean satellites of Jupiter, are providing measurements of their obliquities, the angles between the rotation axis and the plane of their orbits about Jupiter. These measurements have the potential to reveal the presence of subsurface oceans and to generally help in constraining interior models of these satellites.11 The sensitivity of these measurements is about 3,000 times smaller than for the equivalent measurements on Mercury, so any increase in sensitivity of the Goldstone radar system or the installation of an equivalent system on the GBT would help resolve some of the most important issues regarding these satellites.
___________
11 J.-L. Margot, S. Padovan, D.B. Campbell, S. Peale, and F. Ghigo, Measurements of the spin states of Europa and Ganymede, American Astronomical Society Division for Planetary Sciences Meeting 45, Paper 504.02, 2013.
FREQUENCY ASSIGNMENT REQUIREMENTS
Over a wide range of wavelengths, the optimum frequency for almost all Earth-based planetary radar observations is driven by the need to maximize sensitivity and, to a lesser extent, the transmitting bandwidth. The exceptions are observations of Venus, where the atmosphere is highly absorptive at frequencies much above 3 GHz, and of the Moon, where long wavelengths allow penetration into the surface and sensitivity is not normally an issue. Since very large antennas are required, the optimum frequency is dictated by the maximum frequency at which the antenna can efficiently operate and the availability of klystrons capable of providing between 250 kW and 500 kW of output power.
Transmitting Stations
The only two transmitting locations currently in operation are NSF’s Arecibo Observatory in Puerto Rico and NASA’s Goldstone complex in California. For the two transmitters used for planetary radar astronomy at Arecibo, the National Telecommunications and Information Administration (NTIA) frequency assignments are the 20 MHz bandwidth centered on 2.380 GHz and the 0.5 MHz bandwidth centered on 0.430 GHz.
For the two transmitting stations used for planetary radar astronomy at NASA’s Goldstone site, there are NTIA assignments of 200 MHz centered on 8.60 GHz at the 70 m DSS-14 antenna, and an 80 MHz allocation centered on 7.210 GHz at the 34 m DSS-13 antenna.
A transmitting capability at NSF’s GBT in West Virginia could be based on the redesigned 8.60 GHz klystron if a NTIA frequency assignment of ~120 MHz bandwidth centered on 8.600 GHz is requested and approved, or it could utilize the currently available 8.56 GHz klystrons. Any upgrade of the Arecibo transmitter would likely want to utilize an existing klystron at 4.60 GHz, and the request would be for a 60 MHz assignment about this center frequency. Alternatively, if a suitable klystron can be developed, the bandwidth of the Arecibo 2.38 GHz system could be increased to 50 MHz, and a wider bandwidth frequency assignment would be needed.
Reception at these stations would be at the same frequencies, so radio frequency interference (RFI) is a significant concern. With the exception of the 430 MHz band at Arecibo, there have been no serious RFI issues to date at either the Goldstone or Arecibo locations. For the 430 MHz Arecibo system, interference is a major concern but primarily for the use of the system as an incoherent scatter radar for studies of Earth’s upper atmosphere. The lunar radar studies are conducted bistatically with reception with the GBT, where interference is not an issue owing to its siting in the Radio Quiet Zone straddling part of the border between West Virginia and Virginia.
Bistatic Reception
Radar astronomy makes use of several antennas for reception, apart from the transmitting stations. For Arecibo transmissions, these are NSF’s GBT and VLA in New Mexico. For Goldstone, they are NSF’s GBT, Arecibo, and the antennas of the Very Long Baseline Array (VLBA). Goldstone transmissions also use other 34 m antennas at NASA’s Goldstone complex for reception. Of these, the GBT is the most heavily used for reception, and its location in the Radio Quiet Zone keeps it largely free of terrestrial interference. The VLA and VLBA antennas are in relatively remote locations, and terrestrial interference in the bands being used for radar astronomy has not been a problem.
Finding 6.1: Active remote sensing through planetary radar astronomy continues to make important contributions to our understanding of the solar system, planning for space missions to extraterrestrial objects, and in particular for the tracking and characterization of NEAs that may pose a threat to society.
Finding 6.2: Radio frequency interference has not been a significant impediment to planetary radar astronomy observations to date. However, as bandwidth requirements increase due to the need to image NEAs at high spatial resolution, RFI could pose a significant problem in the future. To facilitate high-spatial-resolution imaging of small NEAs, frequency assignments with bandwidths of 60 MHz to 120 MHz are required. The NASA JPL Goldstone radar currently has an assignment of 200 MHz centered at 8.600 GHz.
Recommendation 6.1: If deemed worthwhile by the astronomy community, and if the National Science Foundation (NSF) considers it appropriate, NSF should seek frequency assignments in the relevant bands for the proposed Green Bank Telescope and upgraded Arecibo radar systems to facilitate high-spatial-resolution imaging of small near-Earth asteroids.


