
Active Earth Remote Sensing for Ocean Applications
A wide variety of operational (near-real-time) and research (non-real-time) active sensing systems are used for scientific, commercial, and government applications. These applications include fundamental meteorological and oceanographic research for understanding air/sea interactions that govern the exchange of fluxes of heat, mass, and momentum, which are physical processes required for oceanic and atmospheric modeling. Applications include global weather prediction, storm and hurricane warning, wave forecasting, coastal storm surge, ship routing, commercial fishing, coastal current and wave monitoring, and climate change. For these ocean applications, active and passive microwaves provide a different and unique response to oceanic geophysical parameters that cannot be obtained using infrared or visible sensors.
Table 3.1 lists the applicable oceanic geophysical parameters that can be measured with active microwave sensors, which can be grouped into airborne/spaceborne sensors and ground-based sensors. The first category includes three general classes of radar sensors: (1) synthetic-aperture radar (SAR) systems/side-looking airborne radar (SLAR) and interferometric SAR (InSAR), (2) scatterometers (Scat), and (3) altimeters (Alt). The ground-based category consists of HF band radars. All of these remote sensing systems are special-purpose radars that respond to physical scales of ocean roughness from tens of meters to centimeters. Since the dominant ocean electromagnetic (EM) scattering mechanism is Bragg scattering, this requires a wide operating frequency range from the HF band (3-50 MHz) to
TABLE 3.1 Oceanic Parameters Remotely Sensed by Active Microwave Sensors
| Oceanic Parameter | Sensor | |||
| Alt | Scat | SAR | HF Radar | |
| Significant wave height | X | |||
| Ocean wave spectrum | X | X | ||
| Surface wind speed | X | X | X | X |
| Surface wind direction | X | |||
| Ocean gravity | X | |||
| Ocean current magnitude | X | X | ||
| Ocean current direction | X | |||
| Mean sea level | X | |||
| Internal waves | X | |||
| Oil slicks | X | X | ||
| Sea ice extent | X | X | X | |
| Icebergs | X | X | ||
the Ku-band (14 GHz). Detailed frequency requirements for the various systems are defined herein.
This section describes the principle of operation for the various classes of active sensors (separated by radar type) and highlights the major applications for each. The discussion begins with a brief overview of the history of active microwave remote sensing for oceanic applications.
HISTORY OF ACTIVE REMOTE SENSING FOR OCEAN APPLICATIONS
Active microwave remote sensing began before World War II, in the 1930s and 1940s, when radar was exploited for military applications. During that period, the environmental signals were regarded as “noise” (e.g., sea-state clutter) that tended to mask the detection of desired surface targets like ships. Later this environmental noise became the signal for the remote sensing technologist who wanted to relate changes in environmental parameters to corresponding changes in the radar back-scattered echo.
Ground-Based High-Frequency Radar Sensors
While D.D. Crombie correctly identified the source of the sea echo observed by HF radars to be the result of coherent scattering by ocean surface waves,1 efforts to advance both the theory of the phenomenon and its application to providing useful information about the coastal ocean lagged this initial work by a few decades. Donald E. Barrick was the first to offer a supporting theoretical description for the measurements of surface currents by radar.2 Follow-up studies provided the derivation and interpretation of the nonlinear theory for detecting surface gravity waves (i.e., ocean waves).3 Such HF radar installations for observing the coastal ocean began to contribute to both scientific research and practical applications in the late 1970s and early 1980s.
Initially, all the deployed research systems utilized phased-array technology. However, the relatively large arrays required to achieve high angular resolution, particularly at the lower frequencies, and the resulting weight of such arrays made these systems challenging to permit, deploy and maintain. To address these difficulties, in the 1970s, the Wave Propagation Laboratory of the National Oceanic and Atmospheric Administration (NOAA) began development of the coastal ocean dynamics applications radar (CODAR) system, which utilized a compact design of colocated antennas. The CODAR system used a crossed-dipole antenna structure along with direction-finding methods to invert the received signals for the azimuthal bearing of surface currents from the dominant backscattered signal.
Airborne/Satellite Radar Sensors for Ocean Applications
During the 1960s and 1970s, the U.S. Naval Research Laboratory performed pioneering laboratory and field measurements,4 which were later followed by field measurements by NASA,5 to understand the electromagnetic (EM) scattering of
______________
1 D.D. Crombie, Doppler spectrum of sea echo at 13.56 Mc./s, Nature 175:681-682, 1955.
2 D.E. Barrick, First-order theory and analysis of MF/HF/VHF scatter from the sea, IEEE Transactions on Antennas and Propagation AP-20(1):2-10, 1972.
3 D.E. Barrick and B.L. Weber, On the nonlinear theory for gravity waves on the ocean’s surface. Part II: interpretation and applications, Journal of Physical Oceanography 7(1):11-21, 1977; B.J. Lipa, Inversion of second-order radar echoes from the sea, Journal of Geophysical Research 83(C2):959-962, 1978.
4 N.W. Guinard, and J.C. Daley, An experimental study of a sea clutter model, Proceedings of the IEEE 58:543-550, 1970; Guinard et al., Variation of the NRCS of the sea with increasing roughness, Journal of Geophysical Research 76:1525-1538, 1971; J.W. Wright, Backscattering from capillary waves with application to sea clutter, IEEE Transactions on Antennas and Propagation 14(6):749-754, 1966.
5 F.G. Bass et al., Very high frequency radiowave scattering by a disturbed sea surface, IEEE Transactions on Antennas and Propagation 16(5):554-568, 1968; W.L. Jones, L.C. Schroeder, and J.L. Mitchell,
ocean waves. It was soon recognized that there was a strong cause and effect relationship between ocean sea-state and surface winds, which prompted the development of a theoretical ocean wave spectral model6 that enabled the development of EM scattering theory for the ocean.7 As early as the mid-1960s, the pioneering work of Willard J. Pierson and Richard K. Moore8 suggested the use of space-based radars for measuring ocean waves and wind speed, but it took almost a decade of field experiments using many aircraft-based and surface-based measurements, as well as theoretical developments, before the concept was considered for spaceflight.
The first use by NASA of microwave sensors for ocean observations occurred, primarily as a technology demonstration, on the Skylab mission in 1973-1974.9 This paved the way for NASA’s first oceanographic satellite Seasat-A, which was launched into a polar orbit in 1978.10 Seasat-A was the first Earth-orbiting satellite to carry four complementary microwave experiments: the radar altimeter (ALT)11 to measure ocean surface topography; the Seasat-A satellite scatterometer (SASS)12 to measure ocean wind speed and direction; the passive scanning multichannel microwave radiometer (SMMR)13 to measure a variety of ocean surface and atmospheric parameters; and SAR14 to image the ocean surface, polar ice caps, and coastal regions.
Aircraft measurements of the microwave scattering signature of the ocean, IEEE Transactions on Antennas and Propagation 25(1):52-61, 1977.
6 W.J. Pierson and L. Moskowitz, A proposed spectral form for fully developed wind seas based on similarity theory of S.A. Kitaigorodskii, Journal of Geophysical Research 69:5191-5203, 1964.
7 A.K. Fung and K. Lee, A semiempirical sea-spectrum model for scattering coefficients estimation, IEEE Journal of Oceanic Engineering 7(4):166-176, 1982.
8 R.K. Moore and W.J. Pierson, Measuring sea state and estimating surface winds from a polar orbiting satellite, presented at the International Symposium on Electromagnetic Sensing of the Earth from Satellites, Miami Beach, Fla., 1965; R.K. Moore and F.T. Ulaby, The radar radiometer, Proceedings of the IEEE 57(4):587-590, 1969.
9 R.K. Moore et al., Simultaneous active and passive microwave response of the Earth—The Skylab radscat experiment, pp. 189-217 in Proceedings of the 9th International Symposium on Remote Sensing of Environment, University of Michigan, Ann Arbor, Mich., 1974.
10 D.E. Barrick and C.T. Swift, The Seasat microwave instruments in historical perspective, IEEE Journal of Oceanic Engineering 2(2):200-206, 1977.
11 W.F. Townsend, An initial assessment of the performance achieved by the Seasat-1 radar altimeter, IEEE Journal of Oceanic Engineering 5(2):80- 92, 1980.
12 W.L. Grantham, E.M. Bracalente, W.L. Jones, and J.W. Johnson, The Seasat-A satellite scatterometer, IEEE Journal of Oceanic Engineering 2(2):200-206, 1977.
13 E.G. Njoku, J.M. Stacey, and F.T. Barath, The Seasat Scanning Multichannel Microwave Radiometer (SMMR): Instrument description and performance, IEEE Journal of Oceanic Engineering 5(2):100-115, 1980.
14 R.L. Jordan, The Seasat-A synthetic aperture radar system, IEEE Journal of Oceanic Engineering 5(2):154-164, 1980.
While originally designed for remote sensing of Earth’s oceans, Seasat-A had a large impact in many other areas, including solid Earth science, hydrology, ecology, and planetary science.15 Following Seasat, several Earth-observing missions were launched in the 1990s by the European Space Agency (ESA) and the National Space Development Agency (NASDA) of Japan. The first and second satellites by ESA were the European remote sensing satellite (ERS-1) in 1991 and ERS-2 in 1995, which carried the active microwave instrument (AMI)—a joint SAR/scatterometer16 and radar altimeter. The third Earth remote sensing satellite by NASDA was the Advanced Earth Observing Satellite (ADEOS) launched in 1996, which carried the NASA scatterometer (NSCAT)17 and a passive advanced microwave scanning radiometer (AMSR). Today, there are many satellite microwave ocean-observing systems in orbit used for both research and operational applications. Meteorological agencies throughout the world use both active and passive microwave observations in their numerical weather models and forecasts. Researchers studying global climate change use these data in ocean and atmospheric circulation models to study short- and long-term interactions of the atmosphere and ocean. In recent years, other scientific applications are now using microwave sensor data to study sea and glacial ice, ocean, and land ecology, and other nonoceanic applications.
TECHNICAL BASIS FOR AIRBORNE/SPACEBORNE ACTIVE EARTH REMOTE SENSING OF OCEANS
Because of the global coverage and frequent revisit time provided by polar satellites, they are the platform of choice for the vast majority of oceanic active remote sensing observations. On the other hand, there are a few notable exceptions, such as tropical cyclone (hurricane and typhoon) surveillance, where airborne sensors are used. With the availability of high-flying, long-duration, remotely piloted (unmanned) aircraft, the use of active microwave sensors is becoming an important part of ocean observations for NASA and the National Oceanic and Atmospheric Administration (NOAA) operations and research. Regardless of the platform, the active microwave sensors are very similar and differ primarily in their measurement geometry. The following sections will discuss the technical basis for each category of active microwave sensors.
______________
15 D. Evans, W. Alpers, A. Cazenave, C. Elachi, T. Farr, D. Glackin, B. Holt, L. Jones, T. Liu, W. McCandless, Y. Menard, R. Moore, and E. Njoku, Seasat—A 25 year legacy of success, Remote Sensing of Environment 94(3):287-428, 2005.
16 E.P.W. Attema, The Active Microwave Instrument on-board the ERS-1 satellite, Proceedings of the IEEE 79(6):791-799, June 1991.
17 Special issue on NSCAT, Journal of Geophysical Research 104:11229-11568, 1999.
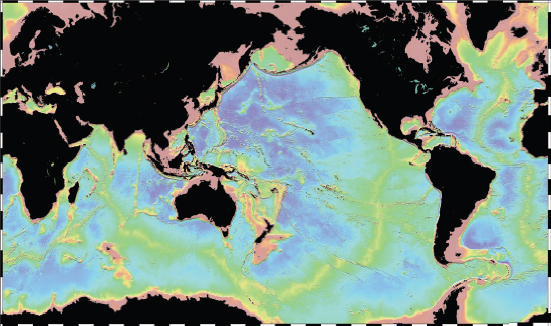
FIGURE 3.1 Ocean gravity field inferred from satellite altimetry, SOURCE: W. Smith and D. Sandwell, “Measured and Estimated Seafloor Topography,” World Data Service for Geophysics, Boulder Research Publication RP-1, poster, 34” × 53”, 1997; courtesy of W.H.F. Smith and D.T. Sandwell and NOAA’s Laboratory for Satellite Altimetry. See also W.H.F. Smith and D.T. Sandwell, Global sea floor topography from satellite altimetry and ship depth soundings, Science 277(5334):1956-1962, 1997.
Altimeters
A radar altimeter is a nadir-viewing, short-pulse radar that makes precise measurements of the height of the radar above the ocean surface. This measurement, coupled with knowledge of Earth’s gravity field (ocean geoid) and precision orbit determination, allows the measurement of the dynamic ocean topography to a precision of a few centimeters (see Figures 3.1 and 3.2). From ocean topography, ocean currents (circulation) and mean sea level can be determined. Also, by recording the rise time of the return echo, the significant ocean wave height can be measured.
For more than four decades, satellite altimeters have been widely used for the measurement of ocean topography to support oceanographic research and for near-real-time operational applications for wave forecasting, sea-level storm surge, and ocean circulation. A brief history of civilian remote sensing altimeters on spacecraft is presented in Table 3.2.
Satellite altimeters have been widely used for ocean studies and have become
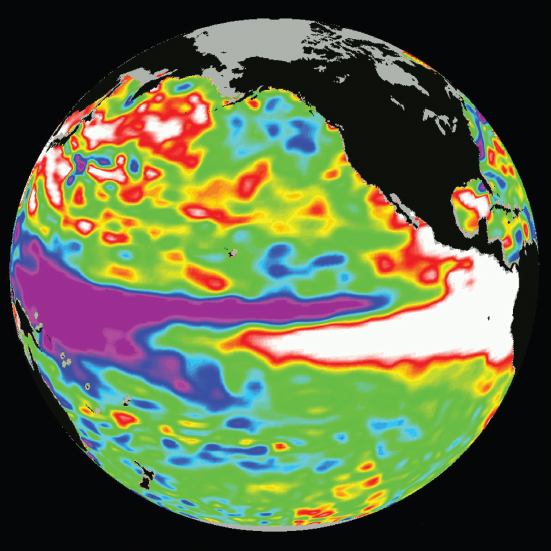
FIGURE 3.2 Ocean surface topography variations derived from satellite altimetry. SOURCE: NASA/JPL; “TOPEX/El Niño Watch—“Double Peak” Pattern Complete,” December 1, 1997, PIA01099, http://photojournal.jpl.nasa.gov/catalog/PIA01099.
essential tools for the study of ocean circulation.18 Satellite altimeters provide very precise measurements of the distance from the satellite to the surface and, coupled with precise orbit determination, very accurate surface topography can be derived. Precision altimetry missions began with TOPEX/Poseidon in 1992 and follow-on missions on Jason-1 and the Ocean Surface Topography Mission (OSTM)/Jason-2.
______________
18 L.L. Fu and A. Cazenave, Satellite Altimetry and Earth Sciences: A Handbook of Techniques and Applications, International GeoPhys Series, Academic Press, San Diego, Calif., 2001.
TABLE 3.2 History of Civilian Remote Sensing Altimeters on Spacecraft
| Years | Spacecraft/Instrument | Band | Height Accuracy (cm)a |
| 1973 | Skylab/S193 | Ku | – |
| 1975 | Geos3 | C | – |
| 1978 | Seasat/ALTb | Ku | 10 |
| 1985-1990 | Geosatd | Ku | |
| 1991-1996 | ERS-1/RAc | Ku | |
| 1995-2011 | ERS-2/RAc | Ku | |
| 1981-2006 | TOPEX-Poseidon/SSALT, NRAc | C, Ku | 5 |
| 1998-2008 | GFOc | C, Ku | |
| 2001- | Jason-1/Poseidon-2c | C, Ku | |
| 2002-2008 | Envisat/RA-2c | Ku | |
| 2006- | CloudSat/CPRd | W | 5,000 |
| 2008- | Jason-2/Poseidon-3c | C, Ku | 2.5 |
| 2010 | Cryosat-2/Sirale | Ku | |
| 2011- | HaiYang-2c | C, Ku | |
| 2013 | Saral/AltiKc | Ka |
a Reported/estimated based on post processing.
b Designed for planetary topography measurement.
c Primarily designed for ocean topography.
d Designed for cloud profiling.
e Designed primarily for ice-sheet elevation and sea-ice freeboard.
SOURCE: Adapted from Fawwaz T. Ulaby and David G. Long, Microwave Radar and Radiometric Remote Sensing, University of Michigan Press, Ann Arbor, Mich., 2014; with permission of the authors.
This NASA/French National Center for Space Studies (CNES) partnership has produced more than three decades worth of ocean topography data for studying ocean circulation and global climate change associated with sea level rise, which is a sensitive indicator of climate change. Scientific and operational oceanographic applications of altimetry data include determining the geoid; measuring ocean currents; monitoring ocean tides; mapping undersea topography, ocean surface wind speed, and significant ocean wave height; and monitoring large-scale ocean phenomena. Planned developments in altimetry include an improved wide-swath interferometric system19 to continue the ocean surface topography time series for
______________
19 B.D. Pollard, E. Rodriguez, L. Veilleux, T. Atkins, P. Brown, A. Kitiyakara, S. Datthanasombat, and A. Prata, The Wide-Swath Ocean Altimeter: Radar interferometry for global ocean mapping with centimeter accuracy, IEEE Aerospace Conference 2:1007-1020, 2002; E. Rodriguez, B.D. Pollard, and J.M. Martin, Wide-swath ocean altimetry using radar interferometry, submitted to
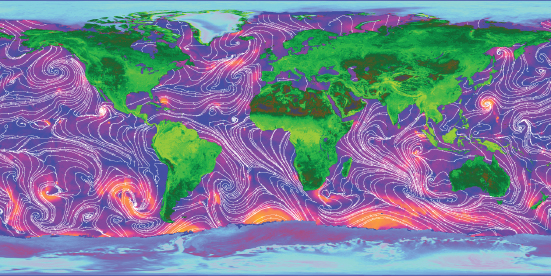
FIGURE 3.3 Scatterometer-derived ocean wind field and radar backscatter over land and ice. Color over land and ice is related to the radar backscatter value, with darker colors indicating lower backscatter. Over the ocean, the color indicates the wind speed with darker colors low wind speeds and lighter colors, high wind speeds. The white lines are streamlines showing wind direction. Note the high wind speed typhoon just south of Japan and the intense storms in the Southern hemisphere. SOURCE: Canadian Space Agency.
assessing climate change. Finally, altimetry data have many operational applications that include U.S. Navy global ocean wave models, NOAA storm surge and coastal flooding models, ocean eddy models, and weather and climate forecasting models on a global scale.
Scatterometers
A scatterometer is a long-pulse radar system that makes an absolute measurement of the Earth-surface-normalized radar cross section, σ0 (i.e., a radar scattering metric). This technique, which measures the ocean σ0 at multiple azimuth angles to infer the ocean surface wind vector (speed and direction), is now well established after four decades of research and development. An example of scatterometer-derived global ocean winds is shown in Figure 3.3, where colors represent the wind speed and the arrows show the wind flow patterns.
IEEE Transactions on Geoscience and Remote Sensing, July 1999, http://www.researchgate.net/profile/Jan_Martin7/publication/251800389_Wide-Swath_Ocean_Altimetry_Using_Radar_Interferometry/links/53ebb2630cf250c8947af385.pdf.
TABLE 3.3 History of Satellite Ocean Wind Scatterometers
| Platform | Instrument | Agency | Band | Frequency (GHz) | Polarization | Spatial Res (km) | Swath wide (km) | Orbit (km) | Alt Launch Date |
| Skylab | S-193 | NASA | Ku | 13.9 | VV, HH | 16 | 180 | 435 | May 1973 |
| Seasat | SASS | NASA | Ku | 14.6 | VV, HH | 50 | 2 × 500 | 799 | June 1978 |
| ERS-1 | AMI (wind) | ESA | C | 5.3 | VV | 50 | 500 | 784 | July 1991 |
| ERS-2 | AMI (wind) | ESA | C | 5.3 | VV | 50 | 500 | 784 | April 1995 |
| ADEOS-1 | NSCAT | USA | Ku | 14.0 | VV, HH | 25/50 | 2 × 600 | 798 | April 1996 |
| QuikScat | SeaWinds | NASA | Ku | 13.4 | VV, HH | 50 | 1800 | 800 | June 1999 |
| ADEOS-2 | SeaWinds | USA | Ku | 13.4 | VV, HH | 50 | 1800 | 806 | December 2002 |
| MetOp1 | ASCAT | ESA/ EUMETSAT | C | 5.2 | VV | 50 | 2 × 550 | 720 | 2005 (estimated) |
SOURCE: Glackin, 2004; D.L. Glackin and G.R. Peltzer, Civil, Commercial, and International Remote Sensing Systems and Geoprocessing, The Aerospace Press and AIAA, El Segundo, Calif., 1999; Kramer, 2001; Fawwaz T. Ulaby and David G. Long, Microwave Radar and Radiometric Remote Sensing, University of Michigan Press, Ann Arbor, Mich., 2014.
A history of satellite wind scatterometers is summarized in Table 3.3. The top panel lists satellite scatterometers and the lower panel depicts the antenna geometry for all satellite wind scatterometers flown in space. To meet the requirement of global ocean coverage in 1-2 days, satellite scatterometers have wide swaths, which result in off-nadir antenna pointing; and the requirement for multiple-azimuth looks is needed in order to recover the surface wind direction from the anisotropic radar backscatter. Note that the antenna configurations are of two types: (1) multiple, fixed fan-beam antennas pointing both forward and aft of the satellite motion and (2) conical scanning dual pencil-beam antennas. Two different frequencies are used: NASA Ku-band 13.4-14.6 GHz and ESA C-band 5.3 GHz.
Recently, ocean salinity measurements from space have been achieved using the active/passive Aquarius instrument aboard the Argentinian SAC-D spacecraft.20 For this application, the L-band (1.26 GHz) scatterometer provides an important “roughness correction” for the radiometer salinity measurement as well as for measuring ocean wind speed.
Seasat-A, launched in 1978, demonstrated the proof-of-concept of microwave scatterometry for measuring ocean vector winds. Starting with the ERS-1 launch in 1991, there is now a continuous time series of greater than two decades of global scatterometer ocean wind observations. In fact scatterometers are the primary source of global ocean surface wind vectors and wind stress for science applications such as ocean and climate model forcing, air-sea interaction studies, and hurricane studies. Moreover scatterometer data are routinely assimilated in operational numerical weather prediction models at meteorological agencies worldwide, and this has revolutionized the analysis and short-term forecasting of winds over the oceans. Also near real-time (NRT) wind products are produced by NASA/Jet Propulsion Laboratory (JPL) and NOAA’s National Environmental Satellite, Data, and Information Service to satisfy national operational requirements. NOAA distributes NRT data products to many operational users.
A National Research Council report noted that “scatterometer measurements have become critical to research and operational applications; that preventing an ocean vector winds data gap is imperative; and that steps must be taken to continue and improve the QuikSCAT ocean vector winds observations by transitioning the technology to an operational system capable of sustaining the measurements for many years.”21
In addition, the σ0 measurements from scatterometers have been extensively
______________
20 D.M. LeVine, G.S.E. Lagerloef, and S.E. Torrusio, Aquarius and remote sensing of sea surface salinity from space, Proceedings of the IEEE 98(5):688-703, 2010.
21 National Research Council, Earth Science and Applications from Space: National Imperatives for the Next Decade and Beyond, The National Academies Press, Washington, D.C., 2007.
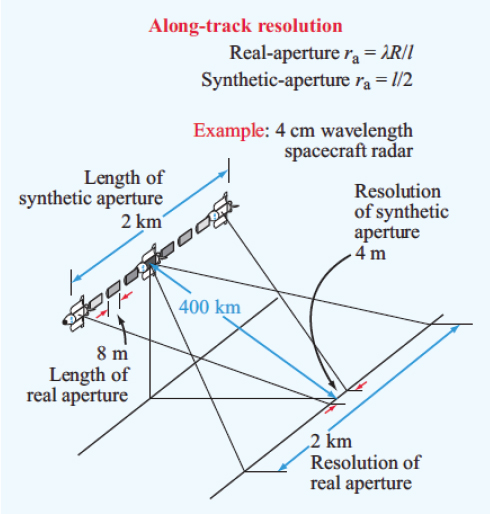
FIGURE 3.4 Illustration of synthetic-aperture principle for radar imaging. Note that R is the distance from the spacecraft to the target, 400 km in this example, and l is the length of the real aperture. SOURCE: Fawwaz T. Ulaby and David G. Long, Microwave Radar and Radiometric Remote Sensing, University of Michigan Press, Ann Arbor, Mich., 2014. With permission of the authors.
used for other applications such as the mapping of sea ice type and extent, detection of icebergs, and measuring soil moisture and vegetation density.22
Synthetic-Aperture Radar
SAR systems operate by transmitting modulated pulses and using Doppler/range processing to construct backscatter images. Satellite SARs provide the high-
______________
22 W.T. Liu, Progress in scatterometer applications, Journal of Oceanography 58(1):121-136, 2002.
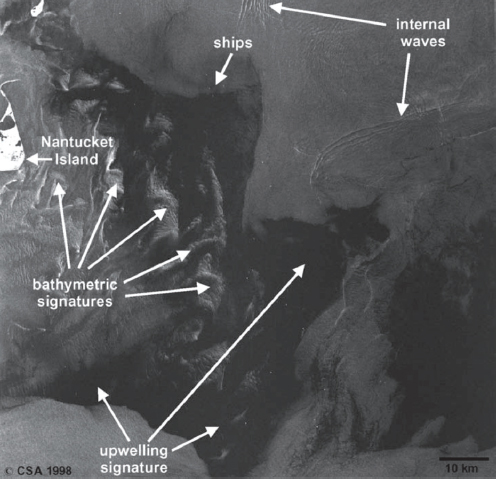
FIGURE 3.5 SAR images of oceanographic features. SOURCE: Canadian Space Agency.
est resolution but are significantly more complex than other radar sensors (e.g., scatterometers and altimeters). Interferometric SAR (InSAR or IFSAR) is a special SAR configuration used to measure topography and the motion of surfaces.
The SAR forms a radar image by coherently combining a time history of radar echoes (amplitude and phase) using a series of inverse Fourier transforms. A major advantage is that the resolution of the SAR in the along-track direction is proportional to the length of the synthetic antenna and independent of the distance. Figure 3.4 illustrates how SAR combines data collected from multiple antenna positions to synthesize a longer effective antenna, thereby achieving high along-track resolution.
Three examples of satellite SAR images for oceanographic applications are given in Figures 3.5-3.7.
Proposals for spaceborne SARs were made in the early 1960s, but the first civil-
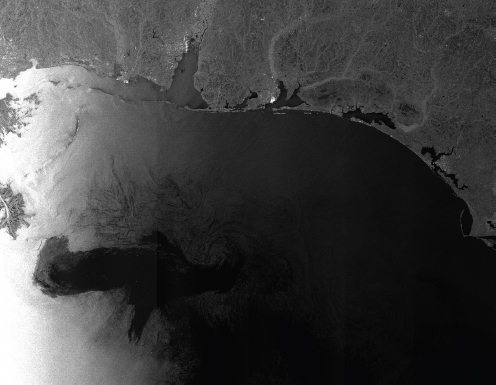
FIGURE 3.6 SAR image of oil spill in Gulf of Mexico. SOURCE: European Space Agency.
ian radar to fly in space was on-board the oceanographic satellite Seasat in 1978.23 Several space shuttle SAR missions were flown through the 1980s, 1990s, and early 2000s, including the Shuttle Radar Topography Mission (SRTM),24 which used radar interferometry to measure global surface topography. Many other spaceborne SAR systems launched by Europe, Japan, Canada, and the United States have been flown or are in various planning stages; the history of space-based imaging radars is summarized in Table 3.4.
SARs can be used for many different applications: geology, sea-ice mapping, disaster monitoring, vessel traffic surveillance, crop monitoring, and military applications. SAR imaging at the L-band and the C-band is not significantly affected by meteorological conditions and so can provide data and observations when other instruments cannot. Additionally, SAR interferometry (both dual-pass and single-pass, as used in the SRTM mission) can provide accurate 3D reconstruction of observed areas.
______________
23 R.L. Jordan, The Seasat-A synthetic aperture radar system, IEEE Journal of Oceanic Engineering 5(2):154-163, 1980.
24 T.G. Farr et al., The Shuttle Radar Topography Mission, Reviews of Geophysics 45(2):RG2004, doi:10.1029/2005RG000183, 2004.
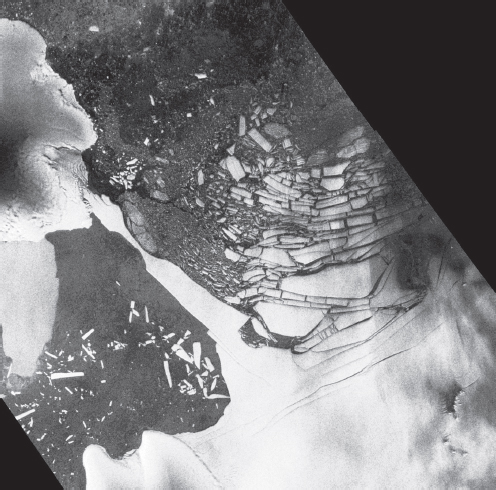
FIGURE 3.7 SAR image of the breakup of an Antarctic ice shelf on the Antarctic Peninsula. SOURCE: Advanced Synthetic Aperture Radar (ASAR) image courtesy the European Space Agency (ESA). The ESA provides additional imagery of the continued breakup of the Wilkins Ice Shelf. See ESA News, “Wilkins Ice Shelf Under Threat,” November 28, 2008, http://www.esa.int/Our_Activities/Space_News.
Bistatic Scatterometry
Sensors can usefully operate in a bistatic mode by measuring the signal transmitted by manmade sources after the signal reflects or scatters off a medium or surface of interest.25 Earth remote sensing platforms will soon begin to take advantage of this mode of operation in earnest.
NASA’s Cyclone Global Navigation Satellite System (CYGNSS), due to launch in 2016, will comprise eight small satellites flying in a constellation formation
______________
TABLE 3.4 History of Space-Based Imaging Radars
| Sensor | Operation | Frequency Band (Polarization) | Comments | Institution, Country |
| Seasat | 1978 | L (hh) | First civilian SAR satellite, operation for only ca. three months | NASA/JPL, USA |
| SIRA-A, SIR-B | 1981, 1984 | L (hh) | Shuttle radar missions | NASA/JPL, USA |
| ERS-1/2 | 1991-2000/ 1995-2001 | C (vv) | European Remote Sensing Satellite (first European SAR satellite) | ESA, Europe |
| J-ERS-1 | 1992-1998 | L (hh) | Japanese Earth Resource Satellite (first Japanese SAR satellite) | JAXA, Japan |
| SIR-C/X-SAR | April and October 1994 | L & C (quad) X (vv) | Shuttle imaging radar mission, first demonstration of spaceborne multifrequency SAR | NASA/JPL, USA DLR, Germany ASI, Italy |
| Radarsat-1 | 1995-today | C (hh) | First Canadian SAR satellite, swath width of up to 500 km with Scan SAR imaging mode | CSA, Canada |
| SRTM | February 2000 | C (hh+vvv) and X (vv) | Shuttle Radar Topography Mission, first spaceborne interferometric SAR | NASA/JPL, USA DLR, Germany ASI, Italy |
| ENVISAT/ASAR | 2002-2012 | C (dual) | First SAR satellite with Transmit/ Receive module technology, swath width up to 400 km | ESA, Europe |
| ALOS/PALSAR | 2006-2011 | L (quad) | Advanced Land Observing Satellite (Daichi), swath width up to 360 km | JAXA, Japan |
| TerraSAR-X/ TanDEM-X | 2007-today 2010-today | X (quad) | First bi-static radar in space, resolution up to 1 m, global topography available by end of 2014 | DLR/Astrium, Germany |
| Sensor | Operation | Frequency Band (Polarization) | Comments | Institution, Country |
| Radarsat-2 | 2007-today | C (quad) | Resolution up to: 1 m × 3 m (azimuth × range), swath width up to 500 km | CSA, Canada |
| COSMO-SkyMed-1/4 | 2007…2010-today | X (dual) | Constellation of four satellites, up to 1 m resolution | ASI/MID, Italy |
| RISAT-1/2 | 2008-today | C (quad) | Follow-on satellite (RISAT-1a) to be launched in 2016, RISAT-3 (L-band) in development | ISRO, India |
| HJ-1C | 2012-today | S (vv) | Constellation of four satellites, first satellite launched in 2012 | CRESDA/CAST/ NRSCC, China |
| Kompsat-5 | Launch scheduled in 2013 | X (dual) | Korea Multi-Purpose Satellite 5, resolution up to 1 m | KARI, Korea |
| PAZ | Launch scheduled in 2013 | X (quad) | Constellation with TerraSAR-X and TanDEM-X planned | CDTI, Spain |
| ALOS-2 | Launch scheduled in 2013 | L (quad) | Resolution up to: 1 m × 3 m (azimuth × range), swath width up to 490 km | JAXA, Japan |
| Sentinel-1a/1b | Launch scheduled in 2013/2015 | C (dual) | Constellation of two satellites, swath width up to 400 km | ESA, Europe |
| Radarsat Constellation-1/2/3 | Launch scheduled in 2017 | C (dual) | Constellation of three satellites, swath width up to 500 km | CSA, Canada |
| SAOCOM-1/2 | Launch scheduled in 2014-2015 | L (quad) | Constellation of two satellites, fully polarimetric | CONAE, Argentina |
SOURCE: Fawwaz T. Ulaby and David G. Long, Microwave Radar and Radiometric Remote Sensing, University of Michigan Press, Ann Arbor, Mich., 2014; based on Moreira et al., 2013.
that will receive both direct and reflected signals from GPS satellites. In doing so, CYGNSS will measure the ocean surface wind field with high temporal resolution and spatial coverage, under all precipitating conditions and over the full dynamic range of wind speeds experienced in a tropical cyclone, contributing greatly to the improvement of tropical cyclone intensity forecasts. The constellation arrangement will sample the ocean more frequently than a single satellite would be able to, resulting in a highly resolved view of the ocean’s surface. The number of observatories and orbital inclination are chosen to optimize the tropical cyclone sampling properties—the result is a dense cross-hatch of sample points on the ground that cover latitudes between ±35 degrees with an average revisit time of 7.0 hours.
The ground-based HF radar is a low-power, chirped, pulse-Doppler radar that measures Bragg scattering from ocean waves in range-gated surface pixels. Since surface gravity waves with wavelengths of 3-30 m are always present on the ocean’s surface, Bragg scattering corresponds to frequencies from 3 to 50 MHz. Operational systems typically fall into transmitting frequency categories that include long-range (4-5 MHz and 8 MHz), medium range (11-13 MHz), standard-range (24-26 MHz), and short-range (42-48 MHz). Spatial resolution in the range direction is proportional to the bandwidth of the transmitted signal (e.g., 25 kHz of bandwidth provides radial resolutions of 6 km, and 500 kHz provides resolutions of 250 m), and the azimuthal spatial resolution is governed by the product of the range and the antenna beam width. HF coastal ocean radars are grouped into two classes: direction-finding and phased-array systems. Phased-array systems utilize large multiantenna arrays that synthesize narrow beams, and direction-finding systems utilize wide beam antennas and signal processing algorithms to resolve the azimuthal bearings from the Doppler spectrum of the radar echo.
The operation of the HF radar can be understood by examining the Doppler echo spectrum from a fixed range bin, as shown in Figure 3.8. The largest contribution to the backscattered power (first order return from Bragg resonant waves) is due to scattering from ocean waves whose wavelength is half the wavelength of the radar. In the absence of an ocean surface current, this results in two peaks in the echo power spectrum at ± the frequency of the Bragg wave. Advection of these ocean waves by a surface current produces a Doppler shift in the spectral location of the first-order peaks. Hence, the observed displacement in frequency can be used to infer the radial component of the current along the radar beam propagation direction. Radar returns from the same patch of water using two spatially separated radars enables estimation of the vector current. The Bragg peaks are flanked by a weaker second-order continuum due to double scattering from two freely propagating waves, as well as scattering from nonlinearly bound waves. This continuum
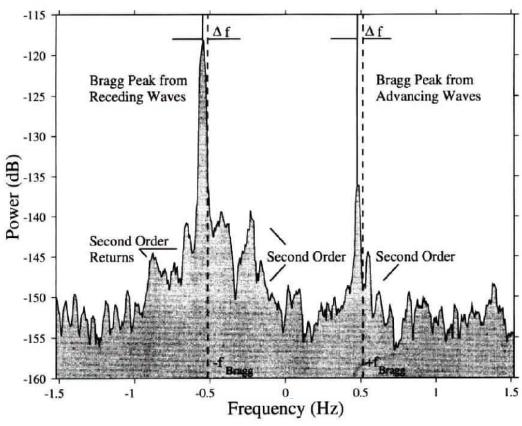
FIGURE 3.8 Example of ocean backscattering Doppler spectrum for a HF radar. Data are for a fixed-range cell with zero ocean surface current. Note that spectral lines occur at ± the Bragg resonant frequency. SOURCE: J.D. Paduan and H.C. Graber, Introduction to high-frequency radar: Reality and myth, Oceanography 10(2):36-39, 1997. Courtesy of the Oceanography Society.
contains contributions from all ocean wave components longer than the Bragg waves, and the second-order part of the power spectrum can be inverted to estimate the frequency-direction spectrum of the longer waves26 and the magnitude and directions of near-surface winds via a wind-wave model.27
______________
26 B.L. Weber and D.E. Barrick, On the nonlinear theory for gravity waves on the ocean’s surface. Part I: derivations, Journal of Physical Oceanography 7(1):3-10, 1977; L. Wyatt, J. Ledgard, and C.W. Anderson, Maximum-likelihood estimation of the directional distribution of 0.53-Hz ocean waves, Journal of Atmospheric and Oceanic Technology 14(3):591-603, 1997.
27 M.L. Heron and R.J. Rose, On the application of HF ocean radar to the observation of temporal and spatial changes in wind direction, IEEE Journal of Oceanic Engineering 11(2):210-218, 1986.
Scientific and Operational Applications
From a scientific perspective, oceanic measurements in the near coastal regions and over the continental shelf are essential for increasing our knowledge about the least observed component of our planetary system—the ocean. The ocean feeds us and provides half our oxygen; it is critical in cycling nutrients, carbon, water, and heat. It regulates our climate. It provides inexpensive transportation of global goods, and it supports economies, from the extractive industries (fisheries, mining, oil and gas) to recreation and tourism.
Further, coastal ocean science aids in decisions about the management of our natural resources, our coastal built environment, and risks/resilience/adaptation in our communities, and it provides important information for making decisions about severe weather events, coastal search and rescue, pollution hazards, and national security. Measuring near-shore and continental shelf ocean currents with high resolution is a high priority for a nation with the majority of its population living within 50 miles of the coast and for the science that is needed to safeguard our ecosystems and our future.
HF radar systems measure large areas of the coastal water, providing excellent maps of surface currents, including both speed and direction. Frequently, HF derived surface current observations are combined with other satellite remote sensing data to examine the coastal ocean in entirely new ways. For example, a collaborative effort among radar operators along the California coast has investigated the utility of combining HF radar with satellite altimetry28 and NOAA’s Advanced Very High Resolution Radiometer (AVHRR) sea surface temperature (SST) imagery to determine the along-shelf wavenumber spectra of surface currents. Results demonstrate that the HF radar observations excelled at producing viable estimates of wave number and frequency spectra of along-shelf velocities, particularly at the important smaller scales where the satellite products become noisy. Also, they showed that HF radar-based currents paired with satellite SST measurements led to observing the spatial structure of complex quantities such as advective heat fluxes at small (1 km) scales within the coastal ocean. From this and other studies it is clear that the HF radar-based surface currents, combined with other remote sensing products such as SST or ocean color, can provide a powerful combined tool for observing the complex circulation present in the coastal ocean and understanding its implications for coastal systems, both natural and anthropogenic.
______________
28 S.Y. Kim et al., Mapping the U.S. West Coast surface circulation: A multiyear analysis of high-frequency radar observations, Journal of Geophysical Research 116(C3), doi 10.1029/2010JC006669, 2011.
Radio Frequency Spectrum Characteristics
All of the active remote sensors used for ocean observations are monostatic pulse radars, and, as such, they emit a periodic pulse train of short pulses, each 10-3 to 10-7 seconds in duration. The radar pulse repetition frequency (PRF) ranges from 10 Hz to 100 KHz, and the duty cycle ranges from 1 percent to 30 percent. For most sensors the spectrum bandwidth is narrow (a few megahertz); however, for altimeters and SARs that use pulse compression, the bandwidths can be hundreds of megahertz. All sensors have a relatively high effective isotropic radiated power (EIRP) that ranges from +40 dBW to +60 dBW.
Possibilities for Spectrum Sharing
Scatterometers
Ku-band scatterometers are long-pulse radars with spinning narrow-beam antennas. Pulse repetition frequencies are generally less than 100 Hz, but the duty cycle can approach 30 percent. The spinning antenna is pointed at a given location for only a few milliseconds. Hence, the probability of a scatterometer interfering with ground or air communications systems is low, so it offers the possibility for spectrum sharing. On the other hand, scatterometers have quite sensitive receivers that can experience interference from ground and airborne communications systems. Because scatterometers make absolute backscatter power measurements, this RF interference (RFI) can be quite degrading and usually results in a loss of data. Fortunately, over the oceans few users share the same frequency bands; however, near the coast significant RFI degradation has been experienced, especially for C-band scatterometers.
C-band scatterometers use range gating and therefore transmit short pulses over nonarticulating fan beam antennas. The PRF is low and the duty cycle is low. However, since the fan beam antennas have very large surface footprints (and there are usually three antennas), the possibility that they will interfere with ground or air communication systems is relatively high for time durations of a few seconds per beam. As was the case for Ku-band scatterometers, these C-band scatterometers also have quite sensitive receivers that can experience interference from terrestrial communications systems; moreover, they operate in the more crowded C-band spectrum region, which have many varied users.
Altimeters
Altimeters are short-pulse radars with very high pulse compression ratios used to achieve nanosecond effective pulse lengths, which means that their spectral width is hundreds of megahertz. The PRFs are in the kilohertz range, the duty cycles are low, and the antennas have narrow beams that point to the nadir. Since these radars average many pulses for range tracking, they are relatively immune to RFI. However they can produce significant interference to ground or air communication systems, but the duration of the interference should last only a few seconds for a given location.
Synthetic Aperture Radars
Because of SAR image processing, SARs are relatively immune to ground-based RFI, except at the L-band. However, since they have broad beam antennas, they have the potential to be significant RFI sources to ground or air communication systems, and the interference could last up to a minute. Further, they frequently employ pulse compression for improved range resolution, which means that their chirp bandwidths are large.
HF/VHF Radar Systems
Since these systems can only operate within the limited HF/VHF range of 3-50 MHz, there needs to be cooperation at the international level to define and protect the spectrum for HF radar operations, and an assessment of the adequacy of the spectrum allocation for future U.S. operational and experimental uses of the technology is needed. At present there is a large installed base of HF/VHF coastal ocean radars in the United States, which are acquired, operated, and maintained almost exclusively by academic researchers for primarily scientific purposes, and the operations of most are subsidized financially by NOAA’s Integrated Ocean Observing System (IOOS). Data from the collective system are collated and marketed to users, such as the Coast Guard or other NOAA offices for use in real-time applications. Thus, NOAA-IOOS serves as the present-day coordinating body for HF/VHF radar uses for ocean observations; however, it is crucial that this application be protected by international agreement.
Finding 3.1: Ground-based high-frequency coastal ocean radars acquire unique ocean current and wave measurements in the coastal zones. There is a large base of CODARs operated and maintained almost exclusively by academic researchers for
primarily scientific purposes, with most being subsidized financially by NOAA’s Integrated Ocean Observing System.
Recommendation 3.1: NOAA should conduct a full assessment of the recent World Radiocommunication Conference 2012 results regarding ground-based high-frequency radars to ensure that the planned build-out needs of the U.S. high-frequency, over-the-horizon radar observing system can be adequately met.
Finding 3.2: CODAR would benefit from allocated bandwidths larger than 25 kHz near 4.438-4.488 MHz.
Recommendation 3.2: The Federal Communications Commission should reinstate an experimental licensing process for coastal ocean dynamics applications radar (CODAR) to allow for future engineering research advances and exploratory science advances.
Finding 3.3: Active microwave sensors provide unique ocean measurements for scientific and operational applications that are vital to the interests of the United States and complementary to passive microwave and visible and infrared sensors.
For nearly four decades, ocean-sensing radar systems have coexisted with the global communications and radar infrastructure. Recently, there have been more instances of RFI to active sensors from communications and navigations systems at the C-band and lower frequencies. So far the degraded sensor performance and loss of data have been manageable over most regions of the world through the application of aggressive RFI mitigation techniques.
Not only are there no viable alternatives to the continuity of active microwave oceanic measurements, but also, emerging requirements for active ocean sensors should be accommodated to allow modest improvements in the capabilities of future systems.
Recommendation 3.3: The Federal Communications Commission and the National Telecommunications and Information Administration should support access to the frequency bands that best support the extraction of ocean-related information from ocean science remote sensing observations.


