
Active Earth Remote Sensing for Land Surface Applications
Active microwave remote sensing has become an essential tool for many science disciplines that seek to observe and understand processes on Earth’s land surface. Over the past two decades, over 20 radar missions have been flown by at least 10 international space agencies where the objective was to study and monitor our planet’s surface. Because of the recognized value of these measurements and because techniques are ever improving, several nations plan further radar missions to observe the land surface. Many more airborne radar remote sensing instruments have been developed to conduct studies on a regional scale, or as platforms for demonstrating future spaceborne techniques. Active microwave remote sensing has proven valuable across a number of science disciplines and practical applications, including geology, urban planning, agriculture and crop management, forestry and biomass assessment, hydrology and water resource management, weather forecasting, generation of topographic maps, sea ice mapping and glacier studies, earthquake and volcano studies, archaeological investigations, and post-disaster assessment. The unique capabilities and global coverage afforded by spaceborne radar are also making key contributions to understanding the mechanisms of long-term climate change and its impacts. From the standpoint of spectral management, active sensors designed to measure land surface processes routinely utilize a wide range of frequencies.
The first spaceborne synthetic aperture radar (SAR) was flown on the Seasat mission in 1978. The data it returned dramatically indicate the value of radar
remote sensing as a means of characterizing Earth’s surface. Active microwave remote sensing offers a number of advantages and unique capabilities in the observation of Earth’s surface. As previously mentioned, radar can “see” through clouds and successfully make measurements when the surface is not illuminated by the Sun. Active microwave devices illuminate the surface, and the resultant echoes contain a wealth of information about the terrain that is embedded in the amplitude, delay, Doppler, phase, and polarization characteristics of the reflected signal. Such signal characteristics can be used to obtain a number of important geophysical parameters, which are discussed in the next section.
Different types of radar systems have been used to study the land surface. Some characteristics of each are described at a high level here; several of these sensor types were also described in Chapter 3 in the context of ocean sensing:
- A scatterometer very precisely measures the intensity of the scattered signal scattered from the surface, in terms of the normalized radar cross section (NRCS). As an example, rough surfaces or surfaces with higher backscatter due the volume scattering associated with vegetation will scatter more energy back in the direction of the radar and consequently will appear brighter than smooth surfaces.
- A polarimeter measures the extent to which a surface produces backscatter as a function of polarization. For example, some surfaces may scatter one polarization more strongly than others. Polarimeters also measure the cross-polarized backscatter, or the backscatter component orthogonal to the polarization with which the target was illuminated. Such polarimetric measurements provide another way in which the surface can be characterized. For instance, vegetated surfaces generate a higher cross-polarized backscatter than nonvegetated surfaces.
- A SAR uses the motion of platform on which the radar antenna is mounted, either an aircraft or a spacecraft, to synthesize a much larger effective antenna. This process allows imagery with very high spatial resolution to be obtained. This imagery often has sufficient detail to show ground features on the order of meters, thus making it comparable in resolution to optical sensors. SARs are the dominant form of system for observing land processing.
- Over the past decade, interferometric SAR (InSAR) has matured and become a powerful technique to observe Earth’s surface in three dimensions. InSAR is accomplished by observing the same scene from at least two antenna positions in space or time and forming an interferogram. When separated in the cross-track direction, the interferometer can measure topography, and when separated in the along-track direction, it measures the velocity of the surface and targets on the ground. Surface height can
-
be mapped using topographic InSAR when two antennas observe a scene at (or sufficiently near) the same time. Repeat-pass and differential InSAR represent a category of techniques whereby a location on Earth is observed by a radar at two different times in order to measure the slight changes in the surface over that period. Such systems have demonstrated that motion to within millimeters can be detected, over time periods from days to years, depending on the surface conditions and nature of the surface motion.
- Radar altimeters were discussed at some length in Chapter 3 in the context of ocean surface topography. They can also be used for high accuracy determination of heights over land as well, such as the accumulation of snow and ice in polar regions.
- A radar sounder is used to probe the vertical structure of the sub-surface from an airborne or spaceborne platform. For science applications on Earth, sounders are most often used to probe the interior of ice sheets but can also be used to probe the land subsurface where conditions permit. Ground-penetrating radar (GPR) also uses sounding techniques, but the term usually refers to the case where a sensor is positioned on the surface.
It is important to note that these sensor type designations are not mutually exclusive, and most modern sensors used in land applications have characteristics of more than one type of sensor. For instance, a well-calibrated SAR can function as a high-resolution scatterometer. Scatterometers and SARs typically have multiple polarization channels and thus are also polarimeters while interferometers can be employed as wide-area high-resolution altimeters, and so forth.
The above-described sensor types can also be designed for a wide range of frequencies, depending on what geophysical parameters are to be measured. In general, the lower the frequency, the more penetration into ground, vegetation, or ice. Subsurface sounders consequently operate at frequencies as low as the HF and VHF bands; sensors that probe the ground underneath vegetation typically require the UHF band through the C-band; and measurements that require limited to no penetration typically employ frequencies at the X-band through the Ka-band.
Although the primary focus of this section is the use of radar as a remote sensing tool, it is also important to acknowledge the use of other active techniques that utilize the radio spectrum. Radio ranging between two orbiting satellites is used to precisely measure Earth’s gravity field, as is the case with the joint U.S./German Gravity Recovery and Climate Experiment (GRACE). The gravity field contains information on Earth’s deep subsurface structure and composition not available by any other means. Such gravity measurements are used in the fields of geodesy, oceanography, seismology, climatology, hydrology, and cryospheric studies. Also, global navigation satellite systems (GNSS) such as GPS provide the means to very precisely locate a point on Earth, and, with differential measurements, allow the
detection of millimetric-scale motions. Consequently, these systems are also highly valuable in the fields of geodesy and seismology. Because these systems use radio frequency methods, they are also susceptible to spectrum concerns such as radio frequency interference (RFI).
Radars are used from both airborne and spaceborne platforms. Airborne radars are operated either as experimental precursors for satellite systems or to augment satellite observations. An example of the latter is NASA’s Operation IceBridge, which provides a major survey of Earth’s polar ice in both the Arctic and Antarctic oceans. The program, which has been in continuous operation since 2009, generates three-dimensional views of ice sheets, ice shelves, and sea ice. It uses four different airborne radar systems that span in frequency from the VHF band to the Ku-band.
Table 4.1 provides a summary of the currently operating active sensor missions for land applications, and Table 4.2 provides a summary of future such missions.
SCIENCE AND APPLICATIONS OF ACTIVE MICROWAVE REMOTE SENSING OF EARTH’S SURFACE
The Solid Earth: Geology, Geophysics, and Seismology
From the very beginning of the radar remote sensing era, the value of SAR images has been recognized in the field of solid Earth studies.1 Radar backscatter and polarimetry give insight into the nature of surface materials. Geologists are using radar to map the distribution of different rock types and to understand the history of landform formation and erosion. Radar penetrates vegetation to offer a view of the underlying geological structure, such as the presence of faults or sedimentary strata, which are key features of interest in natural resource exploration. Radar can also penetrate shallow dry surface material to show the underlying rock morphology. Figure 4.1 shows a rather dramatic case of how the early SIR-A radar, operating at the L-band, was able to peer underneath the sand of the Sahara to reveal previously unmapped drainage channels from an earlier, wetter geologic era. This vegetation and surface penetration capability has been applied in the field of archeology as well.
In recent years, the development of powerful interferometric SAR techniques has allowed scientists to study dynamic phenomena associated with the solid Earth, such as those associated with plate tectonics and volcanism.2 Society’s exposure to
______________
1 C. Elachi, Spaceborne Radar Remote Sensing: Applications and Techniques, IEEE Press, New York, N.Y., 1987.
2 P. Rosen, S. Hensley, I.R. Joughin, F.K. Li, S.N. Madsen, E. Rodriguez, and R.M. Goldstein, Synthetic aperture radar interferometry, Proceedings of the IEEE 88(3), 2000.
TABLE 4.1 Current Active Land Applications Satellite Sensor Missions (listed in order of increasing frequency)
| Instrument | Frequency band (GHz) | Launch | Description and Comments |
| SMAP radara | 1.26 GHz L-band 1.215-1.30 GHz | January 2015 | Makes global measurements of land surface soil moisture and freeze/thaw state; combined with radiometer (1.4 GHz) measurements. (NASA) |
| ALOS-2 PALSAR-2b | 1.26 GHz L-band 1.215-1.30 GHz | May 2014 | Using L-band synthetic aperture radar, observes forests and land deformation, acquiring image data of the ground surface day and night regardless of the weather. (JAXA) |
| HJ-1Cc SAR-S | 3.2 GHz S-band 3.1-3.2 GHz | December 2012 | Using S-band synthetic aperture radar, detects environment change, climate change observation, soil moisture retrieval, water cycle monitoring. (CAST) |
| Sentinel-1 (CSAR)d | 5.4 GHz C-band 5.25-5.57 GHz | May 2013 | Using advanced C-band synthetic aperature radar to provide all-weather, day- and-night images of Earth’s surface; used to monitor ice loss from ice caps and ice sheets and used to map ground movements related to earthquakes. (ESA) |
| RISAT-1 C-SARe | 5.3 GHz C-band 5.25-5.57 GHz | April 2012 | Using C-band SAR to make all-weather as well as day- and-night SAR observation capability in applications such as agriculture, forestry, soil moisture, geology, sea ice, coastal monitoring, object identification, and flood monitoring. (ISRO) |
| Metop A,B,C ASCATf | 5.2 GHz C-band 5.25-5.57 GHz | October 2006 | Makes C-band scatterometer measurements of wind speed and direction over the oceans; provide data for ice and land applications, such as sea ice extent, permafrost boundary, desertification. (ESA/EUMETSAT) |
| Instrument | Frequency band (GHz) | Launch | Description and Comments |
| Instrument | Frequency band (GHz) | Launch | Description and Comments |
| TerraSAR X- SARg | 9.65 GHz X-band 9.3-9.9 GHz | June 2007 | X-band synthetic aperture radar observation of Earth’s surface; for instance, observing vegetation for accurate and up-to-date information about the distribution and composition of, and changes in, types of vegetation forming the basis for many applications; utilizing high spatial resolution. (DLR) |
| COSMO SkyMedh | 9.6 GHz X-band 9.3-9.9 GHz | June 2007 | Constellation of four satellites for X-band SAR observation of Earth’s surface; applications to environment disaster monitoring, observations of oceans and sea coasts, agricultural and forest areas, radar imaging for cartography (ASI) |
a NASA, “SMAP: Instrument,” http://smap.jpl.nasa.gov/observatory/instrument/, accessed June 3, 2015.
b JAXA, “Advanced Land Observing Satellite-2 “DAICHI-2” (ALOS-2),” http://global.jaxa.jp/projects/sat/alos2/, accessed June 3, 2015.
c Earth Observation Portal, “HJ-1 (Huan Jing-1: Environmental Protection & Disaster Monitoring Constellation),” https://directory.eoportal.org/web/eoportal/satellite-missions/h/hj-1, accessed June 3, 2015.
d ESA, “Sentinel-1,” https://earth.esa.int/web/guest/missions/esa-operational-eo-missions/sentinel-1, accessed June 3, 2015.
e Indian Space Research Organisation, “RISAT-1,” http://www.isro.gov.in/Spacecraft/risat-1, accessed June 3, 2015.
f CNES, “Jason 1 and 2,” http://www.cnes.fr/web/CNES-en/1441-jason.php, accessed June 3, 2015.
g DLR, “TerraSAR-X - Germany’s radar eye in space,” http://www.dlr.de/dlr/en/desktopdefault.aspx/tabid-10377/565_read-436/#/gallery/350, accessed June 3, 2015.
h “COSMO-SkyMed Web Site,” http://www.cosmo-skymed.it/en/index.htm, accessed June 3, 2015.
NOTE: Acronyms are defined in Appendix D.
SOURCE: Courtesy of Bryan Huneycutt, NASA/JPL.
terrestrial natural hazards is increasing. Large overdue earthquakes will be costly and threaten densely populated regions on the U.S. Western Coast, home to about 50 million people. Volcanic eruptions also endanger many areas of Earth and can disrupt air travel. Radar remote sensing from airborne or spaceborne platforms provides a unique capability for monitoring such hazards. Repeat-pass SAR interferometry is capable of measuring Earth motions at the centimeter or even millimeter level over time, as well as accurately measuring how the land surface
TABLE 4.2 Future Active Land Application Sensing Satellite Missions (listed in order of increasing frequency)a
| Instrument | Frequency band (GHz) | Planned aunch | Description and Comments |
| BioMassb | 0.43 GHz P-bandc | 2018 | Measures amount of biomass and forest height will be measured at a resolution of 200 m, and forest disturbances such as clear-cutting at a resolution of 50 m, providing an important tool for sustainable forest management. (ESA) |
| NI-SAR L-SARd | 1.26 GHz L-band 1.215-1.30 GHz (Dual L/S-band) | 2020 | L-band polarimetric SAR observation and measurements of some of the planet’s most complex processes, including ecosystem disturbances, ice-sheet collapse, and natural hazards such as earthquakes, tsunamis, volcanoes and landslides. (NASA/ISRO) |
| SAOCOM 1A/1Be | 1.275 GHz L-band 1.215-1.30 GHz | 2015/2016 | L-band interferometric SAR to obtain soil moisture maps, interferometric topological maps, and to support emergencies. (CONAE) |
| NI-SAR S-SARf | 3.2 GHz S-band 3.1-3.3 GHz (Dual L/S-band) | 2020 | S-band polarimetric SAR observation and measurements of some of the planet’s most complex processes, including ecosystem disturbances, ice-sheet collapse, and natural hazards such as earthquakes, tsunamis, volcanoes and landslides. (NASA/ISRO) |
| Sentinel 3 SRALg | 5.4 GHz C-band 5.25-5.57 GHz (Dual C/Ku-band) | 2015 | Multimode C/ Ku-band radar; C-band (ionospheric corrections) altimeter mode for ocean surface topography, surface wind speed, surface wave height; and SAR mode for C-band imagery of Earth’s surface (ESA) |
| RadarSAT Constellation Mission (RCM)h | 5.4 GHz C-band 5.25-5.57 GHz | 2018 | Constellation of three SARs to improve revisit time over RadarSat 2; main uses in areas of maritime surveillance/ national security and resource management. (CSA) |
| Instrument | Frequency band (GHz) | Planned aunch | Description and Comments |
| Metop-SG-B SCAi | 5.25 GHz C-band 5.25-5.57 GHz | 2022 | C-band scatterometer to provide ocean surface wind vectors and land surface soil moisture (ESA/ EUMETSAT) |
| Paz SAR-Xj | 9.65 GHz X-band 9.3-9.9 GHz | 2015 | X-band SAR imagery with fine resolution to serve the security and defense needs (INTA) |
| SCLP X-SARk | 9.6 GHz X-band 9.3-9.9 GHz (Dual X/Ku-band) | 2030 | X-band SAR for the Snow and Cold Land Processes (SCLP) mission to study the hydrology of the snow melting zones. (NASA) |
| CSG 1/2 SARl | 9.6 GHz X-band 9.3-9.9 GHz | 2015/ 2016 | Constellation of two satellites with X-band SARs as CosmoSkyMed Second Generation (CSG) instruments (larger swath and finer spatial and radiometric resolution) (ASI) |
| Sentinel 3 SRALm | 13.6 GHz Ku-band 13.25-13.75 GHz (Dual C/Ku-band) | 2015 | Multimode C/ Ku-band radar; Ku-band altimeter mode for ocean surface topography, surface wind speed, surface wave height; and SAR mode for Ku-band imagery of Earth’s surface (ESA) |
| Meteor-M SARn | 9.6 GHz X-band 9.3-9.9 GHz | 2015/ 2016 | X-band SAR imagery for observing Earth’s surface; monitoring ice fields (RSA) |
| SCLP Ku-SARo | 17.25 GHz Ku-band 17.2-17.3 GHz (Dual X/Ku-band) | 2030 | Ku-band SAR (the only spaceborne SAR at 17.2 GHz) for the Snow and Cold Land Processes (SCLP) mission to study the hydrology of the snow melting zones. (NASA) |
| SWOTp | 35.6 GHz Ka-band 35.5-36.0 GHz | 2019 | Ka-band interferometric radar to make global survey of Earth’s surface water, observe the fine details of the ocean’s surface topography, and measure how water bodies change over time. (NASA) |
| Instrument | Frequency band (GHz) | Planned aunch | Description and Comments |
| Signal SARq | 35.8 GHz Ka-band 35.5-36.0 GHz | 2019 | Measures accurately topography and topographic changes associated with mass change or other dynamic effects on glaciers, ice caps and polar ice sheets, complemented with glacier velocity measurements (DLR) |
a These future missions are a sampling of “potential” future applications that have come to the attention of the ITU-R WP7C, including ones that are just concepts.
b ESA, “ESA’s Biomass Satellite goes Ahead,” February 19, 2015, http://www.esa.int/Our_Activities/Observing_the_Earth/ESA_s_Biomass_satellite_goes_ahead, accessed June 4, 2015.
c P. Foster, J. Hartmann, H. Horie, and R. Wylde, “Performance Verification of the 94 GHz Quasi-Optical-Feed for EarthCARE’s Cloud Profiling Radar,” Proceedings of the 5th ESA Workshop on Millimeter Wave Technology and Applications and 31st ESA Antenna Workshop, May 18-20, 2009, Noordwijk, The Netherlands, ESA WPP-300, 2009.
d NASA, “NISAR: Technology,” http://nisar.jpl.nasa.gov/technology/#, accessed June 4, 2015.
e CONAE, “SAOCOM (Satélite Argentino de Observación Con Microondas),” http://www.conae.gov.ar/index.php/english/satellite-missions/saocom/introduction, accessed June 4, 2015.
f NASA, “NISAR: Technology,” http://nisar.jpl.nasa.gov/technology/#, accessed June 4, 2015.
g ESA, “SENTINEL-3 Altimetry: SRAL Instrument,” https://sentinel.esa.int/web/sentinel/sentinel3-altimetry-wiki/-/wiki/Sentinel%20Three%20Altimetry/SRAL+Instrument, accessed June 4, 2015.
h Earth Observation Portal, “RCM (RADARSAT Constellation Mission),” https://directory.eoportal.org/web/eoportal/satellite-missions/r/rcm, accessed June 4, 2015.
i Earth Observation Portal, “MetOp-SG (MetOp-Second Generation Program),” https://directory.eoportal.org/web/eoportal/satellite-missions/m/metop-sg, accessed June 4, 2015.
j Earth Observation Portal, “PAZ SAR satellite mission of Spain,” https://directory.eoportal.org/web/eoportal/satellite-missions/p/paz, accessed June 4, 2015.
k NASA, “Instrument: SAR-X/Ku,” OSCAR, 2014, http://www.wmo-sat.info/oscar/instruments/view/1045.
l Earth Observation Portal, “COSMO-SkyMed Second Generation (CSG) Constellation,” https://directory.eoportal.org/web/eoportal/satellite-missions/c-missions/cosmo-skymed-second-generation, accessed June 4, 2015.
m ESA, “SENTINEL-3 Altimetry: SRAL Instrument,” https://sentinel.esa.int/web/sentinel/sentinel3-altimetry-wiki/-/wiki/Sentinel%20Three%20Altimetry/SRAL+Instrument, accessed June 4, 2015.
n Earth Observation Portal, “Meteor-M-1,” https://directory.eoportal.org/web/eoportal/satellitemissions/m/meteor-m-1, accessed June 4, 2015.
o NASA, “Instrument: SAR-X/Ku,” OSCAR, 2014, http://www.wmo-sat.info/oscar/instruments/view/1045.
p NASA, “Surface Water & Ocean Topography (SWOT) Mission,” https://swot.jpl.nasa.gov/mission/, accessed June 4, 2015.
q DLR, “SAR Missions,” http://www.dlr.de/hr/en/desktopdefault.aspx/tabid-4622/7621_read-32488/, accessed June 4, 2015.
NOTE: Acronyms are defined in Appendix D.
SOURCE: Courtesy of Bryan Huneycutt, NASA/JPL.
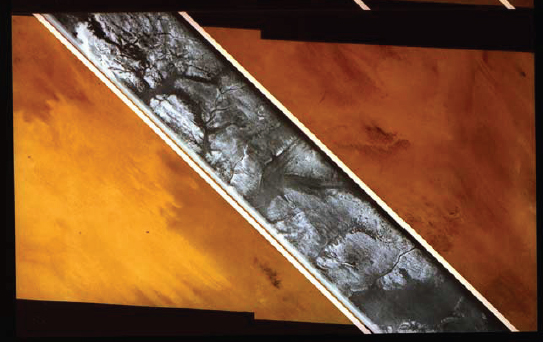
FIGURE 4.1 L-band shuttle imaging radar A (SIR-A) SAR image strip overlaid on optical image of same region in the Sahara. L-band radio waves penetrate the shallow sand to reveal ancient drainage network when the region was much wetter. SOURCE: NASA/JPL; “Shuttle Imaging Radar-A,” November 12, 1981, http://www.jpl.nasa.gov/history/index_timeline.htm.
moved after an event. The ground heave and bulging that often precede volcanic eruptions can also be monitored.
Earth deformation measurements have been obtained from space by the European Space Agency’s (ESA’s) Sentinel satellite (operating at the C-band), the Canadian Space Agency’s Radarsat satellites (operating at the C-band), and the Japan Aerospace Exploration Agency PALSAR instrument (operating at the L-band). Currently planned for launch in 2020, the joint NASA/ISRO NISAR mission will operated at the L- and S-bands and is being designed to frequently and consistently monitor all of Earth’s major seismic zones. Further, Earth deformation measurements on regional scales and for specific targets of interest have been performed by such sensors as NASA’s airborne UAVSAR system (operating at the L-band). Although not a radar remote sensing technique, the use of differential GPS to precisely measure the motion of points on Earth is also critical to the field of seismology. Gravity field measurements made by satellite-to-satellite radio ranging also form a unique data set for the understanding of Earth’s deep interior and tectonic processes.
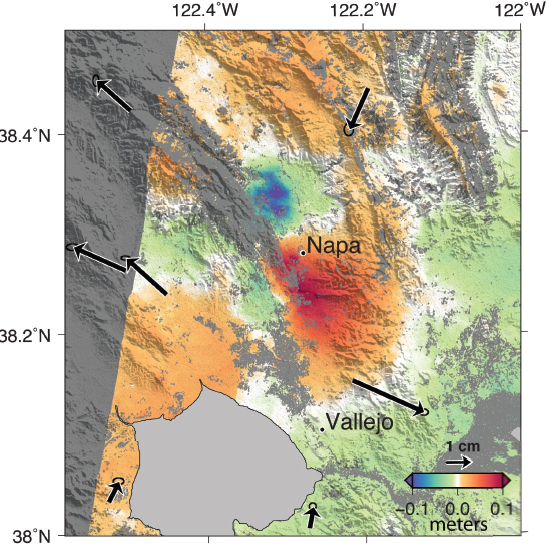
FIGURE 4.2 False color image showing deformation measured from magnitude 6.0 earthquake that struck southern Napa County northeast of San Francisco, California, on August 24, 2014. Repeat-pass interferometric motion data from Italian Space COSMO-SkyMed X-band SAR satellites to calculate a map of the deformation of Earth’s surface caused by the earthquake, as shown in this false-color map that has been combined with shaded relief topography (in gray). The red areas south of Napa moved about 10 cm to the east and upward during the earthquake. The dark green and blue areas north of Napa moved about 10 cm to the west and downward due to the earthquake. Black arrows indication motion measured by GPS stations. SOURCE: NASA/JPL-Caltech/ASI/Google Earth, Image PIA18798: NASA Analyses of Global Positioning System Data and Italian Radar Satellite Data Reveal Napa Quake Ground Deformation.
Vegetation: Agriculture, Ecosystems, and Biomass
Radar signals interact with surface vegetation in complex ways. There is varying penetration into the depth of the vegetation cover, depending on the frequency of the radar and the density and water content of the plant matter. The backscattered radar signal is the result of scattering off trunks, stems, and leaves as well as reflections from the ground itself. Particularly when multiple polarizations and phase information are captured, this scattering complexity results in a great richness of information that can be exploited to characterize the vegetation in ways that other sensors cannot. SAR data are used by many nations around the world for agricultural studies and evaluations.3 Utilizing polarimetry, classification algorithms have been developed to identify the type of crop that is growing, estimate yields, monitor crop health, and aid in the efficient allocation of irrigation resources. Spaceborne radar is also used to study how the expansion of agriculture or urbanization impacts natural ecosystems such as forests and wetlands, the health of which is being increasingly associated with the overall health of the planet.
Deforestation and forest degradation are estimated to account for nearly 20 percent of global greenhouse emissions, more than the global transportation sector and second only to the energy sector.4 Deforestation and forest degradation contribute to atmospheric greenhouse gas emissions through the combustion of forest biomass, conversion to agricultural or pasture land, logging, and the decomposition of any remaining plant material and soil carbon. It is not well known how Earth’s terrestrial biomass is changing and interacting with climate variability. Radar remote sensing provides a means to assess the extent of Earth’s biomass over time and is perhaps the most accurate means currently available for estimating global carbon stocks within the above-ground plant matter.5
A variety of radar techniques are being employed to assess biomass as well as conduct related measurements of canopy height, vegetation type, and vegetation density. These techniques include polarimetry (Figure 4.3), interferometric height mapping, multiple baseline interferometric tomography, and multifrequency techniques. As an example, the Fugro Earthdata GeoSAR system, designed and built at the Jet Propulsion Laboratory, is able to measure canopy height by comparing simultaneously collected P-band interferometric height data, which penetrates deeply into the vegetation, with X-band interferometric height data, which is more sensitive to the treetops. The difference in these heights is related to the overall
___________
3 Government of Canada, Report on International GEO Workshop on Synthetic Aperture Radar (SAR) to Support Agricultural Monitoring, November 2-4, Alberta, Canada, 2010.
4 G.R. van der Werf, D.C. Morton, R.S. DeFries, J.G.J. Olivier, P.S. Kasibhatla, R.B. Jackson, G.J. Collatz, and J.T. Randerson, CO2 emissions from forest loss, Nature Geoscience 2:737-738, 2009.
5 National Research Council, Earth Science and Applications from Space: National Imperatives for the Next Decade and Beyond, The National Academies Press, Washington, D.C., 2007.
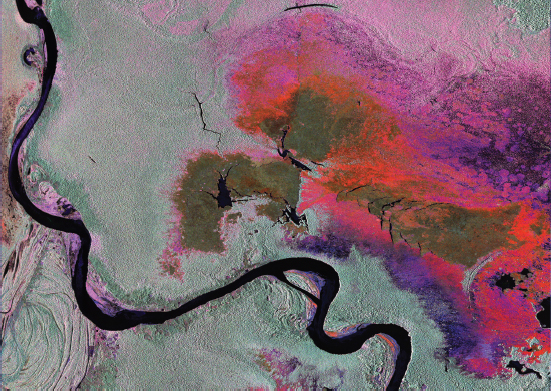
FIGURE 4.3 Polarimetric SAR image of Peru’s Pacaya-Samiria National Reserve, measured by NASA’s L-band UAVSAR March 17, 2013. Areas by color: black is open water, grayish-green is tropical forest, dark green is low vegetation, perhaps floating vegetation, while red and pink are two different types of inundated vegetation. SOURCE: NASA/JPL; Polarmetric SAR image (channels: HH HV VV) of Peru’s Pacaya-Samiria National Reserve (March 17, 2013), http://uavsar.jpl.nasa.gov/education/postcards.html.
heights of the trees. ESA is planning the P-band BIOMASS satellite mission and NASA/ISRO is planning the L-band/S-band NISAR satellite mission. Both are currently planning for launch in 2020 and have global biomass estimation and ecosystem characterization as key science objectives.
Land Surface Hydrology
Terrestrial freshwater is obviously essential to human activity, and there is strong interest in managing this critical resource more effectively. The science of hydrology seeks to understand the movement, distribution, and quality of water on Earth. There is a strong interest in understanding and predicting the conditions that lead to drought, particularly in light of climate change, as well as predicting
extreme events such as floods. In addition to its roles as resource and hazard, water is also important in Earth’s climate system.
Land water can exist as surface water bodies such as lakes and rivers, reside in the soil as moisture or permafrost, flow as ground water in aquifers, or rest on top of the surface as snow or ice. In situ methods are often inadequate to characterize the amount and extent of water over broad areas. Consequently, active remote sensing techniques from airborne or spaceborne platforms are a valuable and reliable means to measure water in its various forms over local, regional, or global scales.
Soil Moisture
Soil moisture measurements are used globally for a wide range of applications in hydrology, agriculture, climate monitoring, weather forecasting, and disaster mitigation (including risk forecasting of landslides and flood runoff). An additional application is in the assessment of trafficability of vehicles for defense purposes.
Soil moisture is also a key control on evaporation and transpiration at the land-atmosphere boundary. Since large amounts of energy are required to vaporize water, soil moisture control also has a significant impact on the surface energy flux. Thus, soil moisture variations affect the evolution of weather and climate particularly over continental regions.6
Radar is a demonstrated means of measuring soil moisture because the measured backscatter cross section is a strong and characterizable function of the amount of water in the soil.7 Further, by means of synthetic aperture processing, soil moisture can be retrieved at high spatial resolution. Relatively low frequencies (primarily the UHF and L-bands, but also the C-band for some applications) are typically utilized for soil moisture measurements because they are able to penetrate vegetation cover and, to varying extents, into the soil itself.
The ESA/EUMETSAT ASCAT C-band scatterometer is being employed to derive a global soil moisture index at coarse resolution globally (Figure 4.4). NASA has developed the Soil Moisture Active Passive (SMAP) mission, scheduled for launch in early 2015. This sensor will employ both radar and radiometer channels at the L-band in order to produce a global soil moisture product at medium resolution. In addition to soil moisture, the SMAP radar will detect whether or not the soil is frozen at high latitudes. The freeze/thaw data are anticipated to become an
___________
6 SMAP website, http://smap.jpl.nasa.gov/science/, accessed November 25, 2014.
7 K.C. Kornelsen and P. Coulibaly, Advances in soil moisture retrieval from synthetic aperture radar and hydrological applications, Journal of Hydrology 476L:460-489, 2013; D. Entekhabi, E.G. Njoku, P.E. O’Neill, K.H. Kellogg, W.T. Crow, W.N. Edelstein, J.K. Entin, S.D. Goodman, T.J. Jackson, J. Johnson, J. Kimball, et al., The Soil Moisture Active Passive (SMAP) Mission, Proceedings of the IEEE 98(5):704-716, 2010.
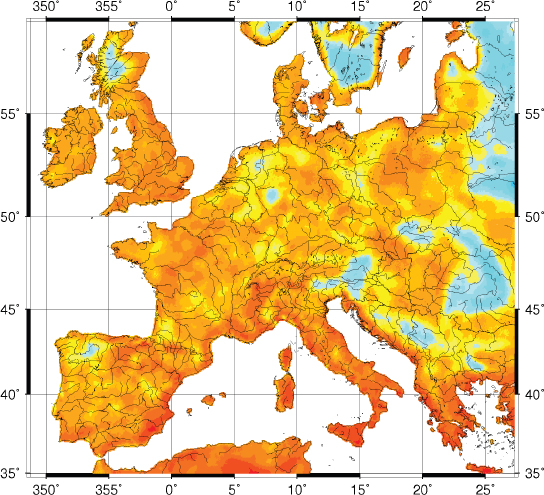
FIGURE 4.4 ASCAT C-band scatterometer derived measurements of soil wetness (expressed as percentage saturation) for the unusually dry European Spring in 2011. SOURCE: EUMETSAT; Metop-A, ASCAT, 15-27 May 2011 UTC Surface Soil Moisture Product (7.5 km2 box averages).
important scientific predictor of the potential release of methane through anaerobic decomposition of the organic matter stores that have accumulated in boreal arctic tundra over many millions of years. The rapid release of methane from such stores is thought to have serious additional global warming potential. As another example, the Argentine SAOCOM mission, to be launched in 2015, is an L-band polarimetric SAR for which one primary measurement is the regular production of high-resolution soil moisture maps in agricultural regions of significant national interest, such as the pampas. Several other current and planned spaceborne radar missions have soil moisture as one of their measurement objectives. Further, there
are multiple airborne sensors (such as NASA’s UAVSAR and PALS instruments) that also are tasked to measure soil moisture.
Although the most commonly used frequency of the L-band can accurately measure soil moisture within a few centimeters of the surface, there is also the scientific need to measure moisture at greater depths. The newly deployed NASA AirMOSS instrument is an airborne SAR operating at the UHF band that measures soil moisture in the “root zone” at greater depths. Root-zone soil moisture impacts carbon uptake because plant roots need water for activating photosynthesis. Root zone soil moisture also impacts carbon release through the respiration processes, where vegetation and organisms in soil consume available organic matter and release CO2 to the atmosphere.
Surface Water
Observations of the temporal and spatial variations of water stored in rivers, lakes, and wetlands are extremely important to life on the planet, including human life. However, the current understanding of the dynamics of terrestrial surface waters and their interactions with coastal oceans and estuaries is still limited. Radar is able to (1) identify the existence and boundaries of surface water because its backscattering characteristics are distinctly different from that of dry land, and (2) is also capable of determining the level of water bodies to an accuracy of centimeters using interferometric techniques.8
The global mapping of surface water dynamics is one of the main objectives of the joint NASA/CNES Surface Water Ocean Topography (SWOT) mission scheduled for launch in 2020. SWOT will employ a near nadir-looking Ka-band interferometric SAR to measure the surface of water bodies. The system will produce water maps which resolve rivers 100 meters wide, lakes 250 m2 in area, wetlands, and reservoirs, with a water level accuracy of 10 cm. With these capabilities SWOT will contribute to a fundamental understanding of the terrestrial branch of the global water cycle by measuring water storage changes in all wetlands, lakes, and reservoirs, and also by more accurately estimating discharge in rivers.
Groundwater
In many parts of the world rainfall and surface water cannot satisfy the growing demands of the people who live in those regions. Pumping groundwater from subsurface aquifers is therefore relied upon for urban and agricultural needs. Unfortunately, climate change and growing populations are causing increasing stress on
___________
8 D.E. Alsdorf, E, Rodriguez, and D.P. Lettenmaier, Measuring surface water from space, Reviews of Geophysics 45(2), 2007.
groundwater resources around the world. Active remote sensing by airborne or spaceborne radar offer one means of understanding and monitoring groundwater resources.9 When the surface soil cover is sufficiently dry, radar sounders operating at HF and VHF frequencies can be used to penetrate below the surface and directly observe the extent and dynamics of shallow (<100 m) aquifers. Another technique used to monitor the depletion of aquifers is the observation of surface subsidence via repeat-pass interferometric radar (Figure 4.5). As underground water is depleted, the earth slowly collapses into the cavity that is formed, which is manifested on the surface as a gradual subsidence. Interferometric radar is a unique technique to detect this very subtle lowering of Earth’s surface—typically on the order of centimeters—over very wide areas, and has been successfully carried out with several airborne and spaceborne sensors. This technique has been employed extensively from space by the European C-band Envisat and Sentinal-1A systems, and the Japanese L-band PALSAR systems. The joint NASA/ISRO L-band SAR mission (NISAR) is scheduled to launch in 2020 and also has the regular monitoring of aquifer related subsidence as one of its key science objectives. Finally, while not a radar and perhaps not as susceptible to spectrum issues, satellite-to-satellite radio ranging is another indispensable tool to infer groundwater dynamics.
Snow
Measurements of snowpack extent and snow water equivalent (SWE) are critical for water management in many regions, particularly in the Western United States, melt runoff and river height forecasting, and avalanche control and avalanche risk forecasting. Snowpacks also have a big impact on weather and climate by virtue of their high reflectivity and thermally insulating properties, on ecosystems, groundwater uptake, civil and defense trafficability, and heating/cooling needs. Snowpack runoff supplies a large fraction (up to ~80 percent) of the year-round freshwater needs for agricultural and municipal use. Radar imagery from polarimetric SARs or scatterometers operating from the L-band to the Ku-band provide the ability to measure snow over a broad area. Radar sounders operating at the Ku-band have been able to measure snow depth and stratigraphy over ice sheets.10 In addition to being able to make all-weather measurements through clouds, microwave sensors are able to penetrate into the snow, and thus yield information about snow density, which is directly related to the amount of liquid water produced upon melting. In
___________
9 D.L. Galloway, K.W. Hudnut, S.E. Ingebritsen, S.P. Phillips, G. Peltzer, F. Rogez, and P.A. Rosen, Detection of aquifer system compaction and land subsidence using interferometric synthetic aperture radar, Antelope Valley, Mohave Desert, California, Water Resources Research 34(10):2573-2585, October 1998.
10 ESA, CoReH2O: An Earth Explorer to Observe Snow and Ice, Report for Mission Selection, European Space Agency Productions, Paris, France, 2012.
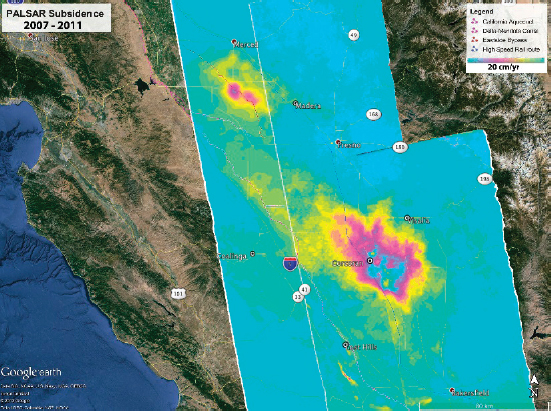
FIGURE 4.5 Subsidence rates in California’s southern Central Valley from 2007 to 2011 as measured by Japan’s Advanced Land Observing Satellite SAR instrument using repeat-pass interferometry. One full cycle of the color bar equals 20 cm (about 8 in,) per year. NASA is using space-based radar data to monitor groundwater in California. SOURCE: NASA/JPL-Caltech/JAXA/Google Earth, “NASA Responds to California’s Evolving Drought,” News, February 25, 2014, http://www.jpl.nasa.gov/news/news.php?feature=4057.
addition to sensors already operating, the NRC Earth science decadal survey has called for the development of a dedicated space mission to address snow.11
The Cryosphere
The cryosphere covers portions of Earth’s surface where water is in solid form, including sea ice, ice sheets, and glaciers. Diminishing glaciers and sea ice are considered by scientists to be an early indicator of global warming. Satellite observations collected over the past three decades show that the summer sea ice
___________
11 National Research Council, Earth Science and Applications from Space, 2007.
cover is decreasing drastically, and ice sheets and glaciers are already melting fast enough to be the largest contributors to sea level rise, with a potential to raise sea level by several tens of centimeters or more in the coming century. The loss of sea ice cover will have a profound effect on life, climate, and commercial activities in the Arctic, while the loss of land ice will impact an important source of water for millions of people. Collectively, these effects mean that despite its remote location, changes in ice have global economic and health implications as climate changes. Accurate projection of the sea level would improve planning of sea walls, dikes, and other mitigation strategies. Largely because of its remote locations and its persistent cloud cover and lack of winter sunlight, active microwave sensors have become a key means of monitoring the cryosphere.
Sea Ice
Due to the strong contrast between backscatter over open water and over sea ice, SARs operating at the L-, C-, and X-bands are especially useful for tracking sea ice floes and estimating the extent and age of the sea ice cover. Radars are particularly adept at differentiating first year ice from multi-year ice conglomerations.12 End-user applications include monitoring shipping lanes at high latitudes and studying polar climate change, using, for example, the RadarSat or EnviSat series of C-band spaceborne SARs or at the L-band using the Japanese ALOS PALSAR. Combining sea ice extent mapping with radar altimetry provides a means for determining sea ice elevation—also known as freeboard height—and, in turn, sea ice thickness. Sea ice freeboard has been measured using the Cryosat-2 radar altimeter at the Ku-band (Figure 4.6).
Ice Sheets and Glaciers
Earth’s two great permanent ice sheets lie over Antarctica and Greenland. The “mass balance” of these ice sheets is the extent to which they are either losing or accumulating new ice. Radar altimeters, such as Cryosat-2, monitor the overall thickness of the ice sheet. The movement and melting of glaciers is the key mechanism for ice sheet mass loss. SAR can not only image the extent of glaciers but can also determine flow speeds of glacier ice by feature tracking over time or by detecting movement directly with repeat-pass interferometry.13 The penetrative capability of low-frequency radar sounders is utilized to probe the vertical structure of glaciers and ice sheets all the way down to the solid rock base. The
___________
12 W. Dierking, Sea ice monitoring by synthetic aperture radar, Oceanography 26(2):100-111, 2013.
13 I. Joughin, B.E. Smith, and W. Abdalati, Glaciological advances made with interferometric synthetic aperture radar, Journal of Glaciology 56(200):1026-1042, 2010.
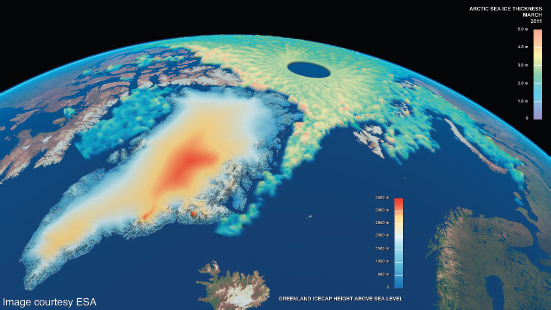
FIGURE 4.6 This map shows Arctic sea ice thickness, as well as the elevation of the Greenland ice sheet, for March 2011. The data come from the European Space Agency CryoSat-2 satellite utilizing a Ku-band altimeter. For the sea ice, green shades indicate thinner ice, while the yellows and oranges indicate thicker ice. SOURCE: Courtesy of Planetary Visions/CPOM/UCL/ESA.
basal structure of glaciers is key to understanding how glaciers move and how the melting mechanisms function. Scatterometers, with their wide area coverage and frequent revisit time, can catch the presence of rapid surface melt events on ice sheets. Finally, gravity field measurements made using satellite-to-satellite radio ranging can yield critical insight into the bulk mass dynamics associated with Earth’s ice sheets.
Topographic Mapping
Accurate topographic maps of Earth’s surface are essential to many terrestrial science investigations and civil applications. These include watershed delineation for hydrological studies and flood risk mapping, public works planning, forestry and timber management, natural resource exploration, and national security. Interferometric SAR provides a means to generate highly accurate digital elevation models (DEMs) under all weather and lighting conditions.14 Using this technique,
___________
14 P. Rosen, S. Hensley, I.R. Joughin, F.K. Li, S.N. Madsen, E. Rodriguez, and R.M. Goldstein, Synthetic aperture radar interferometry, Proceedings of the IEEE 88(3), 2000.
multiple SAR images are acquired from two antennas separated in space but as simultaneous as possible. The observed phase difference between these two images is utilized to calculate the vertical height at each point in the scene.
The Shuttle Radar Topography Mission (SRTM) utilized a dual-antenna C-band interferometer that flew aboard the space shuttle Endeavor in February 2000. SRTM generated elevation data on a near-global scale and have become widely used by many different research communities. Whereas SRTM utilized two antennas separated by a baseline flying on the same platform, spaceborne DEM work has continued, with free-flying antennas on individual satellites. An example is the DLR X-band TerraSAR-X and TanDEM-X satellites flying in formation (Figure 4.7). These satellites have achieved a global height precision of 2 m at horizontal spacing of approximately 12 m. Airborne SAR interferometers also continue to generate DEMs for special targets at a local and regional scale. The Fugro Earthdata GeoSAR system is dual sided and has a single-pass X-band interferometer and a single-pass UHF interferometer operating simultaneously for two-frequency, two-sided data collection. In vegetated areas, the UHF data can penetrate to near the surface to get ground-level topography, whereas the X-band sensor yields heights higher up in the canopy.
Other Applications: Urban Planning, Disaster Management
The availability of high-resolution SAR imagery has enabled advances in urban planning and land-use management efforts. Information on land use and land cover is an important element in formulating policies on economic, demographic, and environmental issues at the national, regional, and global levels. Mapping land use near the borders of urban areas in a timely and accurate manner is thus of great importance for urban planning, land-use planning, and conservation and management of land resources.15
In addition to earthquakes and volcanoes, discussed in the Introduction, SAR interferometry is being used to measure deformation and predict the hazards associated with sinkholes and manmade levies and dams. Regardless of the cause, once a disaster occurs, it is imperative that the extent of the damage be quickly evaluated so that relief efforts can proceed in the most efficient fashion. Again, SAR repeat-pass measurements offer a unique capability to assess the extent of destruction from earthquakes, tsunamis, hurricanes, and floods.16 When two successive radar images
___________
15 J. Manoj, S.R. Subramoniam, K.S. Srinivasan, S. Pathak, and J.R. Sharma, Class separability analysis and classifier comparison using quad-polarization radar imagery, Journal of the Indian Society of Remote Sensing 41(1):177-182, 2013.
16 R.J. Dekker, High resolution radar damage assessment after the earthquake in Haiti on 12 January 2010, IEEE Journal of Selected Topics in Applied Earth Observations and Remote Sensing 4(4), 2011.
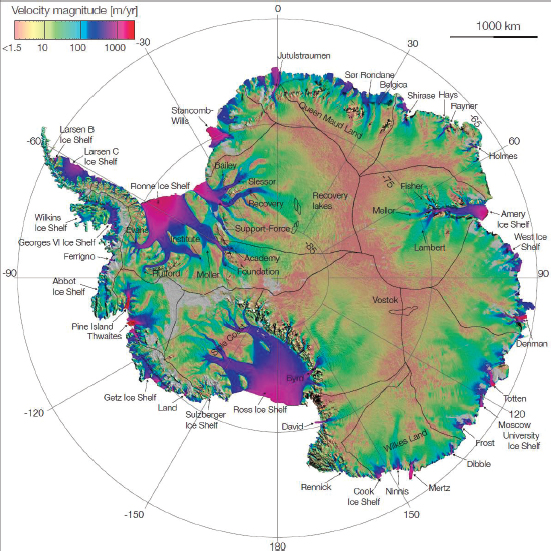
FIGURE 4.7 Velocity of ice flow in Antarctica, derived from radar interferometric data from JAXA’s ALOS PALSAR, ESA’s Envisat ASAR and ERS-1/2, and CSA’s RADARSAT-2 spacecraft. The black lines delineate major ice divides. The grey areas indicate regions where no data was taken. SOURCE: E. Rignot, J. Mouginot, and B. Scheuchl, “MEaSUREs InSAR-Based Antarctica Ice Velocity Map,” Sample Data Image, NASA DAAC, National Snow and Ice Data Center, Boulder, Colo., 2011, http://dx.doi.org/10.5067/MEASURES/CRYOSPHERE/nsidc-0484.001. See J. Mouginot, B. Scheuchl, and E. Rignot, Ice flow of the Antarctic ice sheet, Science 333(6048):1427-1430, 2011.
of the impacted zone are compared—one before the disaster and the other collected as soon after the disaster as possible—change detection algorithms can be applied to identify such events as collapsed structures or inundated areas. Assessments have been successfully employed for several high-profile recent disasters using a variety of spaceborne SAR assets, including the Christchurch, New Zealand, earthquake in
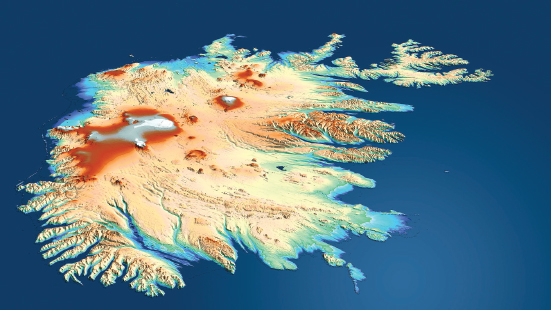
FIGURE 4.8 TanDEM-X topographic mosaic map of Iceland. SOURCE: Courtesy of DLR (The German Space Center); “A Step Closer to Mapping the Earth in 3D,” News, January 13, 2012, http://www.dlr.de/dlr/en/desktopdefault.aspx/tabid-10081/year-2012/.
2011, the Tohoku, Japan, earthquake and tsunami in 2011, superstorm Sandy on the U.S. East Coast in 2012, and super-typhoon Hainan in the Philippines in 2013.
As examples, the analyses shown in Figures 4.2 and 4.5 demonstrate how non-U.S. assets were utilized to address land surface processes of intense interest within the borders of the United States; Figures 4.8 and 4.9 indicate how U.S. capabilities are being combined with data from non-U.S. programs to address global concerns.
SPECTRUM ISSUES FOR MICROWAVE REMOTE SENSING OF THE LAND SURFACE
For the broad variety of applications discussed in the earlier sections of this chapter, microwave remote sensing of the land surface requires the use of a wide range of frequencies. The HF, VHF, UHF, L-, S-, C-, X-, Ku-, and Ka-bands are all currently in use. Cases where scientists have either had difficulty accessing bands due to transmit restrictions or experienced extreme interference due to other radio services are discussed in detail in Chapter 7. For researchers involved in land remote sensing, the main spectrum issues may be summarized as follows:
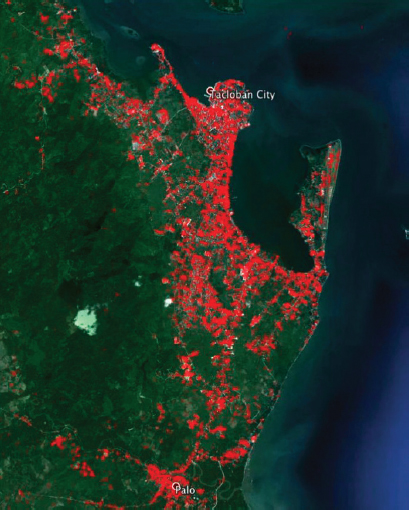
FIGURE 4.9 Interferometric “change map” derived from Italian Space Agency Cosmo-Skymed radar depicting damage done by Supertyphoon Haiyan in the Philippines, November 8, 2013. Areas in red reflect the heaviest damage to cities and towns in the storm’s path. SOURCE: ASI/NASA/JPL-Caltech. See NASA, “NASA Damage Map Helps in Typhoon Disaster Response,” November 13, 2013, http://www.nasa.gov/centers/jpl/news/typhoon20131113.html#.VZ15xvlVhBf.
- There is currently no HF or VHF spectrum allocation for Earth science remote sensing from space. This will be a region of intense interest for subsurface sounders in the future.
- There is a UHF allocation for spaceborne remote sensing, but it is a secondary allocation. This is proving to be a difficult band to use due to transmit restrictions. The ESA BIOMASS mission, which will operate at the UHF band, has been denied permission to radiate over much of North America and Europe because of perceived interference with the U.S. Department of
-
Defense’s (DOD’s) Space Object Tracking Radar (SOTR) system. Wider-band airborne instruments operating at the UHF band apply to use radiolocation bands but are also subject to severe geographical and spectral restrictions.
- There has been increased incidence of RFI at the L-band over the last decade. This has spawned the development of interference mitigation techniques, which are thus far successful. Transmit restrictions have also increased at the L-band, occasionally resulting in requirements for expensive design features.
- There is a strong concern that new commercial Radio Local Access Network (RLAN) services proposed by industry at the C-band will severely impact current and planned SAR systems operating in that region of the spectrum.
- Non-radar techniques—such as satellite-to-satellite radio ranging for gravity field measurements and differential GPS for the detection of surface motion—are also susceptible to spectrum concerns such as RFI. In 2011, many in the Earth science community (along with other users) weighed in heavily against a broadband service proposal that threatened to cause significant interference in the GPS spectrum. From a regulatory perspective, these techniques may occupy a gray area between Earth remote sensing and radiolocation, but they nevertheless represent key measurements that warrant vigilance from the science community.
Radar measurement techniques are always advancing in order to meet growing science needs. In general, the more bandwidth a radar transmits, the better the spatial resolution and accuracy associated with the land surface phenomena being measured. An explicit proposal for an expansion of the X-band allocation is expected at the ITU World Radiocommunication Conference in late 2015. Bandwidth expansions of the allocations at several other bands are also being explored.
Finding 4.1: Radar remote sensing of the global environment is becoming an increasingly international collaborative endeavor. Data from each country’s programs are being used by other countries’ scientists in order to address regional and global issues.
Finding 4.2: Active microwave remote sensing of the land has proven valuable across a number of science disciplines and practical applications, including geology, urban planning, agriculture and crop management, forestry and biomass assessment, hydrology and water resource management, weather forecasting, generation
of topographic maps, sea ice mapping and glacier studies, earthquake and volcano studies, archaeological investigations, and postdisaster assessment.
Recommendation 4.1: The Office of Science and Technology Policy should adjudicate the possibility of time and frequency sharing between ESA BIOMASS and the U.S. DOD SOTR system.
Recommendation 4.2: Spectrum usage by active airborne remote sensing platforms and airborne test beds is inherently very sparse in both time and space, amounting to a few dozen to a few hundred hours of on-time per year, with the maximal spatial extent typically less than 50 km from the illumination point. Special consideration should be given to accommodating these few but important low usage systems.
Recommendation 4.3: The current frequency allocations for active remote sensing for land applications should be preserved and strongly protected to ensure their continued contribution to the nation and to scientists’ understanding of Earth and its processes.


