
5
Institutional, State, and National Policies
Institutional, state, and national policies can become significant barriers for students as they follow complex pathways to earn STEM credentials (including degrees and certificates). Given the current pattern of frequent transferring between institutions and in earning credits at multiple institutions (either at the same time or sequentially; Hossler et al., 2012), policies
related to transferring credits are key factors in students’ progress toward a credential. Related to this factor is the cost of earning a credential. In this chapter, we discuss the institutional and systemic factors that affect transfer policies and costs.
Since transfer policies and degree costs are connected to institutional, state, and national policies and practices that affect all students, not just those in STEM fields, this chapter includes discussion of the broader policy context. When data are available, we discuss STEM-specific aspects of transfer and degree cost and the role that STEM departments can play in addressing issues related to these policies.
BARRIERS ASSOCIATED WITH TRANSFERRING
An undergraduate’s likelihood of completing a bachelor’s degree is much lower if the student begins at a community college than at a 4-year institution (Alfonso, 2006; Monaghan and Attewell, 2014; Reynolds, 2012; Reynolds and DesJardins, 2009; Stephan et al., 2009). Many academically qualified students in community colleges who intend to transfer and earn a bachelor’s degree never do so. Although there is limited evidence about what prevents students from transferring, contributing factors may be lack of appropriate advice, conflicting personal commitments, and geographic accessibility (Monaghan and Attewell, 2014). However, those community college students who are able to transfer to 4-year institutions are just as likely to complete a bachelor’s degree as students who initially enrolled at 4-year institutions (Melguizo et al., 2011). Some of this difference in bachelor’s degree attainment by students who first enroll in a community college is due to the entry characteristics of community college students, including academic preparation, socioeconomic status, demographic background, and levels of parental education. The increased likelihood of part-time status at a community college also negatively affects graduation rates (The College Board, 2014).
The difference in degree completion rates between students who start at a community college and those who start at a 4-year institution has repercussions with respect to the goal of increasing the diversity of college graduates. Until this difference is reduced, it may be difficult to increase the representation of underrepresented minority groups and those from low-income families among college graduates, as these student groups are more likely to enroll at a community college (Bozick and Lauff, 2007; National Center for Public Policy and Higher Education, 2011). Looking at enrolled postsecondary students in 2012, 46 percent of Hispanic, 41 percent of American Indian/Alaska Native, and 35 percent of black college students were enrolled at a community college in comparison with 31 percent of white students (National Center for Education Statistics, 2013).
Similarly, students who reverse transfer, from 4-year to 2-year institutions, are less likely to earn a bachelor’s degree than those who transfer to another 4-year institution: only 22 percent of reverse transfer students earn a bachelor’s degree within 8 years of their initial enrollment. Reverse transfer is most common among students who struggled academically in their first year and those whose parents have less education than otherwise comparable students (Goldrick-Rab, 2006).
“Transfer shock” is the term coined in the mid-1960s (Hills, 1965) to refer to the tendency for there to be a temporary dip (typically only lasting one semester) in the grade point averages of students who transfer—a trend that still exists today. There is no clear single reason for the dip. Some early research (e.g., Townsend, 1995) pointed to the tendency for transfer students to seek support from friends and family, rather than from on-campus support services. They also proposed that transfer students often find the 4-year institution to have higher academic standards, be faster paced, and require a greater amount of writing than did their community colleges (Townsend, 1995). Other researchers (Holahan et al., 1983; Laanan, 1996, 1998) have linked transfer students’ difficulties adjusting to the academic standards of 4-year institutions to institutional differences in size, location, academic rigor, and competition among students. Other studies have looked at social and psychological factors that might contribute to transfer shock. In a review of the literature on transfer shock, Laanan (2001) points to differences in campus climate and the accessibility of faculty.
The intertwined effects of time to degree and cost of degree also contribute to lower completion rates for transfer students. The longer students extend their enrollment in college beyond their expected graduation date (i.e., beyond 4 years for a 4-year degree), the lower are the odds that they will graduate (Complete College America, 2011). Monaghan and Attwell (2014) found that many students transferring from community colleges lose credits because the credits are not approved by the 4-year institution. In their study sample, 14 percent of transfer students had less than 10 percent of their credits accepted, and only 58 percent of transfer students had more than 90 percent of their credits accepted. As the percentage of community college credits transferred increased, the likelihood of attaining a bachelor’s degree also increased (Monaghan and Attewell, 2014). In a separate study, Doyle (2006) found that when 4-year institutions accepted all of the community college credits, 87 percent of transfer students earned a bachelor’s degree. In addition, this study found that when many credits, but not all were accepted, the percentage of transfer students who earned a degree in the same amount of time dropped to 42 percent.
Institutions may be hesitant to accept transfer credits for a number of reasons. They may question the rigor of the coursework at the institution from which the credit is being transferred, and they may question the level
of alignment between the content of courses across institutions. In addition, institutions have begun to question how many credits a student needs at one institution to earn a degree. For example, should students who complete their degree requirements from university X, while only earning 40 percent (or less) of their credits from that university, be granted a degree from university X? What does it then mean to earn a degree from university X? However, even acceptance of transfer credit does not necessarily translate into fewer credits needed to earn a degree. Degree requirements typically include courses in three categories: (1) general education, (2) courses specific to a major, and (3) elective credits. If transfer credits are classified as elective and exceed the credit requirements, then the additional credits will not contribute to the degree and are effectively lost, even though they have transferred. It has been estimated that the cost of credits that do not advance students toward their degrees is over $7 billion per year (Smith, 2010).
TRANSFER POLICIES AND THEIR EFFECTS
Most colleges and universities are accredited by one of the seven U.S. regional accreditors of higher education; a process requires them to demonstrate compliance with standards that include published and implemented policies, procedures, and criteria regarding transfer credit and credit for extra-institutional college-level learning. Accreditation is required in order for a college’s students to be eligible for federal financial aid. Articulation agreements are a mechanism for formalizing a college’s transfer credit policies and are often designed to create a clear pathway for transfer, promote appropriate preparation for future academic work, encourage vertical transfer (from 2-year to 4-year institutions), and maximize credits transferred, among other goals.1 As of 2014, only five states rely solely on institutional policies for articulation—Delaware, Iowa, Michigan, Vermont, and Wyoming. The other 45 states have some statewide and systemwide transfer policies, although they vary greatly (Western Interstate Commission for Higher Education, 2014).
The number of states with transfer policies has been steadily increasing over the last few decades. In 1991, only 12 states had adopted statewide policies (Anderson et al., 2006); by 1999, the number had increased to 34 (Goldhaber et al., 2008). As shown in Figure 5-1, by 2010, over 35 states had developed formal statewide transfer policies. These policies can take the form of laws, or legislative recommendations, or they can be set by state boards (Western Interstate Commission for Higher Education,
__________________
1 Articulation (or course articulation) is the comparison of courses between institutions in order to determine their equivalency for purposes of transfer credit.
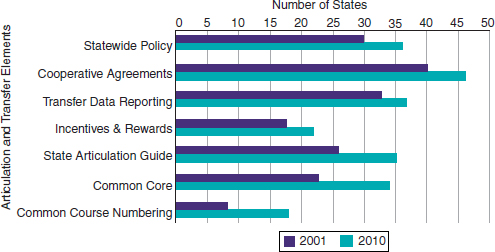
SOURCE: Mullin (2012, Figure 1).
2014). Components often include a common core of general education requirements, common major-specific courses, common course numbering systems, guaranteed junior status for students who earned a 2-year degree from a community college, online access to transfer and degree program information, upper limits on the number of required credits for associate or baccalaureate degrees, and guaranteed or priority admission for transfer students (Kisker et al., 2011). Transfer equivalents are determined on a course-by-course basis or based on common learning outcomes.
Early studies of the relationship between transfer policies and student aspirations and outcomes failed to reach conclusive results (Roksa, 2009; Roksa and Keith, 2008). Goldhaber and colleagues (2008) found a positive, but inconsistent correlation between stronger transfer policies and increases in community college students’ educational aspirations and in the number of students transferring from 2-year to 4-year institutions. However, they did not consistently find that the states with statewide policies or stronger policy elements had the highest share of community college students aspiring to a 4-year degree. In a subsequent analysis, Gross and Goldhaber (2009) failed to find that any stronger policy elements had statistically significant effects on the likelihood of 2-year students earning a bachelor’s degree.
A recent study found that the higher students’ educational aspirations were, the more likely they were to earn a bachelor’s degree (Monaghan and Attewell, 2014). This study also found that the percentage of students who earned a 4-year degree was slightly higher in states with transfer
agreements than in those without (56% and 51%, respectively). Similarly, among students who reverse transferred, more earned an associate’s degree in states with formal agreements than in states without (22% and 16%, respectively).2
A review of statewide or systemwide policies (Kisker et al., 2011) considered seven elements in four states: Arizona, New Jersey, Ohio, and Washington:
- a common general education core curriculum,
- common lower-division courses in the major,
- a focus on credit applicability,
- junior status upon transfer for associate’s degree recipients,
- guaranteed or priority admission,
- limits on credit requirements for both associate’s and bachelor’s degrees, and
- an acceptance policy for upper-division courses that results in what is referred to as transfer associate’s degrees.
The authors concluded that the first four elements were critical for beneficial student outcomes in those states.
Community college students in those states had greater flexibility and options than in other states. Transferring to any of the participating colleges within the same degree program was easier for students than when articulation agreements were reached on an institution-to-institution basis. Transfer rates improved in Ohio and Washington. In Ohio, vertical transfers increased by 21 percent between 2002 (the year before common lower-division premajor and early major pathways were first introduced) and 2009, while enrollment only grew by 7 percent.
In addition, the review revealed that policies in Arizona and Ohio were associated with increases in community college students’ preparation for upper-division work. For example, in Arizona, students who completed either the state’s 35-credit general education common core (called the Arizona General Education Curriculum) or a full transfer associate’s degree prior to transfer had significantly higher grade point averages after two and four semesters at the 4-year institution in comparison with students who transferred without completion of either a degree or the general education common core.
Degree completion rates increased in Ohio and Washington, particu-
__________________
2 For their study, Monaghan and Attewell (2014) used data from the National Education Longitudinal Survey, 1988–2000 (NELS88/2000) with the NELS 2000 follow-up and the 1999 Survey of State-Level Transfer and Articulation Policies conducted by Ignash and Townsend (2001).
larly for underrepresented groups. For example, Hispanic students in Washington who participated in the transfer associate’s degree programs had a particularly high rate of 93 percent. In Arizona and Washington, the time to degree was reduced. In Washington State, students with transfer associate’s degrees in science or engineering earned a bachelor’s degree with 6 fewer credits than those who completed only the general education common core, and with 49 fewer credits than students who had completed a technical or more traditional associate’s degree before transferring. Finally, a separate analysis by the Ohio Board of Regents (Mustafa et al., 2010) found that transfer activities saved the state $20 million per year, of which $7 million was attributed to transfer associate’s degrees.
The available research indicates that statewide transfer policies, including a common general education core and transfer associate’s degrees, represent an opportunity for increasing the number of students who complete degrees at 4-year institutions and for other positive outcomes as well. A roadmap of sorts is thus available to policy makers in other states who wish to pursue programs to help transfer students and save money.
Recently, some regional accreditors have permitted a competency-based model for earning college credits. The Council of Regional Accrediting Commissions (2015) issued a common framework for defining and accrediting competency-based education.3 Some states and institutions believe the process of transferring credits could be improved by shifting to a model of learning outcomes or student competencies. For example, if a 4-year institution finds that a course completed by a community college student is missing a minor, required component, the student could complete a short learning module and an assessment to demonstrate knowledge of this missing competency. This competency-based approach could help reduce a student’s time to degree and cost of degree by avoiding repetition of a course in which most of the material has already been mastered. More evidence on competency-based models is needed in order to ascertain the impact on transferring credits and degree completion.
As described in Chapter 3, the departmental environment can play an important role in the experiences of students in STEM majors. Not only can departments influence faculty reward systems, course sequence, teaching practices, and departmental culture, but they can also have an effect on transfer policies. While statewide transfer policies and support structures can promote the transfer of credits (see below), departmental leaders ultimately decide on whether or not to accept transfer credits in a discipline (Austin, 2011). In making these decisions, a focus on course learning outcomes, rather than strictly on content coverage, can increase the number
__________________
3 See https://www.insidehighered.com/sites/default/server_files/files/C-RAC%20CBE%20Statement%20Press%20Release%206_2.pdf [October 2015].
of credits accepted for transfer. One challenge is to engage faculty at 4-year institutions in the process, since some think community college students should find their own paths into the disciplinary major at the 4-year institution. The department chair can play an important role in involving faculty members to actively help transfer students (Parker et al., 2014).
Some departments are redesigning academic programs and student services to create more structured paths designed to guide students to transfer with junior standing in their majors—and earn an associate’s degree along the way: see Box 5-1 for an example.
INSTITUTIONAL PROGRAMS TO FACILITATE TRANSFERS AND ASSIST STEM STUDENTS
Although most professionals in higher education would agree that forging partnerships between 2-year and 4-year institutions is valuable to smooth the transition for transfer students and enhance their opportunities for success are important goals, actual implementation may prove challenging. Challenges include the different cultures and missions of 2-year and 4-year colleges, perceived competition for students, and geographic separation. When they are successfully established, such partnerships often create articulation agreements, and coordinate a wide range of activities, including advisements; opportunities for community college students to take courses, attend seminars, perform undergraduate research, and otherwise participate in activities at the 4-year institution; arranging for the 4-year institution to
offer classes on the campus of the 2-year institution; and even satellite campuses, where a 4-year institution offers degrees and has permanent faculty and staff located on the campus of the 2-year institution.
The College Board (2011), based on interviews of 21 campus leaders from 12 4-year institutions, recommended that institutions should recognize and embrace the contributions that transfer students make to their educational, economic, and cultural diversity and include support of transfer students in their strategic plans. While recognizing that the needs of transfer students are somewhat different than those of first-year students, the College Board (2011) study encouraged 4-year institutions to provide transfer students with the kind of dedicated support that they typically give to first-year students. That support could include outreach prior to admission to promote better preparation for upper-level study and to create a clear transfer pathway; aligning the curricula; dedicating financial aid to transfer students; and offering a dedicated transfer orientation. The report also encouraged 4-year institutions to make work-study positions available to transfer students.
One example of a college that is taking steps to smooth the transfer process is the Onondaga Community College Regional Higher Education Center in New York, which hosts numerous colleges offering bachelor’s and master’s degree programs.4 Some of the 4-year colleges that partner with Onondaga Community College offer joint degree programs. These programs allow community college students to simultaneously enroll in an associate’s degree and a bachelor’s degree program, and once they complete their associate’s degree, they attend the 4-year institution. One example is a dual-joint degree program between the John Jay College of Criminal Justice and Queensborough Community College, which offer joint registration and dual admission.5
Another model is the dual degree program. One example is the partnership between Governors State University and eight community colleges in the Chicago area. This dual degree program, which enrolled its first cohort in spring 2011, requires students to complete their associate’s degrees, attend college full-time, maintain good academic standing, meet regularly with community college and university advisors, and finish both the associate’s and bachelor’s degrees in no more than nine semesters. Community college students are eligible for guaranteed admission at Governors State University, where they receive academic support and financial incentives.6
__________________
4 For more details, see http://www.sunyocc.edu/index.aspx?menu=851&collgrid=510&id= 29053 [April 2015].
5 See http://www.qcc.cuny.edu/socialSciences/criminalJustice.html [April 2015].
6 See http://www.govst.edu/Academics/Degree_Programs_and_Certifications/Dual_Degree_Program/ [April 2015].
Alliances between community colleges and research universities can also enhance the availability and quality of research experiences for students at community colleges Shaffer et al., 2010; Wei and Woodin, 2011): for an example, see Box 5-2.
FEDERAL AND STATE PROGRAMS TO FACILITATE TRANSFRS AND ASSIST STEM STUDENTS
There are a number of federal and state programs that support efforts to promote the success of STEM students who transfer among institutions. For example, the National Science Foundation’s S-STEM program supports an innovative transfer program at Texas A&M University (see Box 5-3 for more details). Collaborations were supported by the Career Pathways Innovation Fund of the U.S. Department of Labor (DOL)7 and through expansion of the mission of the DOL’s Trade Adjustment Assistance Community College and Career Training initiative (TAACCCT).8 These DOL programs encouraged partnerships between community and technical colleges and employers in the private sector to develop scientific research and engineering design exchanges across 2-year and 4-year institutions. TAACCCT
__________________
7 See http://www.doleta.gov/grants/pdf/sga-dfa-py-10-06.pdf [April 2015].
8 See http://www.doleta.gov/taaccct/ [April 2015].
grants (awarded from 2011 to 2014) supported a broad set of reforms to improve the infrastructure of community college workforce programs. Many grantees decided to drive reform by improving career pathways including better transfer arrangements. The President’s fiscal 2015 budget proposed to establish a Community College Job-Driven Training Fund as a successor to TAACCCT.
Similarly, an important element of the Advanced Technological Education (ATE) Program9 of the National Science Foundation (NSF) is the development of partnerships between 2-year and 4-year colleges—as well as among secondary schools, with some combination of businesses, industry, and governments—in order to train technicians to meet current and future workplace needs. In 2012, ATE projects and centers supported development of articulation agreements that helped 2,410 students transfer between 2-year and 4-year institutions. The NSF’s Louis Stokes Alliances
__________________
9 See http://www.nsf.gov/funding/pgm_summ.jsp?pims_id=5464 [April 2015].
for Minority Participation Bridge to the Baccalaureate Alliances10 Program also supports connections between 2-year and 4-year institutions in order to accelerate the transfer of underrepresented minority STEM degree aspirants to 4-year institutions.
The National Institute of Health’s Bridges to the Baccalaureate (BTB) Program is designed to enhance the pool of community college students from underrepresented groups in biomedical and behavioral sciences, with the hope that some of them will go on to research careers in these fields. The program supports implementation of integrated plans to increase community college students’ preparation, motivation, and skills and to increase the pool of students who successfully transition from 2-year to 4-year institutions and graduate.
The University of California and the California State University systems have a long-standing program, Mathematics, Engineering, Science Achievement,11 which creates partnerships between 2-year and 4-year campuses to align curricula and prepare students for the transition to bachelor’s degree programs in STEM disciplines. Some other large state systems have similar programs.
There are also programs designed specifically for veterans. A recent study by the American Council on Education (2014) found that veterans currently represent about 4 percent of all undergraduates. Of those veterans, 38 percent attend 2-year public institutions, 23 percent attend private for-profit institutions, 19 percent attend 4-year public institutions, and 10 percent attend private nonprofit institutions. Of these veterans, 42 percent work full time, and 20 percent are in STEM programs (American Council on Education, 2014).
Approximately 5 million post-9/11 service members are expected to transfer out of the military by 2020, many of whom will be covered by the Veterans Educational Assistance Act of 2008 (P.L. 110-252, H.R. 2642). The law specifies that veterans who will have served at least 36 months since September 11, 2001, may receive 100 percent payment for up to 36 months for either all resident tuition and fees for a public college or university or the lower of the actual tuition and fees or the national maximum per academic year for a private college or university. The percentage payment is proportionally lower for shorter military service. One concern about the program is its maximum length of only 36 months, given the small percentage of students who typically complete a 2-year or 4-year degree on time (see Chapter 2).
__________________
10 See http://www.nsf.gov/publications/pub_summ.jsp?ods_key=nsf12564 [April 2015].
11 See http://mesa.ucop.edu/ [April 2015].
PRICE AND COST OF DEGREES
As noted above, barriers to transferring can extend the time to earn a bachelor’s degree, thus extending its direct cost to students. Whether related to transfer or not, the cost of earning a degree is another issue that affects all undergraduate students, including those aspiring to earn a STEM degree.
In this section, we describe what is known and not known about the price students pay for STEM degrees relative to other degrees; the cost of delivering STEM degrees relative to non-STEM degrees; and the extent to which differences in tuition price between STEM and non-STEM fields affect demand for STEM majors or completion of STEM degrees. When data are available, these topics are examined for underrepresented minority groups in STEM fields (Hispanics, blacks, Native Americans), and women and for students from low-income families. We begin with a brief discussion of student debt, which is closely related to issues of college costs and prices and provides a context for the rest of the section.
Student Loans and Debt
The percentage of students receiving Pell Grants, which are need-based grants to low-income undergraduate and certain students working on higher degrees, has increased in recent years: it was 25 percent in 2007–2008 and 36 percent in 2012–2013 (The College Board, 2014).
Unfortunately, the students most in need of financial aid may not get it, partly because they do not complete the documentation needed to receive aid in a timely fashion. Recent research in the Chicago Public Schools showed a strong positive correlation between completing the Federal Application for Free Student Aid (FAFSA) and college attendance (Feeney and Heroff, 2013). Using the Illinois Monetary Award Program as a case study, the study found that three student characteristics were related to timely completion of FAFSA: (1) having a slightly higher-than-expected family contribution; (2) having at least one parent who attended college; and (3) demonstrating higher academic performance in high school.
Students who need financial aid can lose their eligibility because they exceed the maximum amount of time to degree completion allowed by the program or because they do not take enough credits to qualify for the program. Students in remedial courses (for which college credits are not awarded) or who transfer are more likely to become ineligible. Student debt has increased significantly over 10 years, even with more students receiving financial aid (The College Board, 2014). For graduates of public 4-year colleges, average debt increased by 12 percent between 2001–2002 and 2006–2007 (from $10,600 to $11,900 in 2012 dollars) and by an additional 20 percent over the next 5 years, to 2011–2012 (from $11,900
to $14,300 in 2012 dollars). For graduates of private nonprofit 4-year colleges, average debt increased by 23 percent between 2001–2002 and 2006–2007 (from $15,400 to $19,000) and by an additional 3 percent over the next 5 years, to 2011–2012 (from $19,000 to $19,500). About 60 percent of students who earned bachelor’s degrees in 2011–2012 from public and private nonprofit institutions graduated with debt. These students borrowed an average of $26,500 (The College Board, 2014).
Students with the greatest financial needs have lower rates of degree completion than other students. This is not necessarily a causal relationship, as factors other than finances (i.e., anxiety over financial aid, precollege preparation) may contribute to completion or noncompletion. More research is needed to clarify the relationship among financial need, degree completion, and other related factors.
Price to the Student of a Degree
Determining and evaluating the price to the student of a college education are complex due to variations in costs across institution types, across states, and sometimes even within institutions (due to differential tuition, discussed below). The net price to the student of a college education depends in part on institutional fees, room and board costs, time to degree, number of credits required, and financial aid received.
A significant contributor to rising debt is the increasing price of college since 1999, both absolutely and relative to other costs (Kirshstein, 2013a; see Figure 5-2). The price of a bachelor’s degree has increased faster than the rate of inflation, in part due to rising tuition rates. For the 5-year period between 2008–2009 and 2013–2014, the average annual tuition and fees at public 4-year institutions increased 19 percent; for private nonprofit 4-year institutions, the increase was 14 percent. Accompanying the increase in tuition and fees has been an increase in borrowing—a 9 percent growth in total annual educational borrowing between 2007–2008 and 2012–2013.
Policy makers’ attention has increasingly focused on the cost of higher education and ways to reduce it. The most ambitious approach is in Tennessee, which enacted the “Tennessee Promise” in 2014, a statewide initiative to provide free community college scholarships and mentoring to all high school graduates. The initiative covers tuition costs and fees not met by existing scholarship programs.12 More broadly, President Obama has issued a call to make community college free across the nation.13
__________________
12 For more information on Tennessee Promise, see http://driveto55.org/initiatives/tennesseepromise/ [June 2015].
13 For details on the President’s proposal, see https://www.whitehouse.gov/blog/2015/01/08/president-proposes-make-community-college-free-responsible-students-2-years [June 2015].
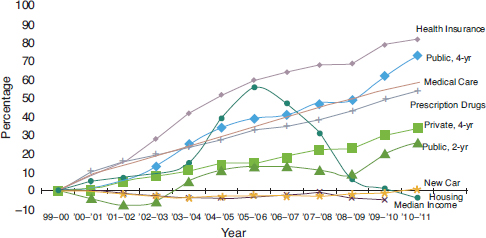
SOURCE: Kirshstein (2013a, p. 2).
The calculated price of a degree varies, depending on such factors as in-state residency (for public institutions), the numbers of credit hours, and range of expenses considered (e.g., tuition and fees, room and board). To facilitate comparing information across available studies, the main focus here is the price of in-state tuition and fees for undergraduates enrolled full time at public institutions (or the price of tuition and fees for full-time undergraduates at private institutions), who have completed or are near completing a bachelor’s degree at a public or private institution.
The net price of a degree matters the most for college access and affordability. The net price is the price actually paid by individual students minus the amount of financial assistance received in the form of grants and tax credits. In 2012–2013, undergraduate students as a whole received $185.1 billion in financial aid (The College Board, 2013). Students received 52 percent of this funding in the form of grants, 39 percent as loans (including nonfederal loans), and 9 percent in a combination of tax credits or deductions and Federal Work Study grants.
Price to the Student of a STEM Degree
As shown in Figure 5-3, for students expecting to graduate during the 2007–2008 academic year (the most recent comparable data available), the average net price for a STEM degree ranged from $7,800 for underrepresented minority students at a public 4-year institution to nearly $30,000 for students not from an underrepresented minority group at a private research
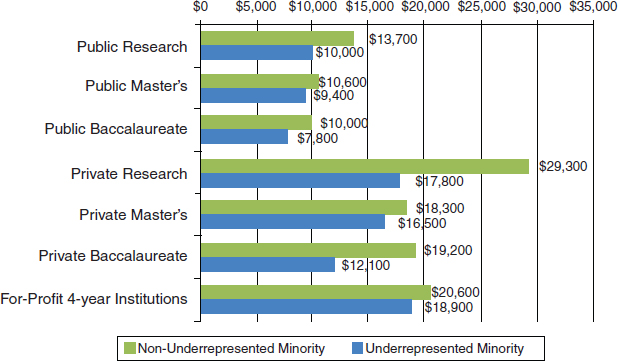
SOURCE: Kirshstein (2013b, p. 9).
institution.14 In the same institution type, the difference in net price paid for physical and natural science and engineering degrees in comparison with social and behavioral science degrees was generally small (Kirshstein, 2013b). Across all institutions, underrepresented minority students pay less than other students, with the largest percentage difference in tuition among students at private research institutions ($17,800 and $29,300, respectively). It is likely that underrepresented minority students pay less than other students both because they typically come from families of greater need (thus, more likely qualifying for tuition assistance) and because they attend institutions with lower price tags, including minority-serving institutions, community colleges, and less-selective 4-year institutions.
The net price for underrepresented minority students who attended public research universities was slightly less than $10,000 (Kirshstein, 2013b). These minority students accounted for 44 percent of STEM degree earners from public research universities. The highest net price for underrepresented minority students was for those students who attended private, for-profit institutions, $18,900: this price was more than $1,000
__________________
14 The net price of a degree was calculated as the difference between all student expenses—tuition and fees, room and board, books and supplies, transportation, and other education-related expenses—and the sum of the grants received.
higher than the price paid by students who attended private, not-for-profit research universities.
There are no comparable data of the net price for STEM and non-STEM degrees. However, the average price for a STEM degree in the 2007–2008 academic year was still higher than the price of a non-STEM degree 6 years later (The College Board, 2014).
STEM Student Debt
Figure 5-4 shows the proportion of students who graduated in 2007–2008 with a bachelor’s degree in a STEM field (other than psychology and the social sciences) with more than $30,000 of debt. About 65 percent of all STEM majors graduated with debt, in comparison with 60 percent for graduates from 4-year institutions in 2011–2012 (The College Board, 2014). The lowest rates of debt are among students at public research and master’s institutions, and the highest rates of debt are among students at for-profit 4-year institutions.
As shown in Figure 5-5 (Kirshstein, 2013c), among STEM majors (in fields other than psychology and the social sciences), larger fractions of students from underrepresented minority groups graduated with a debt of more than $30,000 than did students from other groups. The data for stu-
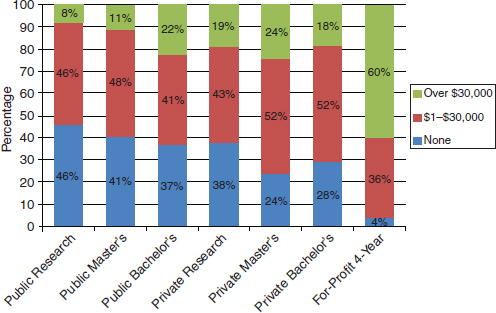
SOURCE: Kirshstein (2013c, p. 1).
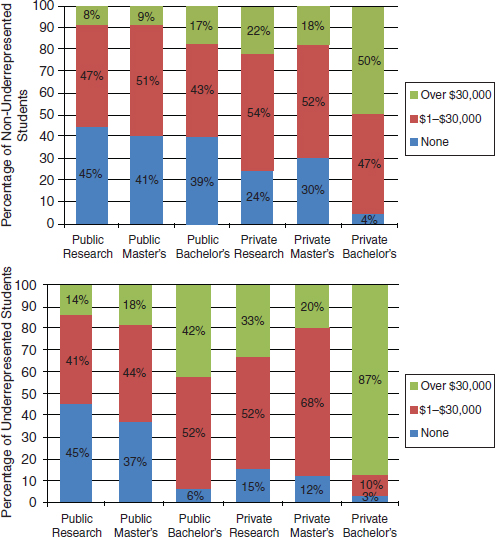
SOURCE: Kirshstein (2013c, p. 2).
dents in private bachelor’s institutions are particularly striking: 87 percent of underrepresented minority students and 50 percent of other students had debt of more than $30,000. In all types of private institutions, nonminority students were more likely than minority students to be debt free. Again, the largest disparity between underrepresented minority students and other students in amount of debt is in public bachelor’s institutions: only 6 percent of students from underrepresented minority groups graduate with no debt, in comparison with 39 percent of other students.
Cost to the Institution of a Degree
Total spending of colleges and universities is correlated with the price that students pay and the services they receive. Calculations of total spending typically include education and related spending and general spending (e.g., food services and bookstores). Education and related spending is the common metric used to measure the full “production cost” of education, but it captures only the spending related to services and infrastructure that supports learning, which includes instruction, research, public service, student services (e.g., admissions, registrar services, and student counseling), academic support (e.g., libraries and computing), institutional support (e.g., executive management, and legal and fiscal operations), and associated operation and maintenance. Although other measures of cost have been proposed (see Johnson, 2009), most available data on college costs are based on education and related spending. Thus, the discussion of cost in this section is derived from analyses of education and related spending.
Considering only those categories of costs, the estimated average cost of producing a bachelor’s degree at a public 4-year institution in 2009 ranged from about $45,000 to $60,000 in 2009 (Desrochers, 2011). The lower estimate is conservative and includes only the cost of completing 120 credit hours as required by most degree programs. The inclusion of classes taken beyond those required, a situation often experienced by students who transfer institutions, increases costs by 12 percent, to an average of $50,700. The upper estimate includes all of the education and related costs that institutions incur (including credit hours required for a degree, credits that exceed degree requirements, student attrition, and course offerings for nondegree-seeking students). In 2010, the cost per degree declined at most types of institutions as costs were cut in response to reductions in various forms of state tuition subsidies in the context of a sharp economic downturn. However, the cost per degree was still higher than it had been 5 and 10 years earlier. Community colleges consistently decreased costs across the decade (American Institute for Research, 2012).
Another way to analyze the cost of higher education is based on the amount spent per full-time student per year (American Institutes for Research, 2012; see Figure 5-6). For 2-year and 4-year institutions, the costs in 2010 ranged from $9,501 for community colleges (9% more than in 2000) to $12,740 for a public 4-year institution (6% more than in 2000) to $21,126 for a private 4-year institution (12% more than in 2000) and $35,068 for a private research institution (22% more than in 2000). Although funding from state and local appropriations for public institutions is cyclical, the overall trend clearly has been downward. A decade ago, public funds for higher education exceeded tuition revenues from students in public 4-year institutions by $3,000–$5,000 per student, but by 2010,
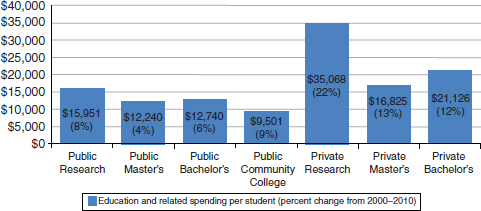
SOURCE: Adapted from American Institute for Research (2012, Figure 2).
this difference was about $500 per student. The expectation for the future is that students attending public institutions will continue to pay a larger share of their educational costs.
An analysis by the College Board (2014) found that for the decade between 2000–2001 and 2010–2011, the percentage of institutional revenue from net tuition and fees increased from 21 percent to 34 percent at public 2-year colleges; from 30 percent to 46 percent at public 4-year colleges; and from 88 percent to 94 percent at private nonprofit 4-year colleges (The College Board, 2014). For public institutions, these increases reflect an effort to recover revenue in the face of reduced state and local appropriations.
Along with the downward trend in overall funding from state and local appropriations, there are a growing number of states moving toward performance-based funding for public institutions. This approach uses measures of institutional quality to determine the amount of funding allocated to 2-year and 4-year institutions. Performance-based funding was first implemented by the Tennessee Higher Education Commission in 1978. By 2000, the outcomes-based model for funding was being used in 26 states (Harnish, 2011). Newer versions of performance-based funding are increasingly focused on outcomes deemed important by a state (e.g., graduation rates, average wages of graduates, percentage of students with Pell Grants), and they account for a greater percentage of institutional base funding.
Advocates of performance-based funding argue that the approach advances state goals to improve overall levels of educational attainment and responds to the public’s desire to get what it pays for. Some of those who argue against performance-based funding believe it is another effort on the part of state policy makers to cut funding. While the goal of performance-
based funding is to increase graduation rates, it has been associated with no changes or negative changes in graduation rates (Tandberg and Hillman, 2013). Others are concerned that financially rewarding completion instead of access will penalize institutions in high poverty areas with the students who are most at risk, while rewarding institutions that serve a student population that is more likely to succeed. Still others believe it will shift the mission of institutions to the point that underprepared students will lose access or that quality will suffer in an effort to move students through to completion.
Beyond the direct cost of producing bachelor’s degrees, the high cost of student attrition also affects institutions’ costs. Approximately 30 percent of students do not return after their first year (Knapp et al., 2012). Some institutions include this cost in their budgets as part of general or overhead spending or the cost of business. This cost is borne by universities, students, and taxpayers. Data from the U.S. Department of Education’s Integrated Postsecondary Education Data System (IPEDS) show that between 2003 and 2008 (the latest years for which data are available), states provided more than $1.4 billion and the federal government provided over $1.5 billion in grants to students who did not return to the institutions at which they were enrolled for a second year. However, the IPEDS data do not show whether the students who did not return for their second year at that institution did not continue at all or continued their education elsewhere. Nor do the IPEDS data show whether such students enrolled at the same or a different institution sometime later.
Cost of a STEM Degree
National data are not available on the cost of a STEM degree. Very few states and institutions collect data on costs at the level of individual disciplines. Estimates of trends from three states (Florida, Indiana, and Ohio) indicate that most STEM degrees (other than psychology and the social sciences) cost more for institutions to produce than non-STEM degrees (Kirshstein, 2013b; see Figure 5-7).15 Degrees in engineering, engineering technologies/technicians, computer and information sciences, physical sciences, and biological and biomedical sciences cost more than the average cost of a degree across all fields of study, while mathematics and statistics cost less than the average. Social sciences and psychology also cost less than the average. Perhaps in response to these different costs, it is becoming in-
__________________
15 These costs were estimated by combining institutional-level data on educational expenditures and degrees from the IPEDS with state-level data on discipline-level credit hour costs from the Four-State Cost Study of 28 disciplines in public baccalaureate-granting institutions that include Florida, Illinois, Ohio, and New York (Conger et al., 2010).
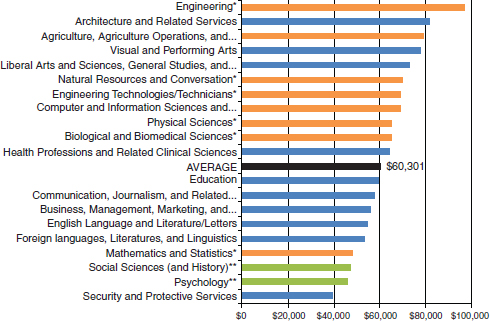
NOTES: * indicates a STEM field; ** indicates a field of social or behavioral science. Institutional-level data on educational expenditures and degrees were combined with state-level data on discipline-level credit hour costs (from Florida, Illinois, and Ohio) to construct various measures of degree production costs. The estimates should not be interpreted as precise costs, but the patterns and trends appear durable.
SOURCE: Kirshstein (2013b, p. 14).
creasingly common for institutions to charge differential tuition for STEM majors, as discussed below.
Differential Tuition and STEM
The convention of charging all undergraduates the same price for full-time study is changing. The enactment of differential pricing practices in which students are charged more tuition for upper- versus lower-division coursework, for example, has grown steadily since the mid-1990s and shows no sign of abating (Cornell Higher Education Research Institute, 2011). In a survey of 165 public research universities, 45 percent reported having differential pricing policies; most of the policies had been implemented in the last decade (Nelson, 2008). A more recent survey reported that 57 percent of public research universities had adopted differential pricing (Reed, 2011). Also, 40 percent of doctoral degree-granting public universities had differential pricing, with the majority assessed according
to major (Cornell Higher Education Research Institute, 2011). While some institutions have only recently begun to implement differential tuition, some large public universities, such as the University of Illinois and the University of Michigan, have long charged more for certain coursework or majors (Cornell Higher Education Research Institute, 2011).
Institutions report adopting differential pricing in response to the overall rising costs of program delivery and the need to cover more of their costs with tuition, given the reduced financial support they are receiving from states (Stange, 2013). The relatively high cost of offering STEM degrees is one justification provided for charging more for a STEM degree than for other degrees. As discussed above, although there are limited national data on the cost of a degree at the discipline level, the best available data suggest that institutions are likely to incur more costs to deliver STEM degrees. Engineering, business, and nursing are currently the three degrees most often targeted for differential pricing. A study of 142 large public research universities from 1990 to 2010 showed that 50 of these institutions adopted differential pricing for those degrees during that time (Stange, 2013).
Economists argue that the practice of differential pricing means that students are paying a price that aligns more closely with the actual institutional cost of delivering the degree received, thereby eliminating the subsidization of STEM degrees by students who are majoring in other fields. It is also argued that differential tuition can better align the price of a degree with a student’s ability to pay after graduation. For instance, engineering, science, and business majors tend to earn more and have higher returns on their education investments than students in other majors, such as education and humanities. Thus, students who graduate with the former degrees are said to be in a better position to finance higher tuition fees with loans.
An alternative view, however, is that differential tuition may decrease participation in the fields often targeted for higher prices, such as STEM, especially for low-income students. Given the barrier that the price of a STEM degree can play, especially for students from families with significant financial needs, it is important to understand what is known about how differential tuition practices and policies may contribute to inequalities in STEM degree completion.
Many factors affect students’ choice of major, including both nonfinancial factors (e.g., ability, preference, prestige, preparation) and financial considerations (e.g., expected future earnings and ability to pay). Research on the effects of differential pricing is extremely limited in general and especially with respect to how it may interact with other factors to affect students’ choice of degree.
Some evidence from a study of students pursuing engineering degrees at two public research universities (George-Jackson et al., 2012) suggests that financial aid initially offsets the higher prices paid for an engineering
degree as a result of differential tuition, but that the costs increase over time, particularly for low-income students.
In a controlled survey that compared 50 public research institutions that had adopted differential tuition for engineering, business, and nursing with similar institutions that had not, the choice of major for women and underrepresented minority students was negatively affected by differential tuition policies (Stange, 2013). Such results suggest that differential pricing may deter those groups from majoring in STEM fields. They also indicate that revenues may not be realized or costs shifted as institutions expect (Stange, 2013). However, it is important to note that enrollment in engineering majors decreased in association with differential pricing, while enrollment in nursing programs increased, and enrollment in business programs showed no change.
In a study of student perceptions of differential pricing policies, the policies were viewed as a sign of program quality, but they were also perceived as unfair (Harwell, 2013). Choice of major for the majority of these students was not affected, however.
DEPARTMENTAL POLICIES THAT CAN AFFECT THE COST OF STEM DEGREES
A department’s policies, including sequencing of courses, degree requirements and prerequisites outside of the major, grading policies, and remedial course work, can affect the price that a student pays for a STEM degree.
Rigid course sequencing of many majors can increase the cost that a student pays for a STEM degree. The classes that students need to take are not always available, or there may not be enough space for them during the semester that they need to take the courses to meet the required sequence and graduate on time. Students who transfer from another institution may enter with enough credits to be considered a second-year student but may not be able to take 200-level courses until completing all of the required course work that was not taken at the institution from which they transferred. For STEM majors, the high proportion of required credits compared with the proportion of elective credits narrows students’ flexibility in meeting requirements. If students cannot take the courses they need in a timely manner, it could result in longer time at college and greater numbers of credits than actually required. Some departments have taken steps to loosen course sequencing and reduce the number of major credit hours required: see Box 5-4 for a description of the steps taken by one small liberal arts college.
Community colleges are also experimenting with ways to reduce the cost of a degree and time to degree, both at the departmental level and
more generally, while preparing students for high-demand careers. For example, the 10 community colleges that comprise the U.S. Department of Labor funded National STEM Consortium (NSC)16 are working together to develop a set of one-year certificate programs that meet regional
__________________
16 For details, see http://www.nationalstem.org/ [June 2015].
industry needs. The NSC has developed a two-part STEM bridge program to quickly and efficiently ensure that students are prepared for the rigors of the 30-credit certificate programs. In addition, the certificates offered through the NSC can be earned through a compressed schedule, which allows students to complete the program quickly and be (re)deployed to an employer sooner than with traditional college programs. After completing their certificate, students can work with NSC industry partners to connect with potential employers in their region.
SUMMARY
Many institutional, state, and national undergraduate education policies are not well situated to support students as they progress through the complex and varied pathways to a STEM degree, including transferring among institutions. Research to date suggests that changing policies to increase the transfer of community college course credits could have significant positive effects on student retention and degree completion. Strong articulation agreements among 2-year and 4-year institutions, including common general education requirements, common introductory courses with common numbering, and easily available access to information on course equivalencies across institutions, can improve the percentage of courses transferred and student success.
Regional accrediting agencies, state policy makers, and professional societies can take leadership on requiring institutions to track and share data on their acceptance of transfer credits and also develop and share other metrics of student success, post-transfer. These agencies, policy makers, and societies should reconsider the current model of course-by-course articulation based on content and overseen by individual partnerships of 2-year and 4-year colleges. Changes to support smoother transfer experiences can also be made in institutions, where department leaders (e.g., chairs, deans) are critical actors. Departments often have the latitude to implement policies that can smooth the transition process for students, such as policies that simplify the credit transfer process and provide students with mentoring and other supports needed to successfully transfer.
Undergraduate credentials and degrees in many STEM fields are widely believed to cost more to deliver than degrees in other fields, and there is some evidence to support this belief. In response, some institutions have instituted differential tuition policies. One study shows that differential pricing was associated with a decline in enrollment rates in engineering and business majors over a 3-year period, while it was associated with an increase in enrollment in nursing (Stange, 2013). There are concerns that such policies will have a chilling effect, especially on attracting students from underrepresented groups who already have high levels of borrowing
related to unmet financial need. Increases in the price that students pay for a STEM degree, especially in public institutions, appear to be related to decreased support for higher education from state and local sources.
REFERENCES
Alfonso, M. (2006). The impact of community college attendance on baccalaureate attainment. Research in Higher Education, 47, 873–903.
American Council on Education (2014). Higher Ed Spotlight: Undergraduate Student Veterans. Available: http://combat2career.com/blog/ace-undergraduate-student-veteraninfographic-november-2014/ [February, 2015].
American Institute for Research. (2012). College Spending in a Turbulent Decade: Findings from the Delta Cost Project: A Delta Data Update 2000–2010. Available: http://www.deltacostproject.org/sites/default/files/products/Delta-Cost-College-Spending-In-ATurbulent-Decade.pdf [April 2015].
Anderson, G.M., Sun, J.C., and Alfonso, M. (2006). Effectiveness of statewide articulation agreements on the probability of transfer: A preliminary policy analysis. Review of Higher Education, 29(3), 261–291. Available: http://muse.jhu.edu/login?auth=0&type=summary&url=/journals/review_of_higher_education/v029/29.3anderson.html [April 2015].
Austin, A.E. (2011). Promoting Evidence-Based Change in Undergraduate Science Education. Paper prepared for the Committee on Barriers and Opportunities in Completing 2-Year and 4-Year STEM Degrees. Available: http://sites.nationalacademies.org/cs/groups/dbassesite/documents/webpage/dbasse_072578.pdf [April 2015].
Bozick, R., and Lauff, E. (2007). Education Longitudinal Study of 2002 (ELS:2002): A First Look at the Initial Postsecondary Experiences of the Sophomore Class of 2002 (NCES 2008-308). Washington, DC: National Center for Education Statistics, Institute of Education Sciences, U.S. Department of Education.
The College Board. (2011). Improving Student Transfer from Community Colleges to Four-Year Institutions: The Perspective of Leaders from Baccalaureate-Granting Institutions. Available: http://www.jkcf.org/assets/1/7/Perspective_of_Leaders_of_Four-Year_institutions.pdf [April 2015].
The College Board. (2013). Trends in Student Aide 2013: 30 Years 1983–2013. Available: http://trends.collegeboard.org/sites/default/files/student-aid-2013-full-report.pdf [October 2015].
The College Board. (2014). Trends in College Pricing 2013. Available: https://trends.collegeboard.org/sites/default/files/college-pricing-2013-full-report.pdf [April 2015].
Complete College America. (2011). Time Is the Enemy. The Surprising Truth About Why Today’s College Students Aren’t Graduating . . . and What Needs to Change. Available: http://completecollege.org/docs/Time_Is_the_Enemy.pdf [April 2015].
Conger, S.B., Bell, A., and Stanley, J. (2010). Four-State Cost Study. Boulder, CO: State Higher Education Executive Officers. Available: http://files.eric.ed.gov/fulltext/ED540266.pdf [April 2016].
Cornell Higher Education Research Institute. (2011). 2011 Survey of Differential Tuition at Public Higher Education Institutions. Available: https://www.ilr.cornell.edu/sites/ilr.cornell.edu/files/2011%20Survey%20of%20Differential%20Tuition%20at%20Public%20Higher%20Education%20Institutions.pdf [April 2015].
Council of Regional Accrediting Commissions. (2015). Statement of the Council of Regional Accrediting Commissions (C-RAC) Framework for Competency-Based Education. Available: https://www.insidehighered.com/sites/default/server_files/files/C-RAC%20CBE%20Statement%20Press%20Release%206_2.pdf [April 2016].
Desrochers, D.M. (2011). Estimating the Production Cost of Degrees by Level and Discipline Using National Data: An Exploration of Methodologies. Unpublished manuscript. American Institutes for Research, Washington, DC.
Doyle, W. (2006). Community college transfers and college graduation: Whose choices matter most? Change, 38(3), 56–58.
Feeney, M., and Heroff, J. (2013). Barriers to need-based financial aid: Predictors of timely FAFSA completion among low-income students. Journal of Student Financial Aid, 43(2), 65–85. Available: http://publications.nasfaa.org/cgi/viewcontent.cgi?article=1204&context=jsfa [April 2015].
George-Jackson, C.E., Rincon, B., and Martinez, M.G. (2012). Low-income students in engineering: Considering financial aid and differential tuition. Journal of Student Financial Aid, 42(2), 4–24.
Goldhaber, D., Gross, B., and DeBurgomaster, S. (2008). Community Colleges and Higher Education: How Do State Transfer and Articulation Policies Impact Student Pathways? CRPE Working Paper #2008-4. Seattle: Center on Reinventing Public Education, University of Washington. Available: http://www.crpe.org/sites/default/files/wp_crpe4_cc_may08_0.pdf [April 2015].
Goldrick-Rab, S. (2006). Following their every move: How social class shapes postsecondary pathways. Sociology of Education, 79(1), 61–79.
Gross, B., and Goldhaber, D. (2009). Community College Transfer and Articulation Policies: Looking Beneath the Surface. CRPE Working Paper #2009_1. Available: http://files.eric.ed.gov/fulltext/ED504665.pdf [October 2015].
Harnish, T.L. (2011). Performance-Based Funding: A Re-emerging Strategy in Public Higher Education Financing. A Higher Education Policy Brief. Washington, DC: American Association of State Colleges and Universities. Available: http://www.aascu.org/uploadedFiles/AASCU/Content/Root/PolicyAndAdvocacy/PolicyPublications/Performance_Funding_AASCU_June2011.pdf [April 2015].
Harwell, E. (2013). Students’ Perceptions of Differential Tuition Based on Academic Program and the Impact on Major Choice. IDEALS. Available: http://hdl.handle.net/2142/45516 [April 2015].
Hills, J.R. (1965). Transfer shock: The academic performance of the junior college transfer. The Journal of Experimental Education, 33(3), 201–215.
Holahan, C.K., Green, J.L., and Kelley, H.P. (1983). A 6-year longitudinal analysis of transfer student performance and retention. Journal of College Student Personnel, 24, 305–310.
Hossler, D., Shapiro, D., Dundar, A., Ziskin, M., Chen, J., Zerquera, D., and Torres, V. (2012). Transfer and Mobility: A National View of Pre-Degree Student Movement in Postsecondary Institutions. Herndon, VA: National Student Clearinghouse Research Center. Available: http://pas.indiana.edu/pdf/Transfer%20&%20Mobility.pdf [April 2015].
Johnson, N. (2009). What Does a College Degree Cost?: Comparing Approaches to Measuring “Cost per Degree.” Delta Cost Project issue brief. American Institute for Research. Available: http://www.deltacostproject.org/products/what-does-college-degree-cost-comparing-approaches-measuring-%E2%80%9Ccost-degree%E2%80%9D [April 2015].
Kirshstein, R. (2013a). Rising tuition and diminishing state funding: An overview. Journal of Collective Bargaining in the Academy, 0(14). Available: http://thekeep.eiu.edu/jcba/vol0/iss8/14 [April 2015].
Kirshstein, R. (2013b). The Price and Cost of a STEM Degree. Presentation at the second meeting of the Committee on Barriers and Opportunities in Completing 2-Year and 4-Year STEM Degrees, National Academy of Sciences, Washington, DC.
Kirshstein. R. (2013c). How Much Debt Do Science and Bachelor’s Degree Recipients Accrue? Delta Cost Project, American Institutes for Research, Washington, DC. Available: http://www.deltacostproject.org/sites/default/files/products/STEM%20Debt%20for%20Science%20Bachelors.pdf [June, 2015].
Kisker, C.B., Wagoner, R.L., and Cohen, A.M. (2011). Implementing Statewide Transfer and Articulation Reform: An Analysis of Transfer Associate Degrees in Four States. Center for the Study of Community Colleges. Available: http://www.cscconline.org/files/8613/0255/2073/Implementing_Statewide_Transfer_and_Articulation_Reform1.pdf [April 2015].
Knapp, L.G., Kelly-Reid, J.E., and Ginder, S.A., (2012). Enrollment in Postsecondary Institutions, Fall 2010: Financial Statistics, Fiscal Year 2010 and Graduation Rates, Selected Cohorts 2002–07. Washington, DC: U.S. Department of Education.
Laanan, F.S. (1996). Making the transition: Understanding the adjustment process of community college transfer students. Community College Review, 23(4), 69–84.
Laanan, F.S. (1998). Beyond Transfer Shock: A Study of Students’ College Experiences and Adjustment Processes at UCLA. Los Angeles: University of California.
Laanan, F.S. (Ed.). (2001). Transfer Students, Trends and Issues: New Directions for Community Colleges, No. 114. New York: Wiley.
Melguizo, T., Kienzl, G., and Alfonso, M. (2011). Comparing the educational attainment of community college transfer students and four-year rising juniors using propensity score matching methods. Journal of Higher Education, 82, 265–291.
Monaghan, D.B., and Attewell, P. (2014). The community college route to the bachelor’s degree. Educational Evaluation and Policy Analysis, Available: http://epa.sagepub.com/content/early/2014/02/28/0162373714521865 [April 2015].
Mullin, C.M. (2012). An Indespensable Part of the Community College Mission. Policy Brief 2012-03PBL. Available: http://www.aacc.nche.edu/Publications/Briefs/Documents/AACC_Transfer_to_LUMINA.pdf [April 2015].
Mustafa, S., Glenn, D., and Compton, P. (2010). Transfers in the University System of Ohio: State Initiatives and Outcomes 2002–2009. Columbus: Ohio Board of Regents. Available: https://www.ohiohighered.org/files/uploads/transfer/research/Transfer_Report_071811_Update.pdf [April 2016].
National Center for Education Statistics. (2013). Digest of Education Statistics 2013. Washington, DC: U.S. Department of Education.
The National Center for Public Policy and Higher Education. (2011). Affordability and Transfer: Critical to Increasing Baccalaureate Degree Completion. Available: http://www.highereducation.org/reports/pa_at/ [April 2015].
National Research Council. (2003a). BIO2010: Transforming Undergraduate Education for Future Research Biologists. Committee on Undergraduate Biology Education to Prepare Research Scientists for the 21st Century. Board on Life Sciences, Division on Earth and Life Studies. Washington, DC: The National Academies Press.
Nelson, G. (2008). Differential Tuition by Undergraduate Major: Its Use, Amount, and Impact at Public Research Universities. Lincoln: University of Nebraska. Available: http://digitalcommons.unl.edu/cgi/viewcontent.cgi?article=1004&context=cehsedaddiss [April 2015].
Parker, R., Rittling, M., Rowlett, I., and Jenkins, D. (2014). Strengthening Transfer Pathways: Tips and Tools for Faculty Engagement. Presented at the American Association of Community Colleges Annual Convention, April 6, Washington, DC. Available: http://ccrc.tc.columbia.edu/presentation/transfer-pathways-engaging-faculty-aacc.html [April 2015].
Reed, L. (2011). UNL tuition may vary by majors. Omaha World-Herald, April 27.
Reynolds, C.L. (2012). Where to attend? Estimating the effects of beginning college at a two-year institution. Economics of Education Review, 31, 345–362.
Reynolds, C.L., and DesJardins, S.L. (2009). The use of matching methods in higher education research: Answering whether attendance at a 2-year institution results in differences in educational attainment. In J.C. Smith (Ed.), Higher Education: Handbook of Theory and Research (pp. 47–57). New York: Springer.
Roksa, J. (2009). Building bridges for student success: Are transfer policies effective? Teachers College Record, 111(10), 2444–2478.
Roksa, J., and Keith, B. (2008). Credits, time, and attainment: Articulation policies and success after transfer. Educational Evaluation and Policy Analysis, 30(3), 236–254.
Scott, T.P., Thigpin, S.S., and Bentz, A.O. (in press). Transfer learning community (TLC): Overcoming transfer shock and increasing retention of mathematics and science majors. Journal of College Student Retention: Research, Theory & Practice.
Shaffer, C.D., Alvarez, C., Bailey, C., Barnard, D., Bhalla, S., Chandrasekaran, C., Chandrasekaran, V., Chung, H.M., Dorer, D.R., Du, C., Eckdahl, T.T., Poet, J.L., Frohlich, D., Goodman, A.L., Gosser, Y., Hauser, C., Hoopes, L.L., Johnson, D., Jones, C.J., Kaehler, M., Kokan, N., Kopp, O.R., Kuleck, G.A., McNeil, G., Moss, R., Myka, J.L., Nagengast, A., Morris, R., Overvoorde, P.J., Shoop, E., Parrish, S., Reed, K., Regisford, E.G., Revie, D., Rosenwald, A.G., Saville, K., Schroeder, S., Shaw, M., Skuse, G., Smith, C., Smith, M., Spana, E.P., Spratt, M., Stamm, J., Thompson, J.S., Wawersik, M., Wilson, B.A., Youngblom, J., Leung, W., Buhler, J., Mardis, E.R., Lopatto, D., and Elgin, S.C. (2010). The genomics education partnership: Successful integration of research into laboratory classes at a diverse group of undergraduate institutions. CBE Life Sciences Education, 9(1), 55–69.
Smith, P.P. (2010). You Can’t Get There from Here: Five Ways to Clear Roadblocks for College Transfer Students. Education Outlook. Washington, DC: American Enterprise Institute for Public Policy Research. Available: http://www.aei.org/article/education/higher-education/you-cant-get-there-from-here/ [April 2015].
Stephan, J.L., Rosenbaum, J.E., and Person, A.E. (2009). Stratification in college entry and completion. Social Science Research, 38, 572–593.
Strange, K. (2013). Differential Pricing in Undergraduate Education: Effects on Degree Production by Field. NBER Working Paper 19183. Cambridge, MA: National Bureau of Economic Research. Available: http://nber.org/papers/w19183 [July 2015].
Tandberg, D.A., and Hillman N.W. (2013). State Performance Funding for Higher Education: Silver Bullet or Red Herring? (Policy Brief). Madison, WI: University of Wisconsin–Madison, Wisconsin Center for the Advancement of Postsecondary Education.
Townsend, B.K. (1995). Community college transfer students: A case study of survival. The Review of Higher Education, 18(2), 175–193.
Wei, C.A., and Woodin, T. (2011). Undergraduate research experiences in biology: Alternatives to the apprenticeship model. CBE Life Science Education, 10(2), 123–131.
Western Interstate Commission for Higher Education, (2014). State Higher Education Policy Database. State Summaries: Articulation, transfer and alignment. Available: http://higheredpolicies.wiche.edu/content/policy/state/summaries/31 [April 2015].


