
Appendix F*
Student Outcomes: Detailed Data
This appendix complements Chapter 6 by providing more detailed data on a range of student outcomes. The data are all from the D.C. Comprehensive Student Assessment (DC CAS), which was the primary testing vehicle for students in the city’s public schools until 2014.
The 35 figures cover the following:
- Figure F-1 (A-G) shows reading scores for grades 3-8 and 10.
- Figure F-2 (A-G) shows math scores for grades 3-8 and 10.
- Figure F-3 (A-C) shows composition scores for grades 4, 7, and 10.
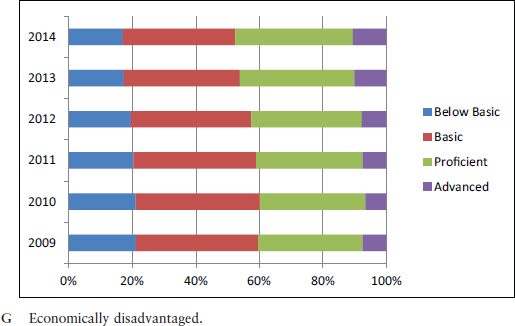
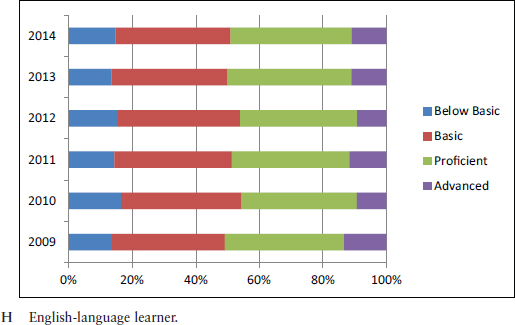
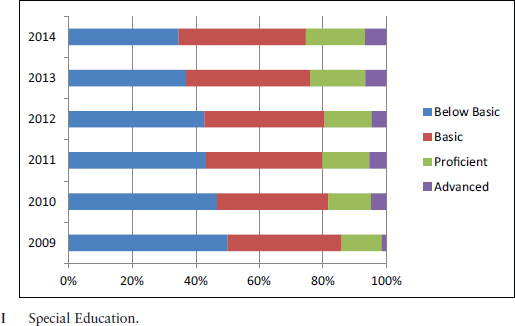
- Figure F-4 (A-I) shows reading scores that are summarized across grades for various students groups.
- Figure F-5 (A-I) shows math scores that are summarized across grades for various student groups.
________________
*The contents of Appendix E—pages 300-320—are available at http://www.nap.edu/catalog/21743/an-evaluation-of-the-public-schools-of-the-district-of-columbia.
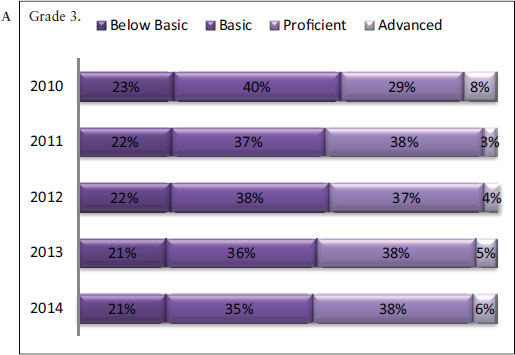
FIGURE F-1 (A-G) Percentage of students’ scoring at each performance level by grade for DC CAS reading, 2007-2014.
SOURCE: Data from LearnDC at http://www.learndc.org [March 2015].
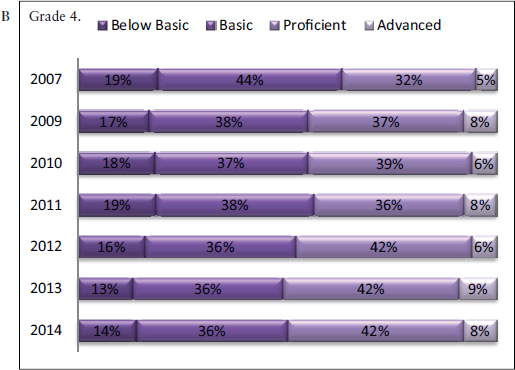
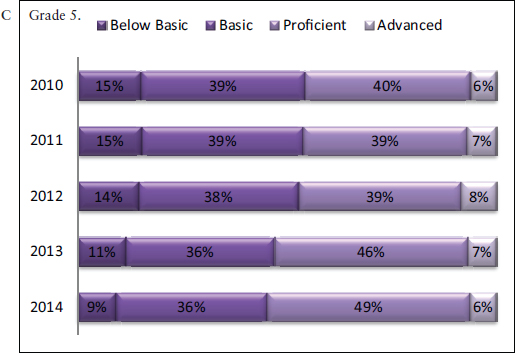
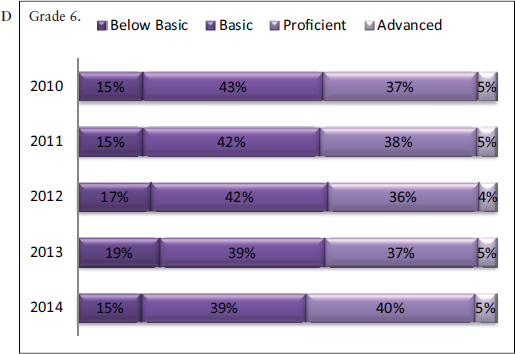
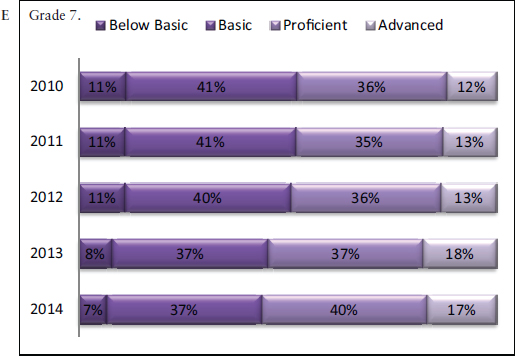
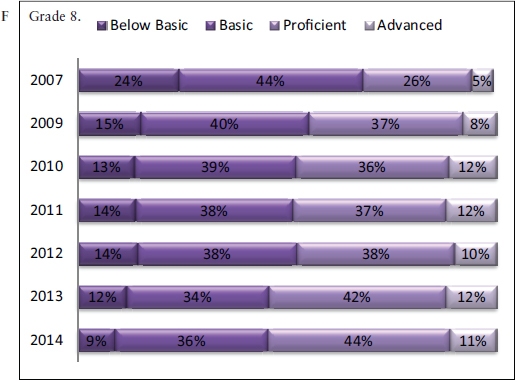
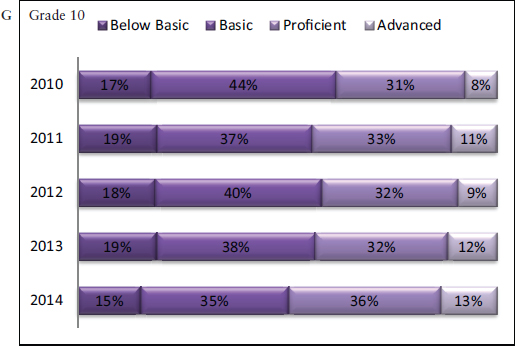
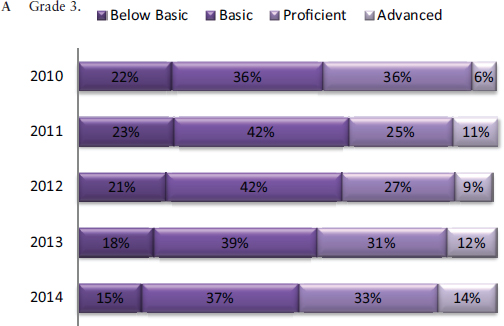
FIGURE F-2 (A-G) Percentage of students scoring at each performance level by grade for DC CAS math, 2007-2014 [3rd-grade testing did not begin until 2010].
SOURCE: Data from LearnDC at http://www.learndc.org [March 2015].
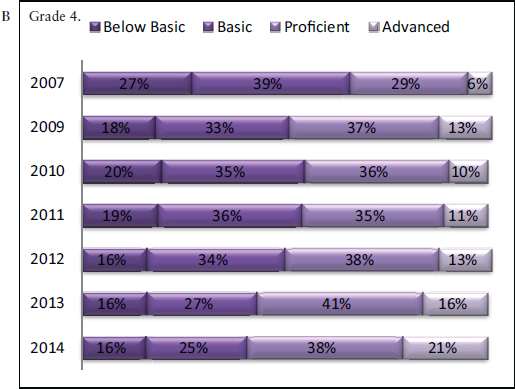
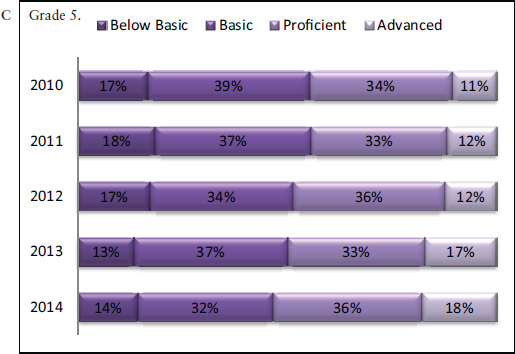
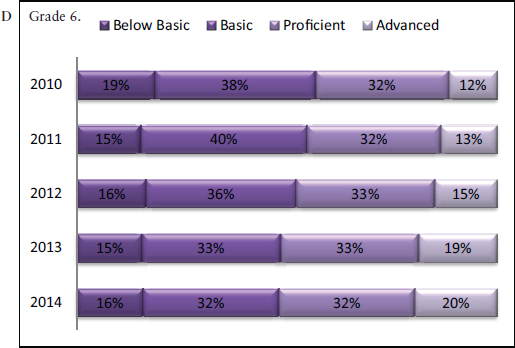
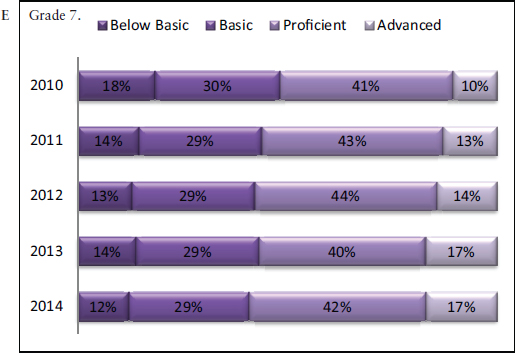
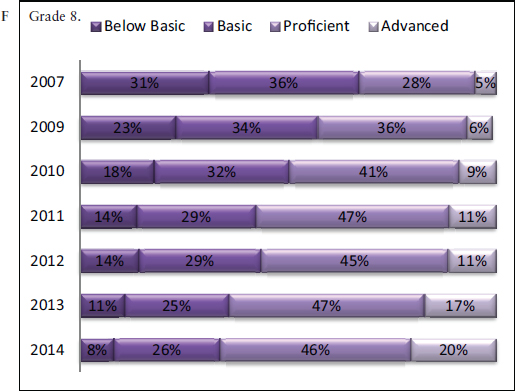
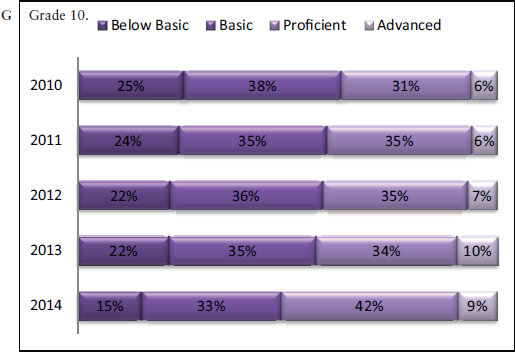
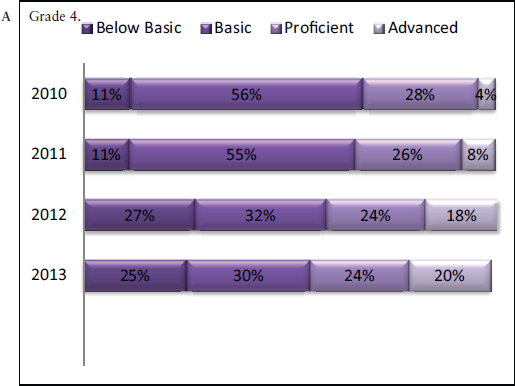
FIGURE F-3 (A-C) Percentage of students’ scoring at each performance level by grade for DC CAS composition, 2007-2014.
SOURCE: Data from LearnDC at http://www.learndc.org [March 2015].
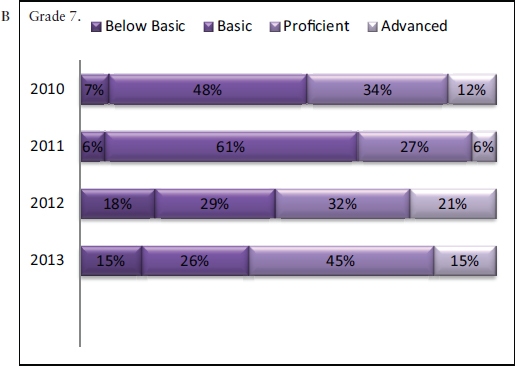
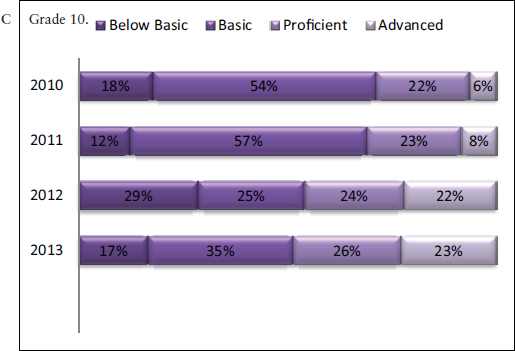
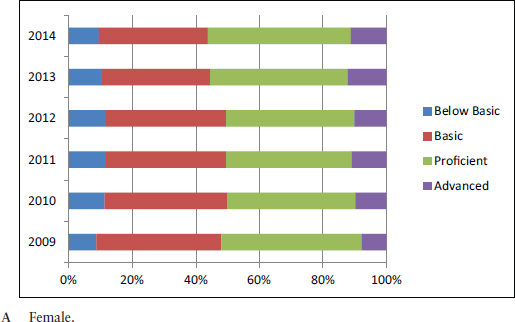
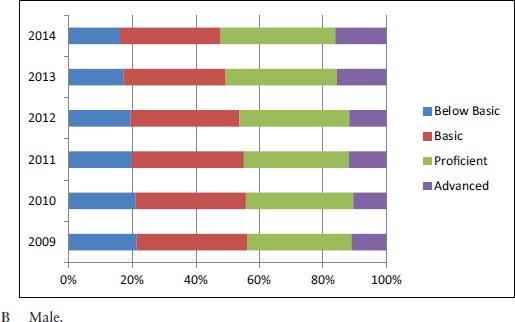
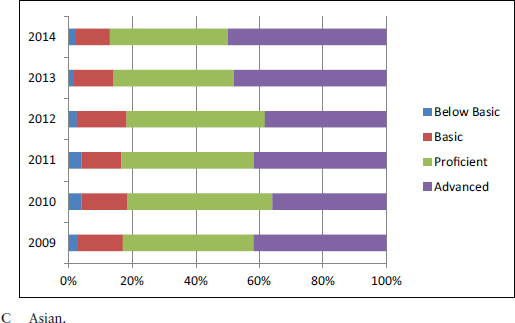
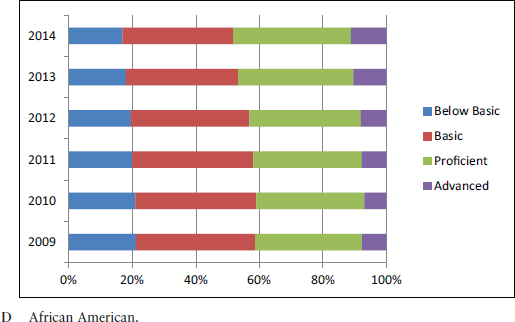
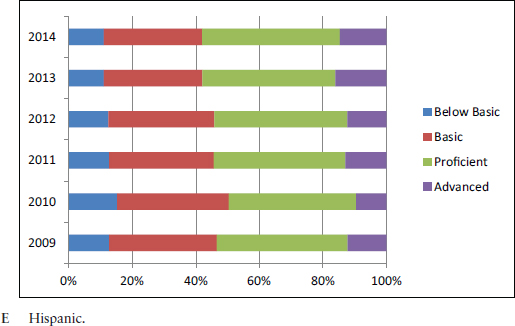
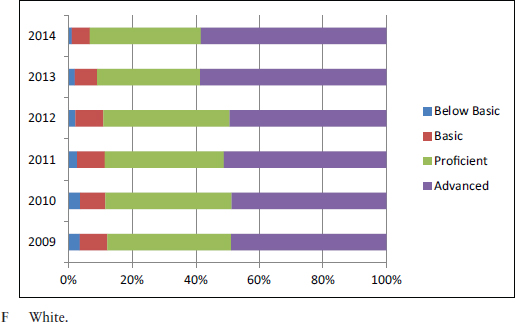
FIGURE F-4 (A-I) Percentage at each performance level for student groups, summarized across grades: DC CAS reading.
SOURCE: Data from LearnDC at http://www.learndc.org [March 2015].
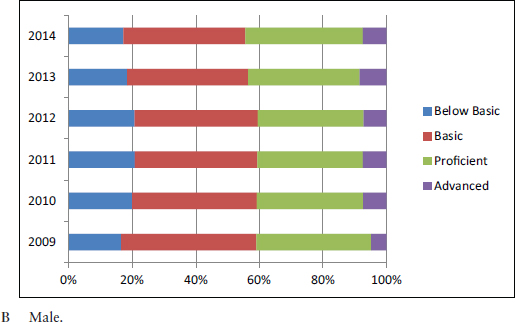
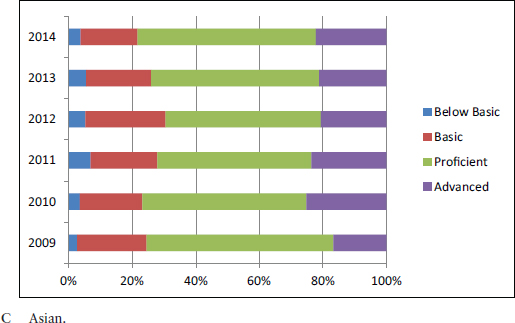
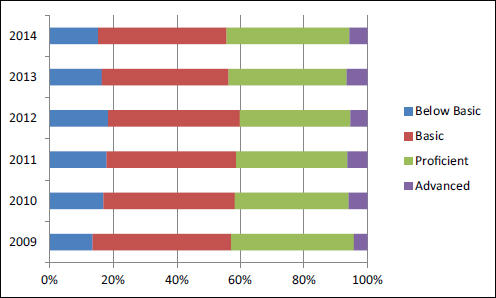
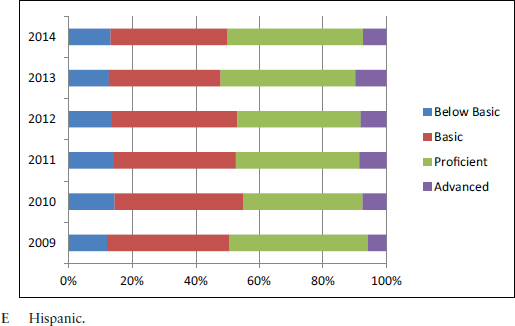
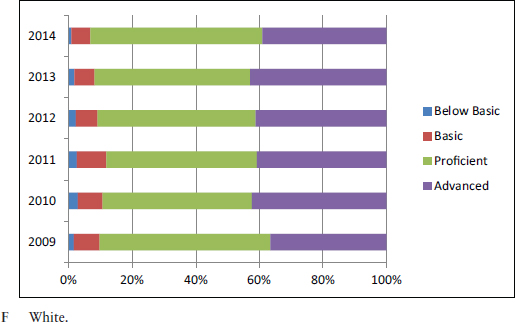
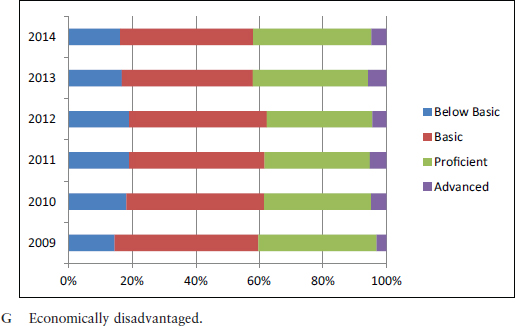
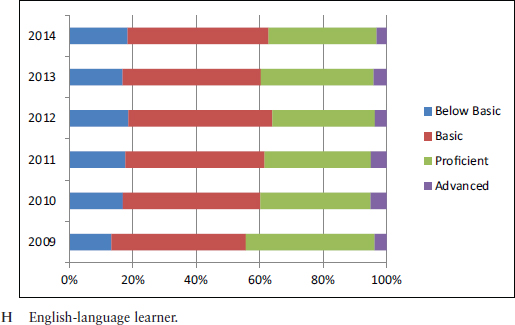
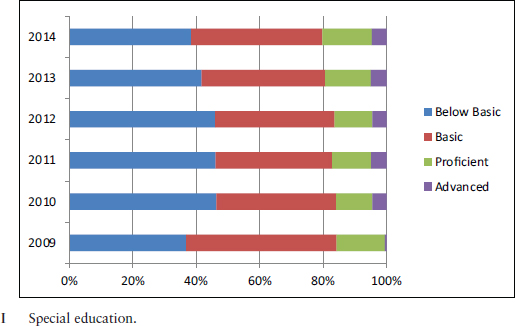
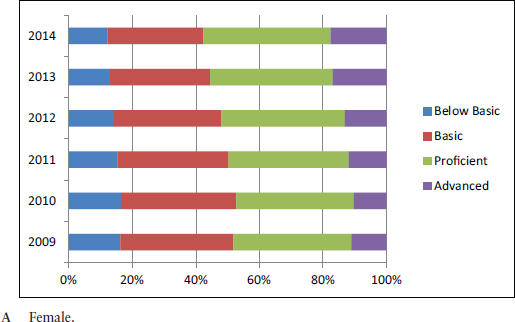
FIGURE F-5 (A-I) Percentage at each performance level for student groups, summarized across grades: DC CAS math.
SOURCE: Data from LearnDC at http://www.learndc.org [March 2015].
This page intentionally left blank.


