
The ultimate goal of the Public Education Reform Amendment Act (PERAA)—and the strategies adopted by the city as it implemented the law—was to improve outcomes for students in the city’s public schools. The committee was asked to evaluate whether valued outcomes were attained overall and for diverse schools and students. We had planned to examine a wide range of outcomes for students but that was not possible because of lack of data. The only indicators of student progress that we could use were test scores and graduation rates. Although we had access to data about performance on college entrance exams, we had questions about their accuracy and validity. We specifically looked for data on postsecondary outcomes, such as workforce participation or college enrollment, but this information was not available.
In this chapter we discuss test score data from the District of Columbia Comprehensive Assessment System (DC CAS) and the National Assessment of Educational Progress (NAEP) and graduation rates. Psychometric information about DC CAS was available in technical reports prepared by the city’s test development contractor, CTB/McGraw-Hill. DC CAS performance data were also available in technical reports and on city websites, such as LearnDC. The Education Consortium for Research and Evaluation (DC-EdCORE) also conducted analyses and prepared a report on student achievement (Education Consortium for Research and Evaluation, 2014c). These analyses examined changes in DC CAS scores over time, controlling for changes in the demographic characteristics of student cohorts from year to year (discussed below). Graduation rates were provided by the city and have also recently been added to the LearnDC website. They are
also available from the Common Core of Data of the National Center for Education Statistics.
STUDENT ACHIEVEMENT: DC CAS DATA
DC CAS was the foundation for the city’s accountability system from 2006, before PERAA, until 2014, when the city made its transition to the Partnership for Assessment for Readiness for College and Careers (PARCC), an assessment that is aligned with the Common Core State Standards (CCSS).1 The DC CAS assessment consisted of tests in reading, mathematics, science, and composition. The reading test was given to students in grades 2-10, and the mathematics test was given to students in grades 2-8 and 10.2 The tests of science and composition were given once in each grade span (elementary, middle, and high school).3 For science, elementary students took the test in grade 5 and middle school students did so in grade 8. High school students took a biology test during the school year in which they took a biology course. The composition assessment was given in grades 4, 7, and 10.
The reading, mathematics, science, and biology tests consisted of multiple-choice and constructed-response questions that were administered under standardized conditions. The composition test consisted of a single essay prompt designed to measure three dimensions: in grades 4 and 10, those dimensions were (1) topic development, (2) language conventions, and (3) understanding literary text. In grade 7, the first two dimensions were the same, and (3) was understanding of informational text.
Multiple-choice questions were scored electronically. Constructed-response questions and the essay for the composition test were scored by readers hired by the testing contractor. The composition test was scored three separate times, using three separate scoring rubrics that each covered one of the dimensions of the text.
The test results were reported on a 100-point scale, with the score scale increasing in 100-point increments across grades. That is, the score range for grade 2 was 200 to 299, for grade 3 it was 300 to 399, and so on to a maximum of 900 to 999 for the highest grade in which the test was given. Scaled scores were grouped into four performance levels: below basic, basic, proficient, and advanced. The cut scores for each level were determined using standard-setting procedures.4
________________
1PARCC tests cover mathematics and English-language arts; see Chapter 5. Also see http://osse.dc.gov/service/dc-cas [January 2014].
2Assessments for grade 2 began in 2013. In 2011, reading was expanded to grade 9 as well.
3These tests are also being replaced: see http://osse.dc.gov/service/dc-cas [February 2015].
4A cut score is the level that marks the difference between any two performance levels, such as proficient and advanced. For details, see, for example, CTB/McGraw-Hill (2012, p. 49; 2013, p. 48).
The transition to the new standards has been gradual. When DC CAS was first introduced in 2006, the questions were developed to be aligned with the city’s content standards. The district replaced those standards with the CCSS in 2010 and began the process of adjusting the DC CAS reading and mathematics tests to align with the new standards. By spring 2012, questions on the DC CAS reading test were fully aligned to the CCSS. Questions on the DC CAS mathematics test were partially aligned in 2012 and fully aligned in 2013.5 Although the city and its test development contractor, CTB/McGraw-Hill, made efforts to maintain the comparability of the tests during this transition, it is important to keep these changes in mind when comparing trend data.
Since the DC CAS test scores are the data that have been used for a number of high-stakes decisions in the district (e.g., measures of adequate yearly progress,6 teacher evaluation) as well as to monitor trends, it is important to examine the tests’ psychometric qualities to determine if the scores have provided reliable and valid evidence to support the decisions based on them. That is, did the tests measure what they were intended to measure? Were the technical and statistical aspects of test design handled in a way that would support inferences about student achievement growth and estimates of the value added by teachers?
Technical Features of DC CAS
As is standard practice for large-scale testing programs, technical reports were prepared after each administration to document psychometric details about the test. The city contracted with CTB/McGraw-Hill to handle test development and analysis for the DC CAS and contractor staff wrote the technical reports. The city provided us with the technical reports for the test administrations in 2009-2013, but not the one for 2014.7
The DC CAS technical reports generally contain the information typically found in such reports. A useful feature of the DC CAS reports is that they connect the information provided to the requirements specified in the version of the Standards for Educational and Psychological Tests
____________________
5The partial alignment was accomplished by (1) comparing the D.C. standards with the CCSS and identifying the areas of overlap; (2) using questions that measured the standards that overlapped as well as the other D.C. standards that were not in the CCSS; and (3) not measuring standards that were unique to CCSS (i.e., not in the D.C. standards). The plan was to eventually adopt these changes into both instruction and assessment.
6Adequate yearly progress is a standard for improvement in standardized test scores established in the federal No Child Left Behind Act (NCLB) of 2002, which is a gauge of the performance of individual schools and districts.
7Most of the reports are available at http://osse.dc.gov/publication/dc-cas-technical-reports [January 2015]. We requested the 2014 manual from OSSE but did not receive it.
that was current at the time (American Psychological Association et al., 1999).8 A thorough evaluation of the technical aspects of DC CAS is beyond our charge, but we note that the reports provide detailed information about item development and assembly of test forms, evidence of reliability and validity, scaling and equating procedures, analyses of differential item functioning (bias), standard setting, and results. However, there are several issues that we highlight because they affect the types of inferences that can be made from the results.
Comparability of Scores
As is typical for state assessments, DC CAS scores were statistically “equated”9 so that the scores for a certain subject in a certain grade could be compared across years. For example, results for grade 4 reading in 2006 are on the same scale as grade 4 reading in 2007, and so on for subsequent years. This procedure is called “horizontal equating” (or horizontal linking) and supports comparisons, for example, between one year’s 4th graders’ performance on a given test and that of another year’s 4th graders.
It is important to note that the way the scores were linked does not support comparisons of an individual student’s score from one grade to the next (e.g., a student’s score in 4th-grade reading to his or her score in 5th-grade reading). There is another type of linking, called vertical linking, that would support such comparisons. This type of linking was not used for DC CAS, although the nature of the score scale (increasing in 100-point increments across grades) seems to suggest that it does.10 Simply calculating the difference between a 3rd-grade score and a 4th-grade score does not yield meaningful information.
________________
8A new version of these standards was recently released (American Educational Research Association et al., 2014), so future technical reports are expected to be aligned with these revised standards.
9“For any two tests, a link between their scores is a transformation from a score on one to a score on the other. Equating is one type of linking that comes with strong assumptions. The purpose of equating is to allow the scores from the two tests to be used interchangeably, as if they had come from the same test. Equating requires that the tests must measure the same construct at the same level of difficulty and with the same degree of accuracy” (Holland and Dorans, 2006, pp. 187, 193).
10The DC CAS was designed so that two tests of the same subject matter developed for different grades (e.g., reading tests for grades 4 and 5) would be considered as measuring similar constructs with the same level of accuracy, but varying in their difficulty. Those for the lower grade would be designed to be easier than those for the higher grade. In this situation, the tests do not meet the requirements for equating. If the designers of DC CAS had put scores onto a common overall scale so that progress could be tracked across years, it would have been done through the statistical procedure called vertical linking (Holland and Dorans, 2006, p. 192).
Issues with the Composition Test
The DC CAS composition test consisted of a single sample of student writing, an essay that received three scores (one for each dimension of the assessment domain covered; see above). Research shows that scores based on such a limited example of a student’s writing skills tend to have low reliability (see Lane, 2006). The contractor’s technical report provides estimates of score reliability, but they are based on rater agreement: that is, the estimates reflect the extent to which scores generalize across raters. They do not provide information about the extent to which scores generalize across tasks or prompts (the likelihood a student would receive the same score on a written response to a different prompt); variability across prompts is generally considered a greater source of measurement error than variability across raters (Lane, 2006). There is no evidence in the technical reports of how comparable the prompts are to one another. Thus, changes in scores across time may reflect differences in the characteristics of the prompts (such as in their difficulty) or in the rhetorical tasks required, as well as in test takers’ proficiency in writing.
Another issue is that in 2012 two changes were made to the test (CTB/ McGraw-Hill, 2012, p. 49). One change was that the pool of writing prompts was refreshed with new prompts. No data are provided on the extent to which these prompts are comparable to the prior ones, and thus comparisons from 2011 or earlier to 2012 or later are questionable.
The second change was in the procedures used to determine scale scores for the composition test. Prior to 2012, the score for composition was a simple sum of the scores from the two rubrics, and the cut scores for the performance levels were based on this scale. In 2012, the city implemented procedures to adjust for differences in the difficulty level of the essay prompts given from one year to the next. They did this by using questions on the reading test.11 This procedure is used by other testing programs when more standard kinds of linking are not possible, but it is not ideal. The consequence is that the composition score reflects a student’s achievement in reading as well as in writing. These limitations should be kept in mind when making inferences about the composition scores and tracking scores across time (i.e., comparing results from before 2012 with later ones).
________________
11For a number of reasons, it is not possible to use the same kinds of linking procedures for a test that consists of a single essay prompt as are used for tests with multiple prompts or questions. Because skills in reading and writing are interrelated, test developers sometimes use the reading questions to help scale the scores on a written essay prompt. In this case, the readin uestions serve as an “anchor set” of uestions for scalin the writin score
Interpreting Performance Trends
The committee identified three issues related to interpreting score trends. When students leave or enter the system, the resulting changes in the composition of the group taking the test can produce changes in test scores that are confounded with those caused by changes in students’ learning. That is, simple comparisons of achievement for two cohorts (i.e., comparing those in 4th grade one year with those in 4th grade the previous year) can be affected by differences in the demographic composition of the two cohorts.
Demographic change is an issue for all cross-cohort comparisons, but it is especially important in D.C., which has had a highly mobile and changing student population in the years since PERAA (Tatian and Lei, 2013). DCPS enrollment decreased and then stabilized, while charter school enrollment went up significantly (see Chapter 2). The percentage of students who are from economically disadvantaged families also may have fluctuated over the period we examined (see Chapter 2 for a discussion of the measures of economic disadvantage). Although researchers can adjust for some of the demographic changes in D.C., and the differential demographic changes for DCPS and the charter schools—for example, they can look at test score trends just for students from lower-income families of a given race or ethnic group—such adjustments do not capture all the differences in student and family characteristics over time and between school sectors. Although such adjusted measures are preferable to overall trend measures that do not attempt to account for differences in student background characteristics, their limitations need to be kept in mind. These comparisons are discussed below.
Second, the primary data point reported for DC CAS is the proficiency rate—the percentage of all students scoring at the proficient level or above—across grades. Although most states report a single overall proficiency rate by grade for groups of students (a requirement of NCLB), there are many downsides to focusing on a single point in the score distribution. The most obvious drawback is that reporting only the proficiency rate provides no information about the other parts of the score distribution. For example, if students improved from far below proficient to just below proficient, their gains would not be measured by changes in proficiency rates. There are other options for reporting that yield information about the full distribution of scores, such as the mean and standard deviation of the scale scores, the scores associated with the quintiles in the distribution (20th, 40th, 60th, 80th percentiles), or even the percentage scoring at each performance level. If more than one of these summary measures is reported the results can be better understood.
Third, in 2009 there were numerous allegations of cheating on the DC CAS, and the reported gains in test scores were questioned. The city inves-
________________
12See http://www.documentcloud.org/documents/73991-day-three-documents#document/ p53 [January 2015].
BOX 6-1
Test Security Issues with the DC CAS
Beginning in 2011, public attention increasingly focused on the possibility that significant violations of test security may have compromised administrations of the DC CAS, with attention particularly focused on the 2009 results. As the committee began examining the use of DC CAS results in our evaluation, we became concerned that such compromises might affect our ability to make inferences from the test scores. We therefore requested information from the city about the alleged violations and the city’s response, and we also looked for other sources of information. We held a public meeting in 2012, at which we heard from a journalist who had investigated serious violations in the Atlanta public schools; the Director of Testing Integrity at the Educational Testing Service, who described best practices for preventing security violations; and an assessment expert who has studied means of investigating and resolving possible violations.
D.C. did not provide us with complete documentation of the magnitude of the possible violations, but from what we could determine and what OSSE officials told us, the alleged violations were likely not widespread enough to have affected citywide scoring levels, which removed the primary reason for our concern. OSSE officials told us about new test security measures that have been introduced in D.C. schools, which are available on their website.a
We note that evidence from around the country, for example, as reported by the Atlanta Journal Constitution and USA Today, suggests that cheating on high-stakes tests is a widespread and a serious problem.
________________
aSee http://osse.dc.gov/service/test-security-and-incident-forms [March 2015]. For a comprehensive set of documents related to the allegations, see http://www.documentcloud.org/documents/73991-day-three-documents#document/p53 [February 2015].
tigated the allegations and conducted analyses of the scores in question.12 After that investigation, all of the questions that were administered in 2009 were eliminated from further use (CTB/McGraw-Hill, 2010). There was no clear resolution to the allegations, and we were not able to form independent conclusions about what took place. However, the city subsequently took a number of steps to improve test security: Box 6-1 summarizes the committee’s efforts to understand this situation.
________________
12See http://www.documentcloud.org/documents/73991-day-three-documents#document/ p53 [January 2015].
Performance Trends: Overview
With this context in mind, we turn to a detailed look at the DC CAS results.13Figure 6-1 shows the percentage of students in D.C. who scored at or above the proficient level between 2009 and 2014 for reading and math. From 2009 to 2012, the proficiency rate for reading remained between 45 and 46 percent and then increased to 49 percent in 2013 and to 50 percent in 2014. In math, the proficiency rate showed steady improvement, from 46 percent in 2009 to 55 percent in 2014.
This kind of presentation can be a useful tool for communicating some information about the overall performance of the city’s schools. However, when only the proficiency rate is reported and rates are aggregated across grades, the information is at a level that is too high to be useful in making policy or instructional decisions, and it can mask important achievement patterns or gaps (Holland and Dorans, 2006). To be useful, the data reported should include, at a minimum, the percentage of students scoring at each performance level, as well as the average and standard deviation of scale scores. The data should also be disaggregated by grade level and by various population groups.
Figure 6-2 provides an example of more detailed trend data. It shows the percentage of students who scored at each performance level for reading for 2009-2014. Progress in reading achievement has been slow (as has been the case in other states): the percentages of students scoring below basic and basic have decreased and the percentages scoring in the proficient level have increased, but there was little growth in the percentages at the advanced level.
In contrast, there has been fairly steady progress in math achievement, with fewer students scoring in the basic and below basic categories each year and increasing numbers scoring in both the proficient and advanced categories: see Figure 6-3. For the composition test, there was no clear pattern across grades and years: see Figure 6-4. In addition, for the composition test, there was a distinct difference in the distribution for 2011 in comparison with 2012 and 2013, most likely because of the addition of new prompts and the change in the way the composition scores are scaled (see discussion above).
Figure 6-5 shows the percentage of students who scored at each performance level in reading by gender and race and ethnicity and by status as economically disadvantaged, as an English-language learner, and as a student with a disability. Figure 6-6 shows similar information for math. There are stark differences in the performance distribution across the vari-
____________________
13For an example, see http://www.learndc.org/schoolprofiles/view?s=dc#reportcard [February 2015].
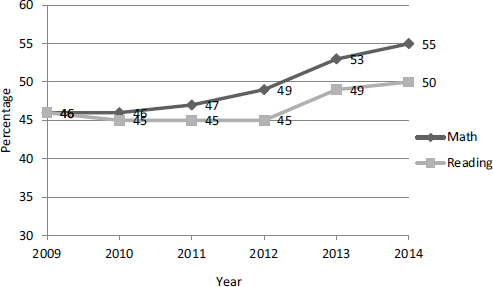
FIGURE 6-1 Percentage of students who scored proficient and above on DC CAS reading and math: 2009-2014.
SOURCE: Data from Office of the State Superintendent of Education (2014a).
ous population groups in both subjects, as can be seen in a comparison of the percentages of black students in the lower two categories (below basic and basic) to the percentages of white students in those categories. Furthermore, within most groups there was very little change in the score distributions over time.
Analysis of average, cross-grade trends across the city’s eight wards showed similar broad patterns, with reading gains concentrated in the first few post-PERAA years and modest gradual improvement in math across all wards.
Appendix F provides additional details about performance on DC CAS.
Performance Trends: By School Sector and Students’ Characteristics
Looking at outcomes by school sectors, Figures 6-7 and 6-8 show proficiency rates in reading and math, respectively, for DCPS and charter school students from 2007 through 2014. For that period in both sectors, data from OSSE show increases in the percentage of students scoring proficient or above.14 In math, the proficiency rate for DCPS students increased
____________________
14See http://osse.dc.gov/sites/default/files/dc/sites/osse/publication/attachments/2014%20DC%20CAS%20Result%20July%2031%202014...FINAL_.pdf [February 2015].
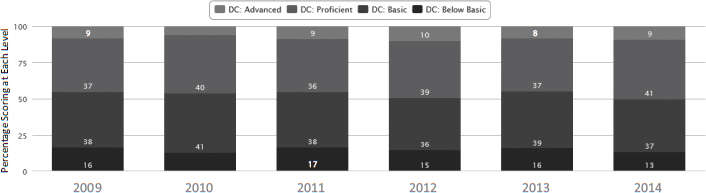
FIGURE 6-2 Percentage of students who scored at each performance level on DC CAS reading: 2009-2014.
SOURCE: Data from LearnDC at http://www.learndc.org [May 2015].
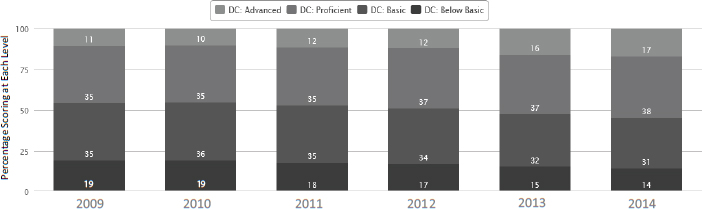
FIGURE 6-3 Percentage of students who scored at each performance level on DC CAS math: 2009-2014.
SOURCE: Data from LearnDC at http://www.learndc.org [May 2015].
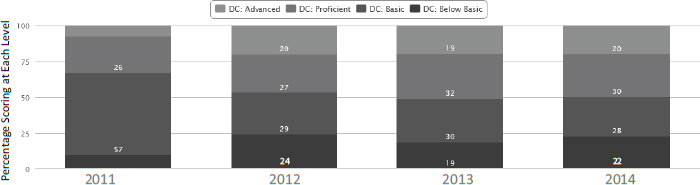
FIGURE 6-4 Percentage of students who scored at each performance level on DC CAS composition: 2011-2014.
SOURCE: Data from LearnDC at http://www.learndc.org [May 2015].
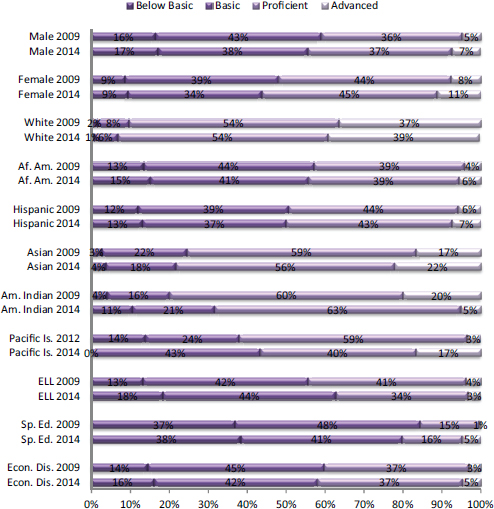
FIGURE 6-5 Percentage of student groups scoring at each performance level for DC CAS reading 2009 and 2014.
SOURCE: Data from LearnDC at http://www.learndc.org [May 2015].
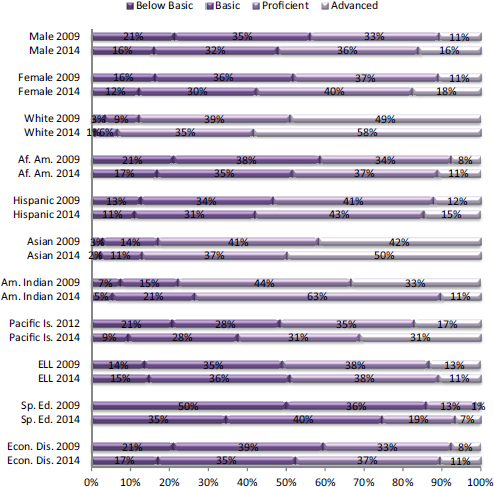
FIGURE 6-6 Percentage of student groups scoring at each performance level for DC CAS math 2009 and 2014.
SOURCE: Data from LearnDC at http://www.learndc.org [May 2015].
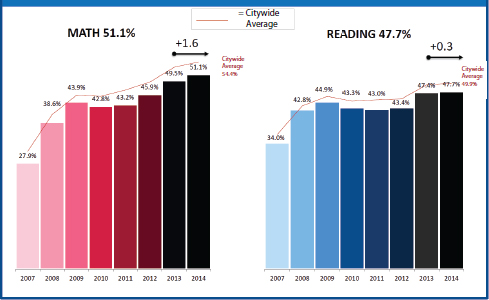
FIGURE 6-7 Percentage of DCPS students who scored proficient or above on DC CAS math and reading, compared to the percentage for all public schools’ students in the city: 2007-2014.
SOURCE: Office of the State Su erintendent of Education (2014a)
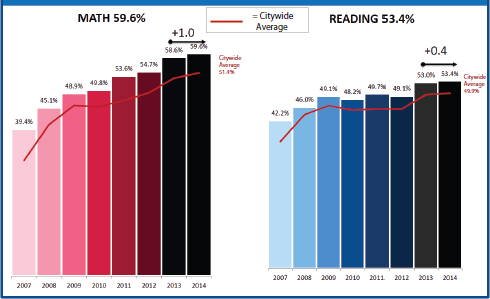
FIGURE 6-8 Percentage of charter school students who scored proficient or above on DC CAS math and reading, compared to the percentage for all public schools’ students in the city: 2007-2014.
SOURCE: Office of the State Superintendent of Education (2014a).
from 27.9 percent to 51.1 percent (see Figure 6-7); the proficiency rate for charter school students increased from 39.4 percent to 59.6 percent (see Figure 6-8).
Gains in reading were smaller for the 2007-2014 period. For DCPS students, the proficiency rate increased from 34.0 percent to 47.7 percent. However, as can be seen in Figure 6-7 (above), progress in the proficiency rate was fairly flat between 2008 and 2012, and then increased from 43.4 percent in 2013 to 47.7 percent in 2014. The proficiency rate for charter school students showed the same pattern, as shown in Figure 6-8 (above), but starting with a higher rate: the proficiency rate was 42.2 percent in 2007, 53 percent in 2013, and 53.4 percent in 2014.
Thus, despite some evidence of improvement over time, DCPS students consistently perform below the citywide average in both subjects; public charter school students consistently perform above the citywide average in both subjects.
To further explore these differences, we compared the outcomes for DCPS and charter schools students on the DC CAS reading test by various characteristics. We were only able to obtain these data for 2 years, 2013 and 2014. Table 6-1 shows the percentage of students in each group who
TABLE 6-1 Percentage of Students Who Scored Proficient or Above in Reading on DC CAS, by Students’ Characteristics and School Sector, 2013 and 2014
| State | DCPS | Charter | ||||
| Group | 2013 | 2014 | 2013 | 2014 | 2013 | 2014 |
| All | 49.5 | 49.9 | 47.4 | 47.7 | 53.0 | 53.4 |
| Female | 55.5 | 56.0 | 53.4 | 53.7 | 58.9 | 59.2 |
| Male | 43.6 | 43.9 | 41.8 | 41.6 | 46.8 | 47.3 |
| Asian | 74.1 | 78.4 | 73.1 | 78.2 | 77.3 | 79.0 |
| African American | 43.7 | 43.8 | 38.7 | 38.5 | 50.5 | 50.5 |
| Hispanic | 52.2 | 50.0 | 51.1 | 48.6 | 54.7 | 52.5 |
| Mixed Race | 80.2 | 83.1 | 82.8 | 83.7 | 75.0 | 81.9 |
| White | 91.8 | 92.1 | 92.0 | 91.6 | 91.1 | 93.9 |
| Economically Disadvantaged | 42.1 | 41.9 | 37.7 | 36.5 | 48.4 | 49.1 |
| English-Language Learner | 39.6 | 37.3 | 36.8 | 36.3 | 44.6 | 39.1 |
| Special Education | 19.3 | 19.7 | 18.2 | 17.6 | 21.3 | 22.7 |
NOTE: This table excludes two groups due to small numbers: Native Hawaiian/Pacific Islander and American Indian/Native Alaskan.
SOURCE: Office of the State Superintendent of Education (2014a, p. 16).
scored proficient or above for all D.C. students and by sector. The comparable data for math is shown in Table 6-2.
The information in these graphs suggests differences in performance across the two sectors. For DCPS students, the average change in the proficiency rate from 2013 to 2014 for reading was negative for all groups except Asians, females, and mixed-race students. The decreases ranged from –0.2 for blacks and males to –2.5 for Hispanic students. Among charter school students, only two groups lost ground between 2013 and 2014: Hispanic students (–2.2) and English-language learners (–5.5). The proficiency rate increased for all other groups except blacks, for whom there was no change.
For math, most of the changes in proficiency rates were positive for both sectors. Among DCPS students, all groups showed increases in proficiency rates except Asians (no change) and special education students (–0.1). Among charter school students, all groups showed increases except whites (–0.3), Hispanics (–2.3), and English-language learners (–5.1).
Of particular note in these figures is the proficiency rate for black and economically disadvantaged students enrolled in DCPS. For both groups, roughly 60 percent scored below proficient in both subjects. Although there have been some small improvements over the years, these results are
TABLE 6-2 Percentage of Students Who Scored Proficient or Above in Math on DC CAS by Students’ Characteristics and School Sector, 2013 and 2014
| State | DCPS | Charter | ||||
| Group | 2013 | 2014 | 2013 | 2014 | 2013 | 2014 |
| All | 53.0 | 54.4 | 49.5 | 50.9 | 58.6 | 59.6 |
| Female | 55.5 | 57.4 | 52.2 | 54.3 | 60.4 | 61.8 |
| Male | 50.6 | 51.5 | 47.0 | 47.6 | 56.6 | 57.3 |
| Asian | 86.0 | 86.6 | 85.8 | 85.8 | 87.5 | 89.5 |
| African American | 47.1 | 48.1 | 40.1 | 40.8 | 56.2 | 57.3 |
| Hispanic | 58.6 | 58.3 | 57.4 | 58.0 | 61.0 | 58.7 |
| Mixed Race | 82.7 | 85.9 | 84.5 | 87.0 | 79.1 | 83.8 |
| White | 91.0 | 92.0 | 91 | 92.2 | 91.3 | 91.0 |
| Economically Disadvantaged | 46.2 | 47.4 | 40.4 | 40.9 | 54.5 | 56.1 |
| English-Language Learner | 50.2 | 49.4 | 48.3 | 49.9 | 53.7 | 48.6 |
| Special Education | 24.0 | 24.3 | 20.5 | 20.4 | 29.4 | 29.9 |
NOTE: This table excludes two groups due to small numbers: Native Hawaiian/Pacific Islander and American Indian/Native Alaskan.
SOURCE: Office of the State Superintendent of Education (2014a, p. 16).
disturbing. Students in these groups who attend charter schools fare slightly better: about 50 percent score below proficient in reading and about 40 percent do so in math. It is important to note again that these findings cannot be interpreted causally; that is, one cannot infer from the data that these groups perform better when enrolled in charter schools because there have been demographic shifts in the enrollments for charter and DCPS schools that may also have influenced average performance.
In addition to examining trends over time, we also reviewed the results from a study conducted by EdCORE researchers that examines performance after adjusting for demographic shifts in the cohorts being compared (Education Consortium for Research and Evaluation, 2014c). Using regression-based procedures, this analysis compared score trends from 2006-2007 to 2012-2013 overall and for different groups of students.15 These analyses generally show that there is an upward trend in math achievement, with students in later years outperforming students at the same grade level in earlier years. Specifically, students in later years outscore their peers who were at the same grade level in 2006-2007 in math (by about 0.18 to 0.43 of the standard deviation). In reading, however, achievement improved in 2007-2008 and then remained almost unchanged until 2012-2013, when there was an increase.
The EdCORE comparisons of performance by student groups showed the following:
- Test scores have improved for both economically advantaged and disadvantaged students. These gains are much larger for economically advantaged students.
- Test scores have improved for all major racial and ethnic groups in the city (blacks, Hispanics, whites), with larger improvements among blacks and Hispanics.
- Test scores have improved more among economically advantaged black students than other groups. Black females showed higher gains in reading than their male peers; males and females performed at comparable levels in math.
The EdCORE analyses by sector also showed that, although both DCPS and charter students showed improvement, the magnitude of the gains were higher for DCPS students in every year. To further explore this finding, the researchers compared score gains for students who switched sectors (changed from a DCPS to a charter school or vice versa) and those
____________________
15The methods include observed student covariates and school fixed effects. The results are reported in standard deviation units (proportion of a standard deviation on the test). For details, see Education Consortium for Research and Evaluation (2014c).
who remained in the same sector (Education Consortium for Research and Evaluation 2014c). Score gains were consistent across the two groups.
The EdCORE report cautions that this finding does not necessarily mean that the charter schools have lower-performing students. Some students start and stay in charter schools, some move from a DCPS to a charter school, some move from a charter to a DCPS school, and some start and stay in a DCPS school. Students who are not successful in one sector may be more likely to move to another. More information is needed to fully understand these results.
The EdCORE researchers note two caveats about drawing conclusions from these analyses. The first is that changes in student performance trends that predated PERAA, changes in the composition of the student population for which they were unable to control, or other changes may have influenced the trends.16 For example, they note that D.C. saw an influx of higher-performing students during the trend years analyzed, and the extent to which these new students account for gains is not completely clear. The second is that the first year studied, 2006-2007, was the first year the DC CAS was given, so some improvement may be accounted for by students’ and teachers’ growing familiarity with its format and expectations. The city would benefit from having even more detailed analyses to better understand the trends. For example, if the performance of student groups was also analyzed by income level or by ward, the results might help the city see important patterns.
The EdCORE report’s authors (Education Consortium for Research and Evaluation, 2014c) concluded from this analysis that the positive trends in student performance may not be completely attributable to changes in the composition of the student populations. Further study of these questions would be useful to the city.
STUDENT ACHIEVEMENT: NAEP DATA
NAEP is an assessment administered by the U.S. Department of Education and overseen by the National Assessment Governing Board. NAEP has provided data on what students know and can do in math, reading, and other subjects since the 1960s and is often used as an external gauge of students’ achievement in the tested subjects that is independent of state achievement tests used for accountability purposes. NAEP differs from state achievement tests in that it is not given to every student every time it is administered, and NAEP scores are not reported for individual students.
____________________
16The researchers conducted an analysis of the possible role of changes in the demographic composition of the student population (Education Consortium for Research and Evaluation, 2014c, p. 18), but note that there are possible factors for which they did not control.
Instead, the assessment is given to a representative sample of students across the country, and scores are reported for the nation, states, and some urban districts.
One useful aspect of NAEP is that it is not a high-stakes test—that is, there are no consequences for students, teachers, or schools based on the test results—and so it is not subject to the pressures that often surround state tests. NAEP uses its own content frameworks for the subject areas in which it tests, and all students are measured against common performance expectations. Thus, the results can be compared across jurisdictions and also across time because of the steps taken to keep the assessments consistent year to year.17 The NAEP frameworks for reading and math are not aligned with any specific state’s content standards, and thus, results from NAEP and from DC CAS are not strictly comparable.
Since the early 1990s, D.C. has participated in NAEP as a state, and the NAEP scores reflect performance for all the city’s schools, including the charter schools. In 2002, NAEP implemented the Trial Urban District Assessment (TUDA), which uses a sampling design that allows reporting of reading and math results and comparison for large urban districts in the country. DCPS has participated in TUDA since 2003, when it was one of only a handful of participating urban districts (6 in reading and 10 in math), but this number increased to 21 urban school districts for 2013. However, there have been changes over time to the sampling design for the D.C.: in 2009, the city’s charter schools were eliminated from the TUDA sample, although they continue to be included in state NAEP results.18 The results presented below are from D.C.’s participation in state NAEP unless otherwise noted (see discussion in National Research Council, 2011, p. 67).
NAEP reports average scores on separate 0 to 500 scales in math and reading, as well as the percentages of students at each of its three achievement levels, basic, proficient, and advanced; the percentage scoring below basic is also reported. Figures 6-9 and 6-10 show the students’ mean scale scores in reading, for 4th-grade and 8th-grade students, respectively, from the first administration of NAEP through 2013. Figures 6-11 and 6-12 show similar data for math. Average scores for D.C. students are consistently lower than for students in other urban school districts for the nation. However, this gap is narrowing for 4th- and 8th-grade students in math and for 4th-grade students in reading; reading scores for D.C.’s 8th-grade students have remained constant.
________________
17Additional information about NAEP can be found at http://nces.ed.gov/nationsreportcard [February 2015].
18As of 2009, only schools that are included in D.C.’s adequate yearly progress calculation for NCLB are included in the TUDA results; charter schools are not included in AYP calculations. Prior to 2009, charter schools were included in the TUDA sample.
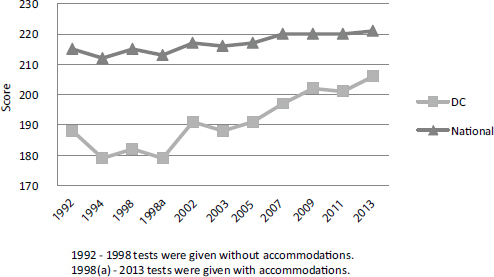
FIGURE 6-9 Mean scale scores on NAEP in reading for 4th-grade students for D.C. and nationally: 1992-2013.
SOURCE: Data from U.S. Department of Education, Institute of Education Sciences, National Center for Education Statistics (2013a).
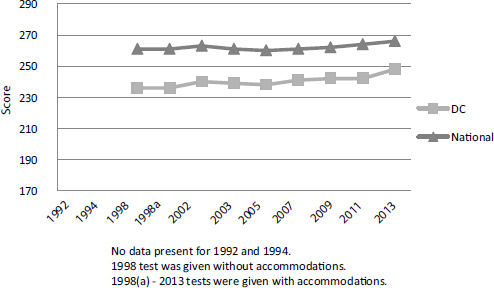
FIGURE 6-10 Mean scale scores on NAEP in reading for 8th-grade students for D.C. and nationally: 1992-2013.
SOURCE: Data from U.S. Department of Education, Institute of Education Sciences, National Center for Education Statistics (2013b).
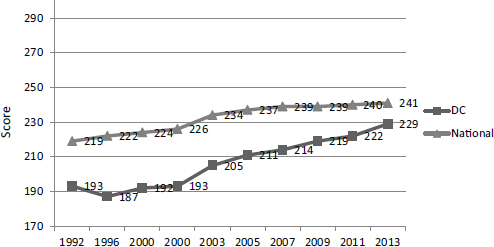
FIGURE 6-11 Mean scale scores on NAEP in math for 4th-grade students for D.C. and nationally: 1992-2013.
SOURCE: Data from U.S. Department of Education, Institute of Education Sciences, National Center for Education Statistics (2013a).
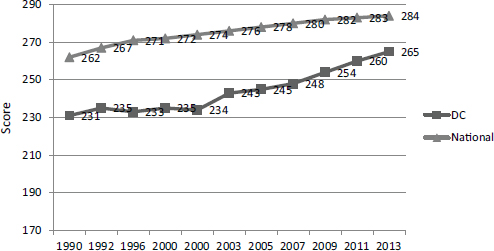
FIGURE 6-12 Mean scale scores on NAEP in math, for 8th-grade students for D.C. and nationally: 1992-2013.
SOURCE: Data from U.S. Department of Education, Institute of Education Sciences, National Center for Education Statistics (2013b).
Figures 6-13 and 6-14 show, respectively, the percentage of D.C.’s 4th- and 8th-grade students at each achievement level in reading from the earliest year available through 2013, and Figures 6-15 and 6-16 show similar data for math. Our focus in the rest of this section is on changes from 2007 to the present.
Reading Performance
In 4th-grade reading, the distribution shows a trend of steadily improving performance: see Figure 6-13. On a year-to-year basis, there was a gradual shift of students from the below basic level to the basic, proficient, and advanced performance levels. In 2007, only 39 percent of students had
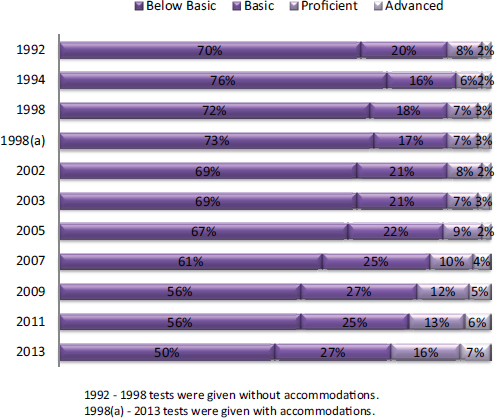
FIGURE 6-13 Percentage of D.C.’s 4th-grade students at each NAEP achievement level in reading.
SOURCE: Data from U.S. Department of Education, Institute of Education Sciences, National Center for Education Statistics (2013a).
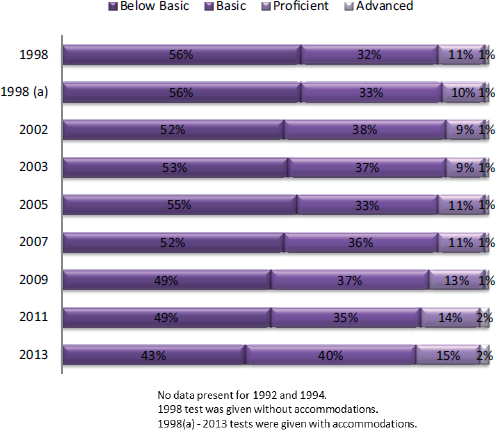
FIGURE 6-14 Percentage of D.C.’s 8th-grade students at each NAEP achievement level in reading.
SOURCE: Data from U.S. Department of Education, Institute of Education Sciences, National Center for Education Statistics (2013b).
scored basic or above; by 2013, it had increased to 50 percent. We highlight the following results:19
- The average scale score for D.C. students in 2013 was 206. Although it was lower than the average for the nation (221) and for large cities that participate in TUDA (212), it was an increase from 2007 (197) (see Figure 6-9, above).
________________
19See state snapshot at http://nces.ed.gov/nationsreportcard/subject/publications/stt2013/pdf/2014464DC4.pdf [January 2015].
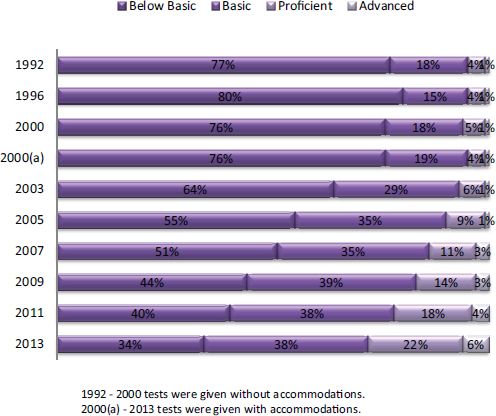
FIGURE 6-15 Percentage of D.C.’s 4th-grade students at each NAEP achievement level in math.
SOURCE: Data from U.S. Department of Education, Institute of Education Sciences, National Center for Education Statistics (2013a).
- The percentage of students scoring at or above proficient increased from 14 percent in 2007 to 23 percent in 2013 (see Figure 6-13, above).
- When scores are compared for students grouped by race and ethnicity and eligibility for free or reduced-price lunches, large gaps are evident; this disparity has existed for at least as long as data have been available, since the early 1990s.
- — In 2013, the average for African American students was 62 points lower than for white students, and the average for Hispanic students was 51 points lower than for white students. Both gaps are not significantly different from those in 1992.
- — The average for students eligible for free or reduced-price lunches was 50 points lower than for those not eligible. This gap is wider than it was in 1998.
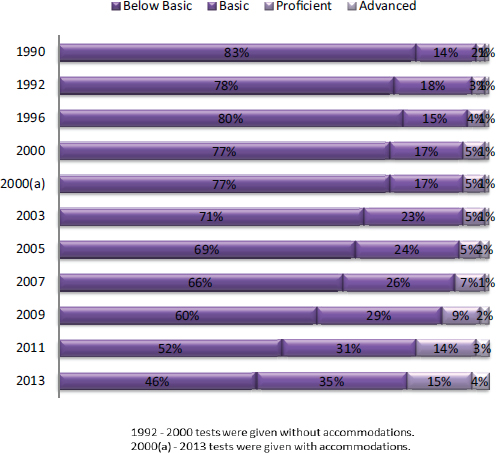
FIGURE 6-16 Percentage of D.C.’s 8th-grade students at each NAEP achievement level in math.
SOURCE: Data from U.S. Department of Education, Institute of Education Sciences, National Center for Education Statistics (2013b).
- It is also noteworthy that mean scale scores for white students in D.C. have been higher than those for white students nationwide: in 2009 they were 256 for D.C. students and 229 nationally; in 2011 they were 255 for D.C. students and 230 nationally; and in 2013, they were 259 for D.C. students and 231 nationally.20
In 8th-grade reading, year-to-year scores also improved, although the increases were small: see Figure 6-14. In 2007, 48 percent scored basic
____________________
20See http://nces.ed.gov/nationsreportcard/statecomparisons/ [February 2015].
or above; in 2013 the figure was 57 percent. We highlight the following results:21
- The average scale score for D.C. students in 2013 was 248. Although it was lower than the average for the nation (266) and for large cities that participate in TUDA (258), it was an increase from 2007 (241) (see Figure 6-10, above).
- The percentage of students scoring at or above proficient increased by only 1 percentage point between 2007 and 2013, from 17 to 18 percent (see Figure 6-14, above).
- When scores are compared for students grouped by race and ethnicity and eligibility for free or reduced-price lunches, large gaps are evident: this has been consistent over time.
- — In 2013, the average for African American students was 54 points lower than that for white students, and the average for Hispanic students was 49 points lower than that for white students.22
- — The average for students eligible for free or reduced-price lunches was 31 points lower than for those not eligible. This gap is not significantly different from the gap in 1998.
- As was the case for 4th-grade students in reading, the mean scale scores for white 8th-grade students in D.C. has been higher than those for white students nationwide: in 2011 they were 292 for D.C. students and 272 nationally, and in 2013 they were 297 for D.C. students and 275 nationally.
Math Performance
The distribution for 4th-grade students in math shows a clear pattern of year-to-year improvement. When the test was first given in 1992, less than one-quarter of students (23 percent) scored at the basic level or above; in 2007, the percentage had increased to just under half (49 percent), and in 2013, it was two-thirds (66 percent).
We highlight the following results:23
- The average scale score for D.C. students in 2013 was 229. Although it was lower than the average for the nation (241) and the average
________________
21See http://nces.ed.gov/nationsreportcard/subject/publications/stt2013/pdf/2014464DC8. pdf [January 2015].
22The gap could not be calculated in 1998 because there were too few white students.
23See http://nces.ed.gov/nationsreportcard/subject/publications/stt2013/pdf/2014465DC4. pdf [January 2015].
-
for large cities that participate in TUDA (235), it was an increase from 2007 (214) (see Figure 6-11).
- The percentage of students scoring at or above proficient increased from 14 percent in 2007 to 28 percent in 2013 (see Figure 6-15).
- When scores are compared for students grouped by race and ethnicity and eligibility for free or reduced-price lunches, large gaps are evident.
-
- — In 2013, the average for African American students was 55 points lower than that for white students, and the average for Hispanic students was 49 points lower than that for whites. Both of these performance gaps are similar to those observed in 1992.
- — The average for students eligible for free or reduced-price lunches was 41 points lower than for those not eligible; this gap was wider than it was in 1996.
- As was the case for reading, mean scale scores in math for white 4th-grade students in D.C. were higher than those for white 4th-grade students nationwide: in 2009 they were 270 for D.C. students and 248 nationally, in 2011 they were 272 for D.C. students and 249 nationally, and in 2013 they were 276 for D.C. students and 250 nationally.
The distribution for 8th-grade students also shows steady year-to-year improvement (see Figure 6-16). When the test was first given in 1992, only 17 percent of students scored at the basic level or above. This percentage increased to 34 percent in 2007 and to 54 percent by 2013.
We highlight the following results:24
- The average scale score for D.C. students in 2013 was 265. Although it was lower than the national average (284) and the average for other large cities that participate in TUDA (276), it was an increase from 2007 (248) (see Figure 6-12).
- The percentage of students scoring at or above proficient increased from 8 percent in 2007 to 19 percent in 2013 (see Figure 6-16).
- When scores are compared for students grouped by race and ethnicity and eligibility for free or reduced-price lunches, large gaps are evident.
-
- — In 2013, the average for African American students was 56 points lower than that for white students, and the average for Hispanic students was 52 points lower than that for whites.25
________________
24See http://nces.ed.gov/nationsreportcard/subject/publications/stt2013/pdf/2014465DC8. pdf [January 2015].
25The gap could not be calculated because there were too few white students.
- — The average for students eligible for free or reduced-price lunches was 35 points lower than for those not eligible; this gap was wider than it was in 1996.
- As was the case for 4th-grade students in math, mean scores for white 8th-grade students in D.C. were higher than those for white 8th-grade students nationwide: in 2011 they were 319 for D.C. students and 293 nationally; in 2013 they were 317 for D.C. students and 293 nationally.
We were able to obtain only quite limited data about performance on college entrance exams (SAT, ACT), and we could not be certain about the characteristics of students included in those data summaries. For example, we could not determine whether the summaries included private schools students residing in D.C. as well as those enrolled in public schools; whether all students were encouraged to take the exams, not just those who intended to go to college; or how repeat test takers and their scores were handled. In addition, there are discrepancies between the data provided by the city and those available from the two test sponsors (the College Board and ACT), and we were not able to resolve them. We judged that the information was not sufficient to support any firm conclusions about changes in D.C. students’ performance over time or any comparisons between students who attend DCPS schools and charter schools, and thus they are not included in this report.
For a sound evaluation, we would have needed such data as the following:
- participation rates based on the number of students who take the SAT or ACT in relation to those eligible to take it (e.g., the proportion of juniors who take one or both of the exams);
- the demographic characteristics of the test takers;
- participation rates by demographic groups (gender, race and ethnicity, socioeconomic status);
- comparison of participation rates across sectors, DCPS and charter schools, to evaluate the extent to which all students are taking advantage of the opportunity to pursue higher education; and
- detailed information about the distribution of test scores in addition to the average (the mean), such as standard deviations and quartiles.
In 2011, D.C. adopted a new method for calculating the graduation rate, called the adjusted cohort graduation rate, which is required by the U.S. Department of Education as part of NCLB. It is a more precise way to calculate the rate (see discussion in National Research Council, 2011), but the change made the rates prior to 2011 incomparable to those for 2011 and later. Thus, we are not able to track the rate from the time of the implementation of PERAA.
Table 6-3 shows the adjusted cohort rate for all students in D.C. (DCPS and charter school students) and by group for 2011 through 2014. The graduation rates are low—61 percent for all students in 2014. Some student groups have even lower rates: 54 percent for males, 53 percent for students eligible for free and reduced-price lunches, and just 40 percent for special education students.
The D.C. rates are of concern at a time when graduation rates have been rising in many places. Nationally, for 2012-2013, the overall rate increased from 78 to 81 percent; for blacks it increased from 66 to 68 percent, and for Hispanic students it increased from 71 to 76 percent. Large cities have also seen overall increases: for example, in Chicago the rate increased from 63 to 73 percent between 2010 and 2014; in Baltimore the rate increased from 66 to 74 percent between 2010 and 2012; and in New York City the rate increase from 69 to 70 percent between 2010 and 2012.26Table 6-3 also shows that the overall graduation rate in D.C. fluctuated from year to year: there was a decrease of 2 percentage points from 2011 to 2012; an increase of 5 percentage points from 2012 to 2013; and an increase of 1 percentage point from 2013 to 2014. Although there was a net gain of 2 percentage points between 2011 and 2014, one cannot really interpret this as a trend given the year-to-year fluctuations and how small the changes are.
Similar fluctuations are evident in the rates for most of the student groups. Between 2011 and 2014, there was a net gain for all groups except students classified as multiracial and those classified as economically disadvantaged. For multiracial students, the rate dropped each year, for a net loss of 14 percentage points (from 93 percent in 2011 to 79 percent in 2014). One possible reason for this noticeable change is that if the number of students in this group is small, it makes the total prone to significant fluctuations. The rate for students who are eligible for free and reduced-price
________________
26See http://nces.ed.gov/ccd/tables/AFGR0812.asp[May2015]; http://ccsr.uchicago.edu/publications/educational-attainment-chicago-public-schools-students-focus-four-year-collegedegrees [May 2015]; http://baltimore-berc.org/wp-content/uploads/2013/07/Collegereportjuly2013.pdf [May 2015]; and http://steinhardt.nyu.edu/scmsAdmin/media/users/sg158/PDFs/NYCGTC/Coca_NewYorkCityGoestoCollege_AFirstLook_Brief_Nov14.pdf [May 2015].
TABLE 6-3 Percentage of Adjusted Cohort Graduation Rates for All D.C. Students and by Group, 2011-2014
| Group | 2011 | 2012 | 2013 | 2014 | |
| All Students | 59 | 57 | 62 | 61 | |
| Race or Ethnicity | |||||
| American Indian/Alaskan Native | — | — | — | — | |
| Asian | 65 | 79 | 88 | 85 | |
| African American | 58 | 56 | 60 | 60 | |
| Hispanic/Latino | 52 | 52 | 63 | 62 | |
| Native Hawaii and Pacific Islander | — | 55 | — | — | |
| Multiracial | 93 | 91 | 89 | 79 | |
| White | 89 | 85 | 85 | 79 | |
| Gender | |||||
| Female | 65 | 65 | 69 | 68 | |
| Male | 53 | 48 | 54 | 54 | |
| Student Status | |||||
| Special education | 39 | 37 | 41 | 40 | |
| English-language learner | 53 | 50 | 52 | 64 | |
| Eligible for free or reduced-price lunch | 61 | 55 | 59 | 53 | |
SOURCE: Data from LearnDC, available at http://www.learndc.org/schoolprofiles [March 2015].
lunches has fluctuated somewhat, but there was a net loss of 8 percentage points from 2011 to 2014: in 2014 only slightly more than half of these students graduated (53 percent). This change may be related to changes in the criteria for classifying students as economically disadvantaged (see Chapter 2), but it clearly stands out.
The graduation rate for black students has fluctuated only slightly across the 4 years (showing a net gain of 2 percentage points); for both 2013 and 2014 was the lowest rate of any of the racial/ethnic groups. In contrast, the rate for Hispanics and Latinos showed a net gain of 10 percentage points from 2011 to 2014 (52 to 62 percent). Females graduate at a much higher rate than males, and this pattern is consistent across all the groups for all 4 years.
The outcomes we examined present a mixed picture of students’ achievement in D.C. The results from both DC CAS and NAEP since PERAA show noticeable improvement in math scores; there has been less progress in reading (as has been true in many states). Graduation rates in
the years since 2011 have fluctuated from year to year, with no discernable pattern; they remain low. Achievement remains low for students of low socioeconomic status, black and Hispanic students, and for English-language learners and students with disabilities.
The gap between the performance of white students and that of black and Hispanic students has not narrowed, as shown in both the DC CAS and NAEP data: for DC CAS, we could only measure the gap by comparing percentages of students who scored proficient or above; for NAEP, we could only compare scale score performance.
We could not determine performance gaps on DC CAS for students of low socioeconomic status, English-language learners, and students with disabilities because the city does not report data for the relevant comparison groups (e.g., students who are not in poverty, native English speakers, and students without disabilities). It is important to consider in relation to the teacher effectiveness ratings we discussed in Chapter 4 the fact that most teachers are rated as effective or higher while achievement remains low, which deserves investigation.
CONCLUSION 6-1 The percentage of all students scoring proficient or above in reading and math on the DC CAS increased between 2007 and 2014. The increase is larger for math than it is for reading. The positive trends are also apparent on NAEP.
CONCLUSION 6-2 There is a stark difference in the overall performance and score distributions among different groups of students. Black and Hispanic students, those with disabilities, those eligible for free or reduced-price lunches, and English-language learners are much more likely to be in the lowest performance categories than other students. Some improvement is evident since 2009, but more than half of these students still score below the proficient level. There is little indication that these performance differences are narrowing significantly.
CONCLUSION 6-3 Publicly available reports of DC CAS results often highlight only the overall proficiency rate—the percentage of students who score proficient or above. The proficiency rate provides only a quick overview of results. It does not reveal information about other changes in student performance, such as the percentage of students who score in each performance level or the percentage of students who score just below the proficient level. Proficiency rates can mask important changes in the performance of the lowest-scoring students and disparities in achievement among student groups, which are both important
for decision making. Additional measures—such as the percentage of students who score at each performance level and scale scores—are also needed for decision making.
We had planned to provide a very detailed picture of student outcomes that would help the city assess both how students have fared in the years since PERAA and the specific areas in which improvement is still needed. We would have liked to have more information with which to examine differences between DCPS and charter school students, such as more than 2 years of data disaggregated by student characteristics. We would also have liked to have data on other kinds of outcomes, particularly postsecondary outcomes such as workforce and college enrollment data. Such data were not available.
CONCLUSION 6-4 Graduation rates have fluctuated in the years since PERAA, with no clear discernible trend; this has occurred at a time when national rates have been increasing. The D.C. rates remain disturbingly low for black and Hispanic students, those with disabilities, those eligible for free or reduced-price lunches, and English-language learners.
CONCLUSION 6-5 The committee’s evaluation was limited to a few blunt measures—proficiency rates on standardized tests and high school graduation rates—because of lack of data. To better understand outcomes for D.C. students, the city needs to collect and make data available on the following topics:
- the percentage of students who score at each performance level and information on the scale scores, including the percentage of students who score at each scale score, means, standard deviations, percentiles, and quartiles;
- attendance and truancy;
- course-taking and completion;
- college entrance exam performance;
- college enrollment and progression, such as that available through the National Student Clearinghouse; and
- career outcomes, such as employment and earnings/salary.
These data should be provided in a format that makes them useful and accessible to researchers, educators, parents, and the public. The format should allow them to be analyzed by year, school, grade, racial and ethnic group, poverty status, and English-language learner and special education status, as well as by sector (charter and DCPS schools).


