
A major purpose of the Public Education Reform Amendment Act (PERAA) was to allow education leaders to make changes that they judged would improve educational opportunities for all students in the district. Acting on this new authority, the mayor (Adrian Fenty) and the new chancellor (Michelle Rhee) placed a high priority on improving teacher quality. The chancellor and her team pursued this goal by implementing a new teacher evaluation system, IMPACT, for the District of Columbia Public Schools (DCPS). IMPACT was intended to improve teacher quality by clarifying expectations, providing quality feedback and support, and retaining the most effective teachers.
The third part of the committee’s charge was whether the strategies used by city officials in implementing PERAA were informed by evidence, of sufficient scope and quality, and implemented well. We looked in depth at DCPS’s use of IMPACT to improve teacher quality because it was a prominent and early strategy adopted by DCPS. Because each charter school is an independent local education agency, the charter sector did not (and does not) have any overarching strategy to improve teacher quality (or any other factor in education). Thus, the analysis in this chapter applies almost exclusively to DCPS.
To evaluate DCPS’s strategy to improve teacher quality, we address four questions:
- Does the design of IMPACT reflect a reasonable theory of action for achieving the city’s goals? Does it reflect a sound argument
-
for the ways in which a teacher evaluation system would lead to improvements in teaching practices and student learning?
- Was there a clear plan for the implementation of IMPACT? To what extent did the implementation plan reflect the theory of action behind the system? That is, was the implementation plan true to the original design?
- How does DCPS use the information from IMPACT to provide feedback and support to teachers and to encourage effective teachers to stay? To what extent are these uses likely to bring about the desired changes?
- What have been the results so far for the educator workforce?
To explore these questions we relied on several sources. First, we commissioned two papers about the research and practice on which IMPACT was based. IMPACT consists of a teaching and learning framework to guide teachers, multiple evaluations based on observations of teachers’ practices and measures of student achievement, feedback and coaching mechanisms, a system of incentives (rewards and sanctions), and continuing professional development opportunities.
One paper was a review of publicly available information about the program, including guidelines and instructional materials for teachers and administrators, summaries of teacher performance data, and documentation about the ways IMPACT was to be implemented (Gitomer et al., 2014). For the most part, these materials were available on the city’s websites and in published materials, but additional information was obtained directly from the DCPS Office of Human Capital. In addition, however, Gitomer and colleagues had data resources that permitted a comparison of IMPACT with teacher evaluation programs in a sample of other states.1 This paper provides an in-depth review of the components of IMPACT and a comparison of the program with those in other states and with findings from relevant research.
The second paper was an assessment of one component of IMPACT, a measure of student gains on standardized achievement tests (Koedel, 2014). This measure is derived through a statistical procedure called value-added modeling (discussed below). Value-added modeling is complex and requires decisions about a number of technical issues; these decisions can affect the accuracy and stability of the results. We obtained documentation about
____________________
1The sample covered the District of Columbia and 17 states: Arizona, Colorado, Delaware, Florida, Georgia, Hawaii, Kentucky, Louisiana, Maryland, Massachusetts, New Jersey, New York, North Carolina, Ohio, Pennsylvania, Rhode Island, and Tennessee. The data were collected as part of another evaluation being conducted by the authors. All of the data were obtained from publicly available sources, primarily available through the respective states’ websites and associated reports.
the value-added procedures used for IMPACT and commissioned Koedel to review these procedures, compare them to best practices as documented in the research literature, and evaluate them in light of procedures commonly used by teacher evaluation programs in other states. This paper provides an in-depth evaluation of the city’s approach to deriving teacher value-added estimates.
We also reviewed the results from two studies conducted by the Education Consortium for Research and Evaluation (DC-EdCORE).2 One study examined trends in teacher retention and dismissal rates after IMPACT was implemented (Education Consortium for Research and Evaluation, 2014a); the other examined changes in student achievement associated with the dismissal of principals judged to be performing poorly (Education Consortium for Research and Evaluation, 2014b).
We supplemented this information by conducting formal interviews with three instructional superintendents. DCPS has nine instructional superintendents who each oversee a cluster of approximately 12 schools, providing guidance and leadership to principals. We sent invitations to all nine superintendents, and three responded and agreed to be interviewed.
The committee also reviewed relevant literature on the subject of teacher evaluation, including empirical research on value-added modeling, evaluations and critiques of value-added modeling procedures, empirical research and reviews of empirical research on conducting classroom observations of teachers, and articles about providing feedback and coaching to teachers.
The first section below reviews the design of IMPACT and the extent to which it represented a reasonable theory of action for achieving the city’s goals. The next section considers the implementation plan for IMPACT and includes our analysis of the various components for rating teachers’ effectiveness. The third section looks at the results of IMPACT to date. The fourth section discusses measures to improve principal quality. In the final section we offer our suggestions for improvements to IMPACT and other aspects of measuring and improving teacher quality in D.C.
Historically, teacher evaluation has received little attention in the United States. Although school leaders have always had the responsibility for evaluation, they spent little time in classrooms and produced very little variation in their evaluations. Teachers rarely received ratings other than satisfactory or excellent, and poor reviews tended to be given in response to professional lapses rather than poor teaching (The New Teacher Project, 2009).
__________________
2EdCORE subcontracted this analysis to Mathematica Policy Research; we note that Mathematica was also involved in the design of IMPACT.
Over the past decade or so, a growing body of research has demonstrated that teacher quality can make a significant difference in student achievement (e.g., Rockoff, 2004; Rivkin et al., 2005; Chetty et al., 2011, 2014b; George W. Bush Institute Education Reform Initiative, 2015). At the same time, the need for improvements in teacher evaluation—a key mechanism for identifying highly qualified, highly effective teachers who are likely to improve educational outcomes for students—has received increased attention. The classroom observations typically conducted by school administrators can be subjective and imprecise, in part because they usually involve a single observer and only one or two observations, and they can be affected by factors that are unrelated to teacher effectiveness (see, e.g., Harris, 2010; Harris and Anderson, 2013; Casabianca et al., 2014; Mihaly and McCaffrey, 2014). Thus, newer approaches have focused on more uniform data collection about teacher effectiveness, using both more structured and regular observations and a statistical approach called value-added modeling (VAM). This approach makes use of student test scores to try to isolate the effect a teacher has on student learning. VAM is often viewed as more objective than classroom observations because it is based on quantifiable student outcomes, rather than on judgments about what is good teaching. However, value-added approaches also have critics, in part because they rely on standardized test scores as a measure of student outcomes and do not capture other dimensions of learning.
The design of IMPACT started in 2007, soon after Michelle Rhee was appointed chancellor of District of Columbia Public Schools (DCPS). The project began with a year-long, information-gathering phase that included reviews of the research and meetings with stakeholders. The second phase was to develop the structure of the evaluation system; it was led by a design team that included human capital staff and other staff who were developing the district’s teaching and learning framework (see below). The design team held focus groups and sought input from teachers and other staff to develop the structure of the system (Curtis, 2011). The new evaluation system, IMPACT, was implemented in 2009.
The way in which IMPACT is intended to bring about improvements in the teaching force—that is, the underlying theory of action—is described on the DCPS website.3 The system uses a three-pronged approach designed to clarify expectations, provide quality feedback and support, and retain the most effective teachers (District of Columbia Public Schools, 2014b).
__________________
3See http://dcps.dc.gov/DCPS/In+the+Classroom/Ensuring+Teacher+Success/IMPACT+(Performance+Assessment)/An+Overview+of+IMPACT [October 2014].
Clarify Expectations
DCPS developed its own framework for characterizing effective instructional practices. DCPS officials and selected stakeholders (including parents, teachers, and community members) based their framework on a review of relevant documents developed by states and professional teaching organizations, observation protocols developed for research, teacher evaluation frameworks, and the scientific literature about research-based models for effective teaching. As they explain in a guide to the program (District of Columbia Public Schools, 2013a), D.C. school officials sought to develop a teacher practice framework that would be “a measure of instructional expertise” (p. 6) and would reflect the “school system’s definition of effective instruction, outlining key strategies which lead to increased student achievement” (p. 12).4 The resulting “Teaching and Learning Framework” was designed to (p. 12):
- communicate clear performance expectations for D.C. teachers,
- provide a common language for discussing teacher practice, and
- allow for alignment of professional development to teachers’ needs.
Provide Quality Feedback
City officials also sought to design a system in which teachers knew what was expected of them and understood the evaluation criteria. The teaching and learning framework was to be used as a means for communicating expectations as well as a guide for conducting classroom observations and providing feedback to teachers. The teaching framework was also a guide for developing the observation protocols and scoring rubrics that observers would use. The plan requires that teachers be observed multiple times during a school year and by multiple observers. To facilitate this, DCPS implemented a master educator program to recruit and train a pool of experts (teachers who have both expertise in relevant content and classroom experience) to conduct observations and provide support and mentoring to teachers. DCPS also required that observations be conducted both by school administrators and by master educators.
In addition, the city has developed a pool of instructional coaches, who provide support and feedback to teachers and the school leadership (District of Columbia Public Schools, 2014d). Coaches are tasked with analyzing data, designing professional development and support, and
____________________
4DCPS has developed numerous guides to aspects of IMPACT. Some were provided directly to us by DCPS staff; some were obtained by Gitomer and his colleagues in preparing their commissioned paper (see above); and some were available on the DCPS website. All the guides cited in this report are available in the public access file at the National Academy of Sciences.
facilitating teacher learning. They are trained in the teaching and learning framework and are encouraged to provide professional development to teachers about the instrument’s dimensions.
Retain Effective Teachers
The district designed IMPACT to provide incentives for teachers who receive high scores to remain with D.C. schools and to give school officials the means to sanction and dismiss teachers who score poorly. The evaluations provide a means for gathering evidence to support decisions about teacher compensation and employment. Through IMPACT, various types of information are collected and used to assign teachers to one of five possible effectiveness categories: “highly effective,” “effective,” “developing,” “minimally effective,” or “ineffective.”
The incentives are primarily monetary, but they also include advances on the career ladder (discussed below) that result in new responsibilities. The two possible sanctions are salary freezes and termination of employment. Teachers who are rated highly effective receive bonuses, and those with consecutive ratings of highly effective are eligible to receive increases in their base pay. Teachers who are rated as highly effective receive additional bonuses if they work in schools where at least 60 percent of students are eligible for free or reduced-price lunch. Teachers who are rated as ineffective in any year or as minimally effective for 2 consecutive years are dismissed. The “developing” category was added for the 2012-2013 school year. Teachers who score at this level for 3 consecutive years are also subject to dismissal [see Box 4-1].
Components of IMPACT
IMPACT is based on two types of measures: direct observations of teachers’ practices—both instructional techniques in the classroom and professional conduct outside of the classroom, and measures of gains in student learning based on achievement tests: see Table 4-1. There are three components of the direct observations:
- evaluations of teacher practice based on observations by school administrators and other trained professionals;
- a principal-assessed measure of the teacher’s collaboration with colleagues and support of school initiatives and programs (called “commitment to the school community”); and
- a principal-assessed measure of the teacher’s attendance, adherence to school policies, and professionalism (called “core professionalism”).
BOX 4-1
Rules for Dismissal of Teachers
- Teachers who receive a single rating of ineffective are subject to immediate dismissal.
- Teachers who receive the rating of minimally effective for 2 consecutive years are subject to dismissal.
- Teachers who receive the rating of developing for 3 consecutive years are subject to dismissal.
- Teachers who move up from minimally effective to developing have a third year to improve before being subject to dismissal. However, a principal may recommend dismissal earlier if there is additional evidence that the teacher is not improving or if performance is declining and is already below effective.
SOURCE: Education Consortium for Research and Evaluation (2014a).
TABLE 4-1 Components of the Overall IMPACT Score and Their Associated Weights, by School Year
| Weight on Component in School Year (%) | |||||
| 2001-2010 | 2010-2011 | 2011-2012 | 2012-2013 | ||
| Group 1: Teachers with a Value-Added Score | |||||
| TLF (observation) | 40 | 35 | 35 | 40 | |
| IVA score | 50 | 50 | 50 | 35 | |
| CSC | 5 | 10 | 10 | 10 | |
| TAS | — | — | — | — | |
| CP | Deduction | Deduction | Deduction | Deduction | |
| School value-added score | 5 | 5 | 5 | n.a. | |
| Group 2: Teachers Without a Value-Added Score | |||||
| TLF (observation) | 80 | 75 | 75 | 75 | |
| IVA score | — | — | — | — | |
| CSC | 5 | 10 | 10 | 10 | |
| TAS | 10 | 10 | 10 | 15 | |
| CP | Deduction | Deduction | Deduction | Deduction | |
| School value-added score | 5 | 5 | 5 | n.a. | |
NOTES: CP = core professionalism; CSC = commitment to the school community; IVA = individual value-added; TAS = teacher-assessed student achievement data; TLF = teaching and learning framework, which serves as a guide to observation protocols and rubrics; n.a. = not applicable because not in effect for the given year.
SOURCE: Education Consortium for Research and Evaluation (2014a, p. 5).
There are two measures of student learning:
- an estimate based on statistical value-added approaches, and
- an estimate based on data from assessments designed by teachers.
Only one measure of student learning is determined for each teacher, depending on the subject area and grade level that she or he teaches. General education teachers of math and of reading and English-language arts in grades 4 through 8 receive an “individual value-added” estimate, since standardized achievement test scores are available in these subject areas and grades.5 For other teachers, an alternative measure called the “teacher-assessed student achievement” estimate is calculated. Scores on the components are weighted unequally, as shown in Table 4-1, summed, and then classified into the performance categories.
We investigated the extent to which the implementation plan for IMPACT was consistent with the city’s goals and likely to bring about the desired changes. We commissioned a paper to review the implementation instructions and guidelines (Gitomer et al., 2014). The authors examined four elements: (1) how the observations are to be conducted, (2) how student growth measures are determined, (3) how the overall scores are calculated, and (4) the types of supports and professional development opportunities offered to teachers.
Components Based on Observations
Observations of Classroom Practice
DCPS uses its teaching and learning framework as the basis for observations and ratings of teachers’ practices. The framework covers three broad domains: plan, teach, and increase effectiveness. At this writing, only observations of the teach domain have been implemented: the plan and increase effectiveness domains are described in IMPACT guides, but they are not yet part of the observations and ratings. DCPS uses nine dimensions to define the teach domain, and each is scored separately during a given observation (District of Columbia Public Schools, 2013a, p. 15):
__________________
5For 2012-2013, value-added estimates were also calculated for reading and English-language arts teachers in grades 9 and 10.
- lead well-organized, objective-driven lessons;
- explain content clearly;
- engage students at all learning levels in accessible and challenging work;
- provide students multiple ways to move toward mastery;
- check for student understanding;
- respond to student understanding;
- develop higher-level understanding through effective questioning;
- maximize instructional time; and
- build a supportive, learning-focused classroom community.
The guidelines require that most teachers be observed five times each year, four times formally and one informally, although this varies for teachers who have previously received high ratings. The informal observation is intended to provide feedback to teachers and does not count toward the overall score. Each formal observation lasts at least 30 minutes and is unannounced. The guidelines require that a conference be held with the teacher within 15 days of an observation. For formal observations, the conference is to be followed by a full written report with scores and comments for each standard of the teach domain. Observations are conducted by school administrators, such as the principal or assistant principal, as well as by master educators, a set of experienced teachers that the city hired and trained to serve as “outside” observers.
Score distributions show that the majority of teachers receive ratings of effective or highly effective (Gitomer et al., 2014). The most recent year (2014) saw the highest proportion (69 percent) of teachers receiving those ratings. Most of the other teachers receive a rating of developing. A very small number of teachers receive the lower ratings of minimally effective or ineffective.
With regard to the guidance DCPS provides for implementing the observations, we note several positive features. The use of master educators as observers is unique among the state evaluation systems that we examined. DCPS’s choice of five observations for a summative score for early career teachers is higher than the requirements in many other states and more in line with findings from research on the point at which observation scores converge (see, e.g., Bill & Melinda Gates Foundation, 2012). The use of multiple observers and multiple observations is in keeping with best practices identified in research (see, e.g., Bill & Melinda Gates Foundation, 2013). The provision of an informal, unscored observation for new teachers is found in many other states and is generally recognized as sound practice.
The anecdotal evidence from our interviews with instructional superintendents suggests points to consider about the implementation plan. Two
of the superintendents noted that the procedures for conducting observations and providing feedback are generally efficient and appropriate. However, one of these two said that feedback should be provided more quickly. This superintendent thought that waiting 14 days or so to give a teacher feedback on a lesson is ineffective and that “on-the-spot” feedback would be much more helpful. Both of these superintendents were critical of the kind of evidence considered, suggesting that it is too limited and should be expanded to include teachers’ lesson planning strategies and samples of student work. They both believe that teachers and students change their behavior when they know they are being observed and therefore that including a broader sampling of a teachers’ work would be beneficial.
The third superintendent noted that the focus of the observations is on pedagogy but not on rigor. That individual is supportive of IMPACT because it provides a framework for what effective instruction should look like (classroom management, questioning, differentiated instruction), but it does not address the rigor of the instruction.
The third superintendent distinguished between principals who are primarily managers, who prioritize building operations over instruction, and those who view themselves as instructional leaders whose primary role is to help teachers improve instruction. According to this superintendent, principals of the latter type are likely to be more diligent in making teacher observations and to provide more constructive feedback because they view the observations as a tool for growth.
The superintendents also discussed measures put in place to instruct and support principals. According to the third superintendent, principals and assistant principals must go through a training process to learn how to use the scoring rubrics. They are required to watch videos, submit scores, and have their scores reviewed and analyzed. There is also an IMPACT guide designed to help principals plan the timing and spacing of the observations. One superintendent indicated that this helps ensure that observations are properly spaced throughout the school year and not all done at the last minute, and it also allows principals time to write reports that contain robust evidence and identify next steps.
Commitment to School Community
The measure of commitment to school community is intended to reflect the extent to which the teacher supports and collaborates with the school community. It has five dimensions:
- support for local school initiatives,
- support for special education and English-language-learner programs,
- high expectations,
- partnership with families, and
- instructional collaboration.
Guidelines call for a school administrator (usually a principal) to conduct the commitment evaluation and assess teachers twice on all five dimensions, once before December 19 and again before the end of the school year. The two scores are averaged to yield the final score used in the evaluation rating. The scoring rubric is based on the frequency with which effective behaviors are observed; it has four levels, 1 (lowest) to 4 (highest) (District of Columbia Public Schools, 2013a, pp. 48-51).
In 2009-2010, 74 percent of teachers received a score of 3 or above. Scores have increased since then: in 2012-2013, 89 percent of teachers received a score of 3 or above. While only 1.4 percent of teachers received a score less than 2 in 2009-2010, less than 0.4 percent of teachers (only 12 of 3,294) received such a score in 2012-2013.
Measures of teaching activities outside of classroom instruction are not common in teacher evaluation systems in the United States, and none of the other 17 states examined in the paper commissioned for this evaluation includes this type of measure (Gitomer et al., 2014). Many education researchers have discussed the importance of the work teachers do outside of planned instruction, particularly interacting with families, collaborating with teachers and support staff, and supporting school improvement efforts (e.g., Ladson-Billings, 2009). Although classroom observation instruments and rubrics to assess other elements in teaching, such as lesson planning, have been a research focus for decades, comparably little research has examined how to assess and measure teacher involvement outside of classroom instruction (Gitomer et al., 2014).
Our review of guideline documents revealed no evidence of efforts to control the quality of scores on the commitment measure, either through administrator training or implementation. The rubrics are written in language that leaves considerable room for inference and is likely to be interpreted differently by administrators in different schools, and the examples provided to guide assessment are brief and limited. No documentation exists to clarify pivotal terms used in the rubric, such as “sometimes” or “effective manner.” It does not appear that there are any efforts to support the comparability of administrator scoring across the district (Gitomer et al., 2014).
Core Professionalism
In addition to measuring observable classroom practice, many states have made an effort to evaluate teacher professionalism. Those evaluations generally use the same dimensions to define professionalism as those in
the commitment component of IMPACT. Other states tend to include the measure of professionalism as a part of teacher effectiveness or within a broader measure of teacher practice. The core professionalism component in IMPACT is distinguished from those elements and focuses on basic job responsibilities. Specifically, teachers are rated on the following behaviors:
- attendance,
- on-time arrival,
- following policies and procedures, and
- interacting with people in a respectful manner.
The measure of professionalism only affects a teacher’s overall effectiveness score if she or he is found to be deficient in this area. There are three levels of rating for each of the four behaviors: meets standard; slightly below standard; and significantly below standard. The school administrator rates teachers twice annually, on a time schedule like that for the commitment measure, and ratings are based on the frequency with which certain behaviors are observed. Teachers rated as slightly or significantly below standard are subject to deductions from their total effectiveness scores, ranging from 10 to 20 points.
Most teachers’ evaluation scores are not adversely affected by the professionalism measure, but deductions are not rare. As with the other measures, the overall professionalism ratings for teachers have improved over time. During the first year IMPACT was implemented (2009-2010), nearly 25 percent of all teachers had a deduction, but in 2011-2012 and 2012-2013, less than 13 percent of teachers received a deduction.
The components and ratings are described in a rubric provided in the IMPACT guidebook (District of Columbia Public Schools, 2013a). In comparison with those for the commitment measure, the professionalism measure descriptions are written in language that is much less ambiguous. For example, to meet the standard for on-time arrival, an individual must have “no unexcused late arrivals.” To be classified as significantly below standard for respect, the teacher must demonstrate a pattern of failing to “interact with students, colleagues, parents/guardians, or community members in a respectful manner.”
Our review of guideline documents revealed no evidence of quality controls for the scoring of this measure through training or during implementation. Scores are assigned at the discretion of the administrator.
Measures of Student Learning
Individual Value-Added Estimates
The individual value-added estimate is derived through a statistical procedure called value-added modeling. The procedure produces an estimate for each teacher of the value she or he added in a school year irrespective of other factors; this estimate is interpreted as a measure of the teacher’s effectiveness at improving student achievement. Based on multiple regression techniques, VAM seeks to isolate a teacher’s contribution to students’ gains on achievement tests from other factors that have been shown to be related to academic performance but are outside the teacher’s control. Those factors include poverty, attendance, and mobility among schools. There are other factors that may have an impact on student learning and are beyond the control of the teacher, but cannot be controlled statistically. These factors, which include parental and other supports for learning outside the classroom, can affect students’ performance on achievement tests, but they are difficult to quantify and so cannot be factored into value-added models. Thus, for a given classroom of students, the models estimate the average gain (or loss) in test scores from one year to the next, after controlling for the outside factors that are measurable. The models use this gain or loss as a measure of teacher effectiveness.6
Before describing this component of IMPACT, we note that there is considerable disagreement about the use of students’ scores on standardized tests for this purpose. Experts disagree about both the technical qualities of VAM estimates (e.g., precision and stability from year to year) and the validity and fairness of using them to evaluate teachers.
Some argue that VAM produces reliable, objective, quantified measures of a teacher’s impact on student learning (e.g., Gordon et al., 2006; Glazerman et al., 2010; Hanushek and Rivkin, 2010; Bill & Melinda Gates Foundation, 2012; Kane et al., 2013; Chetty et al., 2014a). These advocates maintain that the controls included in the statistical model support interpretations that students’ gains or losses are attributable to the teacher.
Others argue that there are numerous drawbacks to the use of value-added estimates—including both conceptual and technical limitations (e.g., Raudenbush, 2004; Baker et al., 2010; Rothstein, 2010; Darling-Hammond et al., 2012; American Statistical Association, 2014; Amrein-Beardsley, 2014; Ravitch, 2014). These critics are skeptical of the causal claims made by VAM advocates and are concerned about reducing a teacher’s work to a single
____________________
6For additional information about using VAM approaches for this purpose, see, for example, McCaffrey et al. (2003), Braun (2005), McCaffrey and Lockwood (2008), National Research Council and National Academy of Education (2010), and Harris (2011).
number, the reliability and validity of that number, and the fairness of making high-stakes employment decisions based on that number.
These differences of opinion were reflected among the experts on the committee, and we did not come to consensus on this issue. However, we think it is important to note that the revised edition of the Standards for Educational and Psychological Tests (American Educational Research Association et al., 2014) lays out guidelines for using student achievement test scores to evaluate teacher effectiveness, and it specifically states that this use requires
a validity argument should be set forth to justify inferences about [the value-added estimates] as measures of a desired outcome … and evidence for the appropriateness of this inference needs to be provided. (p. 210)
In D.C., as in most other states that use VAM estimates in their teacher evaluation programs, this type of validity evidence has not yet been collected.
We did not evaluate the decision to include VAM estimates in IMPACT. Instead, we focused on the ways that value-added estimates are calculated for IMPACT and the extent to which the procedures conform to the practices recommended by experience and empirical research.
The individual value-added component is estimated by modeling the current year’s test scores for the teacher’s students as a function of those students’ previous year’s scores in the same subject, controlling for the measurable factors that have an effect on student learning but are beyond the control of the teachers. Scores on the D.C. Comprehensive Assessment System (DC CAS) tests have served as the measure of achievement.7 The models include both student-level factors that control for each individual’s educational and background characteristics and classroom-level factors that control for contextual factors that are outside of the control of teachers. The model currently used by DCPS includes the following student-level and classroom-level control variables (Isenberg and Walsh, 2014):
Student-level factors:
- previous year’s test score in the same subject (e.g., control for mathematics while assessing student scores in mathematics);
- previous year’s test score in another subject (e.g., control for mathematics while assessing growth in reading);
- eligibility for free lunch;
- eligibility for reduced-price lunch;
- special education status;
__________________
7The last administration of the DC CAS was in 2013-2014, as DCPS has completed the transition to the PARCC assessment.
- limited English proficiency status;
- attendance from the previous year; and
- an estimate of student mobility (e.g., number of times student has changed schools).
Classroom-level factors:
- the class’s average test score in the same subject from the previous year;
- the standard deviation of the class’s scores in the same subject from the previous year; and
- the proportion of students eligible for free or reduced-price lunch.
The previous test score measures (average and standard deviation) are included to account for peer achievement and the dispersion of achievement within each classroom, and the free or reduced-price lunch control offers additional contextual information.
The model yields an estimate for each teacher that is converted to a percentile rank. The percentile ranks are then transformed to a scale that ranges from 1.0 to 4.0. In the original model (used through the 2010-2011 school year), teachers who scored at the 50th percentile received a scale score of 2.5. This changed in the 2011-2012 school year, and teachers who scored at the 50th percentile received a scale score of 3. Other scores are assigned relative to score at the 50th percentile, but we were not able to determine how that assignment is done. The city does not release the distributions for the individual value-added scores.
For the most part, the individual value-added estimates are calculated in ways that are used in other school systems and supported by empirical research. The statistical procedures are similar, and the student-level and classroom-level controls are similar to those discussed in the literature base on VAM (e.g., see Rivkin et al., 2005; Aaronson et al., 2007; Koedel and Betts, 2011; Sass et al., 2012; Goldhaber and Hansen, 2013; Chetty et al., 2014b).
There are a few differences between the models used by DCPS and those used in other states. D.C. includes prior-year attendance as a student-level control variable, which seems valuable but is rarely done elsewhere (Koedel, 2014). Other states include race and gender as student-level controls, and this is not done in D.C. Nevertheless, in a comprehensive study, Chetty and colleagues (2014b) found low levels of bias in the value-added models that rely on sets of control variables similar to those used in IMPACT (also see Kane and Staiger, 2008). Based on the available research evidence, the likelihood that teachers’ value-added estimates are significantly biased because insufficient student-level control variables are small.
In D.C., a single year’s value-added estimate is used in determining
a teacher’s overall IMPACT score. Using a single value-added estimate is appealing because performance in previous years is not counted in a teacher’s current evaluation score. However, research shows that including two or more years of value-added estimates improves both the precision and the stability of the estimates from one year to the next (McCaffrey et al., 2009; Koedel and Betts, 2011; Schochet and Chiang, 2013). Thus, there is a tradeoff between the benefits of using current data to estimate teachers’ value-added scores and using data for multiple years for stability. It may be optimal to use 2 or more years of value-added data for teachers when possible, perhaps weighting the years unequally so that recent performance is emphasized.
Until 2011-2012, IMPACT included an estimate of the value added by each school. The school value-added estimate was included in determining the overall rating for all teachers in a school, whether or not an individual value-added estimate was calculated for all of the teachers. The purpose of calculating a value-added estimate for a school was that it provided an incentive for teamwork: that is, if test scores improved for the school, all teachers in the school benefitted. The city discontinued the school value-added estimate in 2012-2013, but we did not find any documentation for this decision. Many states use this estimate, and it is not clear why the city decided to eliminate it.
Teacher-Assessed Student Achievement Scores
As we note above, an individual value-added score cannot be calculated for all teachers. For the teachers for whom a value-added score is not calculated, DCPS calculates a teacher-assessed student achievement score, as is done in some other states (often called student learning objectives). DCPS documents provide guidelines for calculating this score: the teacher and administrator or evaluator (school principal or assistant principal) decide on specific learning growth goals for a given class of students, and the teacher must show evidence that the students achieved those goals. The learning goals, assessments, scoring, relative weights (if multiple assessments are used), and evaluation criteria are all negotiated between the teacher and the administrator in the fall of the school year.
The requirements for this measure state that “Assessments must be rigorous, aligned to the DCPS content standards, and approved by your school administration” (District of Columbia Public Schools, 2013a, p. 42). D.C. also publishes guidance materials to recommend assessments and goals for certain grades and subject areas (District of Columbia Public Schools, 2011). The recommendations include the use of specific, commercially available assessments, as well as suggestions for teachers to create assessments, projects, performance tasks, and portfolios. Many suggestions for
specific subjects and grades include multiple assessments that target different instructional goals.
The guidelines call for the administrator to approve the scoring targets for the students and for the class as a whole. Also, the teacher and administrator agree on the criteria on which the teacher will be scored at the end of the year. Teachers must present the evidence of the students’ achievement to the administrator, and the administrator must verify the evidence and assign a score by the last day of school. Teachers are scored on a 4-point scale that characterizes their students’ learning as “little,” “some,” “significant,” and “exceptional.” If scores cannot be validated or the assessments used were not approved initially, a teacher receives the lowest score.
The majority of teachers receive a score of 3 or higher (54 percent in 2009-2010 and 76 percent in 2012-2013). Since the use of this measure was implemented, scores have been increasing overall, and the percentage of teachers with very low scores (lower than 2) has been decreasing. Approximately 10 percent of teachers scored lower than 2 until 2012-2013, when the percentage dropped to 6.4 percent.
The teacher-assessed student achievement component in IMPACT is similar to assessments of student learning objectives used in other states when test score data are not available for groups of teachers. However, D.C. collects no systematic information about the quality of its scores. There are no explicit standards of quality and no systematic mechanisms to review teachers’ scoring of student work or principals’ evaluations of the teachers’ scoring. This lack of quality control for these locally developed measures is not unique to IMPACT. This lack is typical in systems that rely on teachers and principals to develop individual goals, which need not be comparable across classrooms. However, we note that several states that use student learning objectives have significantly more quality control: they require specific assessments for their student learning objectives so that students’ performances can be compared across grades and subjects.
The quality of the teacher-assessed student achievement measure is unexamined, but a related issue is that it is almost totally dependent on the collective judgment and implementation of individual teachers and administrators. Although D.C. does review all goals used in the measure, it is only to “ensure they are workable” (District of Columbia Public Schools, 2011, p. 2). The city does not provide examples of acceptable locally developed requirements for the measure and assessments, which contrasts with the kinds of supports for student learning objectives measures that have been developed by other states (Gitomer et al., 2014).
Overall Effectiveness Score
In IMPACT, the component scores are weighted and summed to produce an overall score that is used to place the teacher into one of five effectiveness categories. The weights differ depending on whether a teacher has an individual value-added score or not (see Table 4-1, above). For teachers with an individual value-added score (group 1 in the table) that score and the classroom observation score receive the most weight, and the weights are roughly equal (e.g., for the first year, the individual value-added score was weighted by 50 and the classroom observation score by 40). In contrast, for teachers without an individual value-added score (group 2 on the table), the classroom observation score is weighted much higher than any of the other components (e.g., for the first year, this score was weighted by 80).8
Several observations can be made about the values shown the table. First, the majority of teachers in the school system fall into group 2 because assessment data are not available to calculate an individual value-added score. For this group, DCPS has chosen to strongly emphasize the classroom observation score, which accounts for 80 percent of the overall score. There is a public perception that IMPACT consists only of VAM, but in fact, the majority of teachers do not have an individual value-added score, and for those that do, its weight is nearly equal to the classroom observation score.
Second, there have been modifications in how specific measures are implemented and how they contribute to the final score (Isenberg and Hock, 2012). For instance, as shown in Table 4-1, there have been numerous changes in the weights assigned to the component scores.9 The changes have been substantive enough to render the overall IMPACT scores incomparable from one year to the next. When examining trends in teacher effectiveness ratings, it is impossible to determine the extent to which average gains or losses are the result of improved teacher practices or the result of changes in the way that effectiveness ratings are determined. We note that the city decided to launch a full-scale implementation of IMPACT and then make modifications as needed, rather than begin with smaller pilot implementations. While this is a reasonable approach, it confounds attempts to examine trend data for evaluation purposes. There were no data that might allow comparisons across years (e.g., recalculating prior component scores using the new weights—or vice versa—solely for research purposes), and we could not find documentation of the rationale for the various changes.
An additional change will occur during the 2014-2015 school year because DCPS has adopted the Common Core State Standards and is
____________________
8In all, the city defines eight groups, based on teaching assignments. The numbers of teachers in groups 3-8 are small, and we did not focus on them.
9The city decided to launch a full-scale implementation of IMPACT and then make modifications as needed, rather than begin with smaller pilot implementations.
transitioning to a test designed to measure these standards (Partnership for Assessment of Readiness for College and Careers [PARCC]; see Chapter 3). The individual value-added component will not be calculated because in the first year of a new testing program, there are no achievement data on which to calculate student gains or losses. We did not find any information about the city’s plans for subsequent school years, once multiple years of achievement data on PARCC become available.
Effectiveness Categories
Once the overall scores are calculated, teachers are assigned to a final performance classification (discussed above). Initially, DCPS used four performance levels:
- highly effective (350–400)
- effective (250–349)
- minimally effective (200–249)
- ineffective (100–199)
A fifth performance level, developing, was added in 2012-2013, with the resulting change in the scores for two of the categories:
- highly effective (350–400)
- effective (300–349)
- developing (250-299)
- minimally effective (200–249)
- ineffective (100–199)
This change made obtaining a rating of effective slightly more difficult for teachers. In the original classification, teachers needed to earn at least 63 percent of the total possible points to reach the effective level. With the new classification, teachers must earn at least 75 percent of possible points to achieve the effective level. At the same time, a rating of developing carries consequences for teachers (who can be dismissed if they receive that rating for 3 consecutive years).
The majority of teachers have received ratings of highly effective or effective. Table 4-2 shows the ratings of teachers from 2009-2010 to 2012-2013. The percentages at that level ranged from 85 to 90 percent in the first 3 years and dropped to 75 percent in 2012-2013, when the category of developing was added.
It is also useful to compare the percentages at each rating level for teachers who fall into group 1 or group 2. We obtained data that supported this comparison for the 2009-2010 school year. For group 1 teachers (those
TABLE 4-2 Percentage of Teachers in Each Effectiveness Category, by School Year
| School Year | ||||
| Category | 2009-2010 | 2010- 2011 | 2011-2012 | 2012-2013 |
| Highly Effective | 16 | 14 | 22 | 30 |
| Effective | 69 | 70 | 68 | 45 |
| Developing | 19 | |||
| Minimally Effective | 14 | 14 | 9 | 5 |
| Ineffective | 2 | 2 | 1 | 1 |
NOTE: Results across years are not strictly comparable because of ongoing changes in the components, the ways they are scored, and weights applied to them.
SOURCE: Data from Gitomer et al. (2014).
with an individual value-added score), 68.8 percent received ratings of effective or highly effective, and 28.2 percent received ratings of minimally effective or ineffective. For group 2 (those with only a teacher-assessed student achievement score), 87.3 percent were rated effective or highly effective, and 12.7 were rated minimally effective or ineffective (Education Consortium for Research and Evaluation, 2013a, p. 32, Table 1).
One of the ward superintendents noted that while most teachers are rated at higher levels, he or she did not see commensurate increases in student learning. Another ward superintendent observed that the primary focus so far has been on teachers with the lower ratings (minimally effective or ineffective teachers), not on continuing to improve performance for teachers who are rated effective.
Feedback and Support
An important goal the designers set for IMPACT was to provide feedback and support to teachers. IMPACT guidelines describe two mechanisms for accomplishing this goal: instructional coaches and ongoing professional development. Guidelines indicate that teachers who have a rating of developing or lower are the primary focus of this component of the system. The IMPACT guide indicates that “DCPS will encourage principals and instructional coaches to prioritize these teachers for professional development in an effort to help them improve their skills and increase student achievement” (District of Columbia Public Schools, 2013a, p. 64).
Instructional Coaches
According to the guidelines, instructional coaches should have at least 3 years of “successful” classroom teaching and should be qualified for a teaching certificate in the city. Instructional coaches are to be relieved from their regular teaching responsibilities so they can focus on developing coaching plans to work with teachers and school leaders to facilitate understanding of new DCPS initiatives (including IMPACT and implementation of the Common Core State Standards). They are also expected to conduct classroom observations and collect relevant artifacts to analyze teacher practice and help foster teachers’ abilities to improve.
Instructional coaches are also subject to evaluation, which is based on a statement of instructional coach standards that contains six dimensions (District of Columbia Public Schools, 2013c). The dimensions are Analyze Data Prior to the Learning Cycle; Analyze Data During the Learning Cycle; Design Support; Implement Support; Demonstrate Teacher and Student Growth; and Facilitate Adult Learning. Each instructional coach is evaluated four times a year, twice by a school administrator and twice by a member of the DCPS district office.
Although implementation plans noted that schools should have at least one instructional coach, we learned from our interviews that the availability of coaches at DCPS schools varies: some have one or more coaches but others have none. One superintendent told us that school principals decide whether or not to have one and must pay for them out of their budgets. Principals may decide to hire an assistant principal, a dean of students, a social worker, or other staff instead of an instructional coach, but these choices are generally guided by the cluster superintendent. The instructional coaches and the professional development that they provide are managed by DCPS’s Office of Teaching and Learning. They generally focus on content, depending on the particular focus of a school. A coach does not necessarily focus on issues related to IMPACT results.
Professional Development
A number of resources are available to assist teachers in their professional learning and for instructional coaches to use in helping teachers meet their professional growth objectives. These resources include (District of Columbia Public Schools, 2012)
- professionally produced lesson videos from DCPS classrooms;
- curricular supports for the Common Core State Standards;
- a professional development planner, an online catalog of professional development opportunities;
- educator portal, an online platform to connect colleagues and resources;
- support for teachers focused on students with special needs, those working in STEM (science, technology, engineering, or mathematics), or those teaching International Baccalaureate classes; and
- the Washington Teachers’ Union resources.
Most of these resources are accessible online, which allows teachers to choose if and when to use them. However, there is no mechanism for tracking how often these resources are used and if they are effective in improving practices. Principals and instructional coaches are encouraged to give priority attention for professional development to teachers who score below effective.
HOW DCPS USES INFORMATION FROM IMPACT
The city designed IMPACT so that the teachers’ overall scores and ratings could be used to support a number of critical employment decisions. Annual performance determines the extent to which teachers can advance on the DCPS career ladder, and advances can lead to additional compensation as well as a reduction in the number of classroom observations required.10 Also, teachers rated as highly effective may choose to participate in additional leadership opportunities. Low performance ratings result in a range of employment sanctions. Teachers receiving a rating lower than effective have their salaries frozen by not advancing a step on the base salary scale.
Professional Advancement
Through the Leadership Initiative for Teachers (LIFT) Program, the district has developed a career ladder that provides a series of advances for teachers. The career ladder consists of five steps—teacher and established, advanced, distinguished, and expert teacher—and progress is based on a combination of experience and positive evaluation ratings, with specific requirements for moving from one level to the next: see Table 4-3. To advance on the ladder, teachers have to receive consecutive high ratings. For example, the two highly effective ratings that are needed to progress from advanced to distinguished have to be obtained in consecutive years. Guidelines specify that movement occurs in one direction only—teachers
____________________
10We note that DCPS received significant external funding to support the development of IMPACT and the financial supports it has offered to teachers; however, DCPS no longer relies on external funding to support the program.
TABLE 4-3 LIFT Career Ladder: Requirements for Advancement
| Level | Requirements to Obtain |
| Teacher | None |
| Established Teacher | One highly effective or two effective ratings |
| Advanced Teacher | One highly effective or two effective ratings |
| Distinguished Teacher | Two highly effective ratings |
| Expert Teacher | Two highly effective ratings |
NOTE: When multiple higher ratings are required to move to a different level, they must be in consecutive years.
SOURCE: Data provided to the committee by DCPS.
can move up the ladder, but they do not move backward if subsequent annual ratings are lower. Teachers also need to advance through each rung of the ladder. Two highly effective ratings are needed to become distinguished, and then two additional highly effective ratings would be needed to become expert.
According to the guide (District of Columbia Public Schools, 2014d), as teachers move up the career ladder, they become eligible for additional leadership opportunities, including the ability to participate as curriculum writers, receive policy fellowships, and help recruit and select new teachers for the school system. Teachers at advanced LIFT levels may also be formally observed less frequently.11
Compensation
Teachers receiving a rating lower than effective have their salaries frozen by not advancing a step on the base salary scale. DCPS has chosen to compensate teachers who receive high performance ratings in two ways: base salary increases and single-year bonuses, a plan that was negotiated between DCPS and the Washington Teachers’ Union. These financial incentives vary, depending on a teacher’s position on the LIFT career ladder, school assignment (the rewards vary depending on the level of poverty and academic achievement in the school), and whether the teacher has an individual value-added score or a teacher-assessed student achievement score.
Base salary increases are awarded as follows (District of Columbia Public Schools, 2013b):
__________________
11DCPS also formed a partnership in 2012 with the Georgetown University McDonough School of Business to provide a 13-month master’s program for DCPS principals; see http://msb.georgetown.edu/programs/executive/eml-dcps [February 2015].
- advanced teacher: an added 2 years’ service credit for base salary;
- distinguished teacher: an added 5 year’s further service credit for base salary and automatically moved to the master’s degree base salary band if not there;
- expert teacher: an added 5 years’ further service credit for base salary, and automatically moved to the Ph.D. base salary band.
The second component of the compensation structure is the IMPACTplus program. Teachers who receive ratings of highly effective qualify for annual bonuses that are separate from their base salary compensation. Annual bonuses range from $2,000 to $25,000. Teachers who work part time, are dismissed for disciplinary reasons, or resign at the end of the school year are not eligible for the bonus program. The bonus awards are shown in Table 4-4.
A key stipulation for receiving the bonus is that teachers must cede their contractual right to what is referred to as the “extra year” or other buyout options. DCPS teachers who lose their teaching positions in a school have the right to look for a position in another school for the next school year, with full compensation and benefits. Teachers who are eligible for IMPACTplus bonuses must agree to waive this option in order to receive the additional compensation. During the first year of IMPACTplus, 63.7 percent of eligible teachers accepted the bonus; since that time, acceptance rates have increased, to 78.6 percent in 2010-2011, 80.9 percent in 2011-2012, and 81.5 percent in 2012-2013.
RESULTS FOR THE EDUCATOR WORKFORCE
We reviewed the changes in the effectiveness ratings of the teacher workforce, as defined by IMPACT, since the program was implemented.
TABLE 4-4 Structure of Bonus Awards for IMPACTplus
| Teacher Group | ||
| School Type | Group 1a | Group 2b |
| 40 Lowest Performing | $25,000 | $20,000 |
| FRL Rate 60% or Higher | $15,000 | $10,000 |
| FRL Rate Less than 59% | $3,000 | $1,000 |
NOTE: FRL, eligible for free and reduced-price lunches.
aTeachers with a value-added score; see text for discussion.
bTeachers without a value-added score; see text for discussion.
SOURCE: Data provided to the committee by DCPS.
We examined the distributions of performance ratings for teachers who stay with the system, are dismissed, leave voluntarily, and who are newly hired. The design of IMPACT was premised on the idea that the performance ratings combined with the incentive structure (rewards and sanctions) would lead to increases in the overall quality of the teaching force. That is, the financial bonuses should have provided the incentive for highly effective teachers to remain in DCPS, while the mandatory dismissal of teachers with low performance ratings should have removed the low-performing teachers. In addition, the threat of dismissal under IMPACT may have led low-performing teachers to voluntarily leave DCPS, even though they were eligible to remain.
We note, however, an important caveat in the analysis in this section and in interpreting the data. Although the results show trends in teacher effectiveness ratings since IMPACT was implemented, these trend data do not provide conclusive evidence on whether IMPACT has been successful in meeting its goals, and they do not isolate its effects on students or educators. The implementation of IMPACT coincided with numerous other policy changes that may have affected teachers’ decisions to stay or leave. Furthermore, it is not possible to measure changes in effectiveness before and after IMPACT because there were no teacher effectiveness ratings prior to IMPACT.
Our analysis was based primarily on two sources. One is a descriptive analysis of the performance ratings of teachers who stay, leave, are dismissed, or newly hired.12 This analysis was summarized in the third DC-EdCORE report (Education Consortium for Research and Evaluation, 2014a). The second is a statistical analysis that compared the retention and performance outcomes among low-performing teachers whose ratings placed them near the threshold for the possibility of dismissal (Dee and Wycoff, 2013). This study also compared the outcomes among high-performing teachers whose rating placed them near a threshold that would result in financial rewards.
Dismissal Rates
Table 4-5 provides data on the status of teachers with low performance ratings over the 4 years we studied. In the first year (2009-2010), 1.8 percent of teachers were rated as ineffective, and all were dismissed. In the second year (2010-2011), 1.7 percent of teachers were rated ineffective, and
____________________
12It is important to point out that these data on the effectiveness ratings of teachers who stay, leave, or are newly hired cannot be interpreted in a causal way. That is, it is not possible to attribute any observed changes directly to IMPACT or PERAA alone, because numerous factors affect teachers’ decisions to stay or leave. Further, no data on teacher effectiveness are available pre-PERAA, so there are no ratings to serve as baseline information.
TABLE 4-5 Dismissals of Teachers in DCPS, by School Year
| Reason for Dismissal | 2009-2010 | 2010-2011 | 2011-2012 | 2012-2013 |
| Ineffective | 1.8% | 1.7% | 1.0% | 1.3% |
| Minimally Effective in 2 Consecutive Years | n.a. | 3.8% | 1.5% | 1.0% |
| Total | 1.8% | 5.5% | 2.5% | 2.3% |
| Number of Teachers Dismissed | 62 | 182 | 83 | 76 |
| Total Number of Teachers | 3,378 | 3,315 | 3,270 | 3,264 |
NOTE: The percentages and counts in the first three columns reflect teachers who were dismissed; those in the final column reflect teachers who were eligible for dismissal. In the first 3 years, DCPS dismissed all teachers who were eligible for dismissal.
SOURCE: Education Consortium for Research and Evaluation (2014a, p. 7).
3.8 percent had been rated minimally effective for 2 consecutive years: this produced a dismissal rate of 5.5 percent. The dismissal rate declined in the next 2 years to 2.5 percent in 2011-2012 and to 2.3 percent in 2012-2013. Over the 4 years, a total of 403 teachers were dismissed out of a total of about 3,300 teachers (Education Consortium for Research and Evaluation, 2014a).
Overall Retention and Leaving Rates
Figure 4-1 shows the percentage of teachers who left DCPS, comparing teachers who met criteria for dismissal and teachers who left despite being eligible to remain.13 Many more teachers have chosen to leave DCPS than were dismissed: 15.5 percent left at the end of 2009-2010 and 16.9 percent at the end of 2011-2012. The portion of teachers being dismissed under IMPACT was higher than the portion dismissed under the previous system (Education Consortium for Research and Evaluation, 2014a).
To evaluate changes in the overall quality of the DCPS teaching force (as measured by IMPACT), we examined the effectiveness ratings of teachers who left and those who stayed. Figure 4-2 shows retention rates by IMPACT effectiveness category for 2009-2010 through 2011-2012.
As the figure shows, over 80 percent of teachers classified as highly effective or effective chose to stay with DCPS. The retention rate among teachers just in the highly effective category was 89 percent and did not change over the 3 years. The retention rate for teachers in the effective cat-
__________________
13Teachers were considered to have left DCPS if they did not receive an IMPACT rating in the following year.
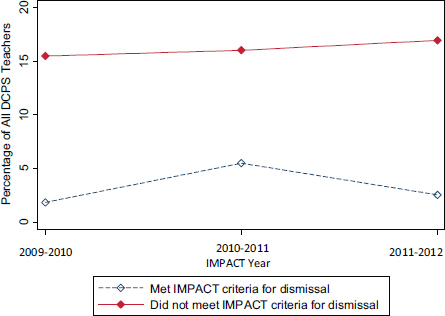
FIGURE 4-1 Percentage of teachers who left DCPS, by dismissal criteria eligibility and school year.
SOURCE: Education Consortium for Research and Evaluation (2014a, p. 7).
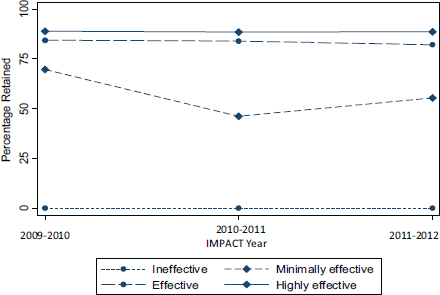
FIGURE 4-2 Retention rates of teachers in DCPS, by effectiveness category and school year.
SOURCE: Education Consortium for Research and Evaluation (2014a, p. 9).
egory ranged from 82 to 84 percent. These retention rates are in contrast with much lower rates for minimally effective teachers.
Retention and Leaving Rates by School
It is also useful to examine teacher retention rates by school. There may be important differences in the rates at which schools retain the most effective teachers that could lead to inequities across schools. To explore this, the analysts (Education Consortium for Research and Evaluation, 2014b) first grouped the retention rates into four ranges: 0 to 40 percent, 40 to 60 percent, 60 to 80 percent, and 80 to 100 percent. Then, they determined the percentage of schools whose rates fell into each of these ranges and compared them for the year before IMPACT was implemented (2008-2009) and the 3 years after it was implemented (2009-2010 through 2011-2012): see Figure 4-3.
As the figure shows, in the pre-IMPACT year, all schools had a retention rate of at least 40 percent, and most schools (about 50 percent) had a retention rate in the 60-80 percent range. In the years since IMPACT was implemented, the distribution has shifted, with decreases in the two lowest categories (schools retaining 0-40 percent and 40-60 percent of teachers) as
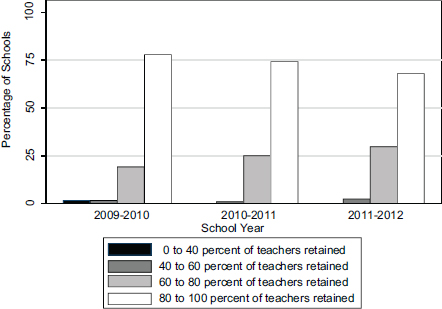
FIGURE 4-4 Schoolwide retention rates of effective and highly effective DCPS teachers, by school year.
SOURCE: Education Consortium for Research and Evaluation (2014a, p. 12)
well as increases in the highest category (schools retaining 80-100 percent of teachers).
Figure 4-4 shows similar data by school but includes only teachers who received an IMPACT rating of effective or highly effective. For 2009-2010 through 2011-2012, more than two-thirds of schools retained at least 80 percent of the most effective teachers (78 percent in year 2009-2010, 74 percent in 2010-2011, and 68 percent in 2011-2012). In contrast, only a small number of schools had retention rates lower than 60 percent; we had no information on the characteristics of these schools.
Effectiveness of Entry and Exit Cohorts
The EdCORE researchers also compared the eventual effectiveness ratings of newly hired teachers with those for teachers who left DCPS. This analysis is complicated by the fact that DCPS made changes to the weights for each component from year to year and thus the overall scores and the way they are assigned to performance levels cannot be directly compared. To compensate for this problem, the researchers created a “core” group of teachers, and, for each year, the effectiveness levels of the entry and exit cohorts were compared to this core group.
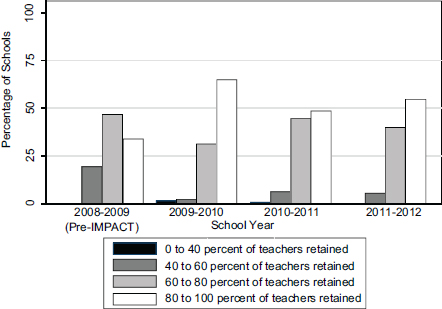
FIGURE 4-3 Teacher retention rates for all DCPS schools, school year.
SOURCE: Education Consortium for Research and Evaluation (2014a, p. 11).
The core group consisted of 1,342 teachers who remained in DCPS from 2008-2009 through 2012-2013.14 The difference in IMPACT scores was then calculated for the core group and compared with teachers who entered or left DCPS. A positive difference would indicate that, on average, entering or leaving teachers had higher IMPACT scores than the core group; a negative difference would indicate that, on average, entering or leaving teachers had lower IMPACT scores than the core group.
The results of this comparison are presented in Table 4-6. The first row shows the differences in IMPACT scores for newly hired teachers in their first year with DCPS in comparison with the core group. As a group, new hires were less effective than core teachers by a similar amount in all 4 years. Across the 4 years shown, newly hired teachers obtained IMPACT scores that were, on average, between 26 and 33 points lower than those of the core group (row 1).
The next three rows in the table show similar information for the teachers who left, broken out for those who met the criteria for dismissal and those who did not. Across the 4 years, teachers who left obtained IMPACT scores that were, on average, between 36 and 50 points lower than the core group: those who left because they met the criteria for dismissal had IMPACT scores ranging from 115 to 165 points below the core group; those who left for other reasons were more similar to the core group, with scores ranging from 23 to 34 points lower than the core group.
These data show that, on the basis of overall IMPACT scores, teachers who were dismissed from DCPS were less effective than the new hires while teachers leaving voluntarily were approximately as effective as the new hires.
Effectiveness Ratings by Location and Socioeconomic Status
There is a substantial body of research showing that students in the highest-poverty schools tend to be taught by the least experienced and qualified teachers (Sass et al., 2012; Lankford et al., 2002). Because of the significant disparities in income level across the wards in D.C., it is important to examine the extent to which students in all wards have equal access to high-quality teachers. The EdCORE researchers examined this issue, looking specifically at the following:
- the extent to which teachers’ IMPACT scores vary by ward and, if so, the trends in these differences over time;
__________________
14The same teachers were included in the core comparison group in each year so that changes in the gaps over time are more likely to reflect changes in the effectiveness of entry and exit cohorts rather than changes in the identity of teachers in the core comparison group.
TABLE 4-6 Trends in IMPACT Scores of Teachers Who Entered or Left DCPS Compared with Core Group of Teachers Who Stayed
| Gap in IMPACT Scores Relative to a Core Group of Teachers | |||||
| Year 1 | Year 2 | Year 3 | Year 4 | ||
| Entering Teachers (in their first year in DCPS) | –30* | –30* | –33* | –26* | |
| Leavers (in their last year in DCPS) | –47* | –50* | –36* | n.a. | |
| Met criteria for dismissal |
–165* | –115* | –126* | n.a. | |
| Did not meet criteria for dismissal | –34* | –28* | –23* | n.a. | |
| Core Teachers b | 1,342 | 1,342 | 1,342 | 1,342 | |
| Entering Teachers | 1,135 | 521 | 640 | 525 | |
| Leaving Teachers | 585 | 713 | 637 | n.a. | |
NOTES: A negative difference indicates that teachers in the subgroup had lower IMPACT scores on average than teachers in the core group. An asterisk (*) indicates the difference is statistically significant at the 5 percent level.
SOURCE: Data from the Education Consortium for Research and Evaluation (2014a, p. 15).
aUnder IMPACT, teachers who earn an ineffective rating in 1 year or a minimally effective rating for 2 consecutive years are dismissed. Teachers could be dismissed for consecutive minimally effective ratings beginning in their second year.
bCore teachers are teachers in DCPS for all 5 school years from 2008-2009 to 2012-2013.
- the extent to which teachers’ IMPACT scores vary across schools with different concentrations of relatively poor students and, if so, the trends in these differences over time; and
- the extent to which IMPACT scores vary in any one ward across schools with different concentrations of students in poverty.
The analysis focused on data for the years 2009-2010 through 2012-2013, comparing the average IMPACT scores obtained by teachers in each ward. For the analysis, the EdCORE researchers used eligibility for free and reduced-price lunch as a measure of socioeconomic status (SES) and grouped schools into three categories on the basis of the percentage of students in the school who qualified for those lunches. High-SES schools were those with fewer than 75 percent of students qualifying for free or reduced-price lunches; medium-SES schools were those with 75 to 85 percent of students qualifying for the lunches; and low-SES schools were those with more than 85 percent of the students qualifying.
The results showed that average IMPACT scores varied considerably across the wards (see Figure 4-5) and that the gaps remained fairly consistent across time (see Figure 4-6).
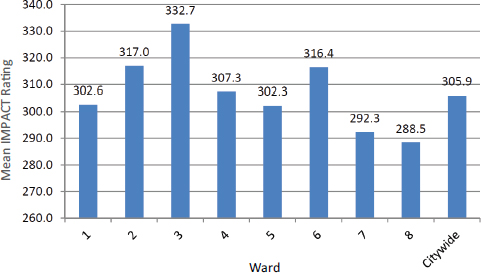
FIGURE 4-5 Mean IMPACT scores for teachers averaged across 4 school years 2009-2010 through 2012-2013, citywide and by ward.
SOURCE: Education Consortium for Research and Evaluation (2014a, p. 24).
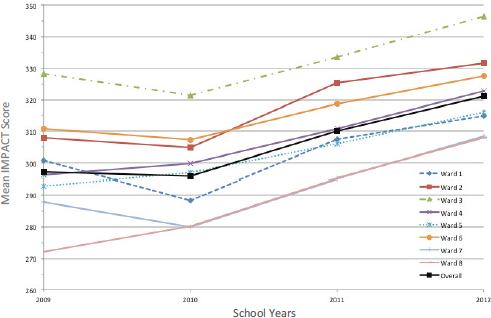
FIGURE 4-6 Mean IMPACT scores for teachers citywide and by ward, 2009-2010 through 2012-2013.
SOURCE: Education Consortium for Research and Evaluation (2014a, p. 25).
IMPACT scores decreased between 2009-2010 and 2010-2011 for all wards and then increased from 2010-2011 to 2012-2013. The differences among the wards mostly persisted, and the ward averages were rank ordered similarly across the years, though there were a few changes.
The analysis also showed that the lowest-income students tend to have teachers with the lowest IMPACT scores, and this relationship persists even when average IMPACT scores are compared across the schools within a single ward. Figure 4-7 shows the average IMPACT scores for schools in each category, illustrating the negative relationship between the concentration of students in poverty and the average effectiveness of their teachers.
The data also highlight the stark differences in the concentration of poverty across wards that we discuss in Chapter 2. For example, all the schools in Ward 3 were classified as high-SES schools; after the 2011-2012 school year, there were no high-SES schools in Ward 7. The disparities are not decreasing, the analysis showed. The average IMPACT scores for teachers in low- and medium-SES schools have consistently been 24 to 30 points lower than for those for teachers in the highest-SES schools. In other words, the data show an association between high concentrations of poverty and low IMPACT scores, although this analysis does not permit causal inferences. One possible explanation is that high-poverty schools are not able to attract teachers with the highest IMPACT ratings (i.e., teachers
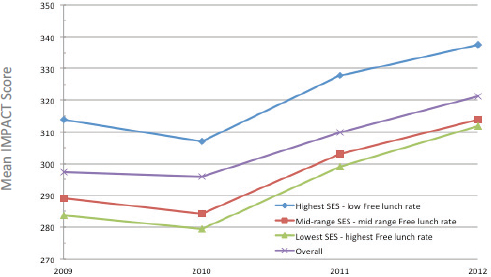
FIGURE 4-7 Mean IMPACT scores for teachers by school-level socioeconomic status, for 2009-2010 through 2012-2013.
SOURCE: Education Consortium for Research and Evaluation (2014a, p. 27).
who score highly have more employment options and choose not to work in high-poverty schools). It is also possible that IMPACT disproportionately favors teachers who work in more affluent wards or schools where students may be more likely to behave well when their teacher is being observed. A recent study showing that classroom observation scores are more biased than individual value-added scores provides some support for this hypothesis (Whitehurst et al., 2014).
We note that in response to a recent U.S. Department of Education requirement,15 the Office of the State Superintendent of Education is developing a plan to increase the number of high-quality teachers in high-poverty schools (Chandler, 2015b).
Teacher Behavior
Dee and Wyckoff (2013) evaluated the extent to which teacher behavior was affected by the rewards and sanctions built into the IMPACT system. Their analysis was designed to explore the possibility that small changes in ratings lead to large changes in incentives and sanctions—that is, the hypothesis that small (possibly inconsequential) changes in IMPACT scores at certain key places on the score distribution lead to very different consequences for the teacher (e.g., dismissal versus financial rewards).
The analysis focused on two sets of teachers, those whose IMPACT scores placed them on the cusp between minimally effective and effective and those whose scores placed them on the cusp between effective and highly effective. Scoring at either side of these cusps in 1 year carries consequences for the subsequent year. That is, teachers who scored minimally effective in 2 consecutive years are dismissed, so teachers who score very close to the dividing score between minimally effective and effective have to improve their performance or face dismissal. At the other end of the spectrum, teachers who score at the highly effective level receive financial rewards and significant increases if rated highly effective for 2 consecutive years, so teachers who score near that cusp have a strong incentive to improve their performance, and teachers who score in the highly effective category have a strong incentive to remain in that category. The analyses examined teachers’ behavior when faced with these consequences and rewards.
The findings from this study suggest that the incentive structure of IMPACT is affecting teachers’ decisions. The researchers reported two primary findings about teacher retention. First, teachers facing a dismissal threat were more likely to leave voluntarily. There was a drop in teacher retention at the score that separates minimally effective and effective
____________________
15See http://apps.washingtonpost.com/g/documents/local/letter-from-education-secretaryarne-duncan-to-chief-state-school-officers/1107/ [February 2015].
teachers. Second, retention was higher among higher-performing teachers. The retention rate for those who scored near the threshold between effective and highly effective was roughly 90 percent. For teachers just at or above this threshold, retention was higher by about 3 percentage points.
With respect to teacher performance, they found that teachers who initially received a rating of minimally effective improved their performance, on average by 10 points. The authors note that this is consistent with the hypothesis that previously low-performing teachers who remained despite the dismissal threat undertook steps to improve their performance. Dee and Wyckoff also found that teachers who were initially rated at or above the highly effective threshold and would receive a large financial bonus if rated this way again increased their scores, by roughly 10 percentage points. Again, this is consistent with the hypothesis that the financial reward will provide an incentive for teachers to continue to perform well.
Along with the implementation of a program to improve teacher quality, Chancellor Rhee also sought to improve principal quality. One of her first reforms was to replace school principals who were performing poorly, as measured by their students’ achievement on standardized tests. After Rhee’s first year (2007-2008), 39 percent of the principals in the school district, a total of 59 individuals, left the system; about half of these departures were intentional dismissals by Rhee (Turque, 2008).
DC-EdCORE researchers examined the relationships between these dismissals and student achievement by measuring the extent to which students in a school with a new principal performed better on standardized tests than would have been expected if the original principal had been retained. These analyses were based on VAM procedures that produced an estimate of the value added by the school (see Education Consortium for Research and Evaluation, 2014b, Apps. A, B). These procedures isolate the school’s contribution to student achievement from the contributions of factors that are outside the control of the school, including background characteristics of students. By comparing a school’s value added before and after a principal was replaced, this approach can isolate achievement gains attributable to a principal from those attributable to other school-level factors.
The researchers found that schools with new principals tended to have statistically significantly higher scores in reading. The average student’s reading scores increased by 4 percentile points in comparison with their expected performance with the original principal. However, these gains were not evident until the new principal’s third year with the school. A similar pattern was found for math, although not as strong.
The gains were larger and statistically significant for students in
grades 6-8 for both subjects after 2 years with the new principal. The average student’s performance in those grades increased by 9 percentile points in math and 8 percentiles in reading (Education Consortium for Research and Evaluation, 2014b, p. 2).
These findings suggest that higher achievement test gains were associated with the hiring of new principals. But, as with estimating the value added by a teacher, estimates of the value added by the school may be confounded by factors that cannot be quantified or controlled in the value-added approach.
Improving Teacher Quality
To improve the quality of teaching that D.C. students receive, DCPS officials identified three strategies that they judged would bring about the desired improvements in the quality of teaching—to clarify expectations, provide quality feedback, and retain effective teachers. They developed a comprehensive system that incorporates these strategies. Expectations were clarified through the teaching and learning framework, which also served as the basis for observation protocols and scoring rubrics used in IMPACT. Multiple assessments based on multiple types of measures are used to rate teachers’ effectiveness, and feedback mechanisms have been created: trained instructional coaches are tasked with helping teachers understand their weaknesses and find ways to improve. A system of rewards and sanctions is designed to encourage all teachers to improve, encourage effective teachers to stay, and allow ineffective teachers to be dismissed.
However, our review revealed several areas for improvement. One issue is the changes in IMPACT since its initial implementation. The changes confound attempts to make comparisons across years and interfere with evaluating one of the chief purposes for the program: to determine if teacher effectiveness ratings improved over time. It would be advisable for DCPS to provide documentation and rationales to justify any decisions to make changes in the evaluation system and demonstrate that the benefits of making the change outweigh the negative effects it will have on comparability across time. DCPS could also calculate the ratings by applying the new weights to prior years’ data solely for research purposes and to enable comparisons.
A second issue is the use of value-added estimates that are based on only 1 year of data. It would be advisable for DCPS to explore the precision of the estimates and their stability across years, comparing the current approach of value-added estimates based on a single year with estimates based on multiple years.
A third issue is the relatively limited range of classroom practices that
are included in IMPACT observations. The teaching and learning framework specified three domains to assess during classroom observations: teaching, planning, and increasing effectiveness. To date, the observations cover only the teaching domain, not the others: the planning domain and the increasing effectiveness domain are described in guidance materials, but they are not yet part of the observations and ratings. It would be advisable for DCPS to take further steps to ensure that these two domains are included in the observations and ratings. It would also be advisable for the city to consider expanding the information collected to include samples of student work, as is done in other teacher evaluation systems. In addition, it would be advisable for DCPS to implement quality-control procedures for the observational measures in IMPACT.
CONCLUSION 4-1 DCPS officials defined a three-pronged approach to improving teacher quality: clarify performance expectations, provide quality feedback and support to teachers, and retain the most effective teachers. The design of the IMPACT teacher evaluation system and the associated implementation plan are generally consistent with current research on teacher evaluation systems. Four aspects of IMPACT’s rating procedures need attention:
- Quality control procedures are needed for the judgment-based ratings of teachers’ commitment to school community and core professionalism, to ensure that scoring criteria are consistently applied.
- More stringent quality control procedures are needed for developing, administering, and scoring the teacher-assessed student achievement component.
- The city’s approach for calculating individual value-added scores is reasonable, given the current state of research. The city’s decision to use a single year of data in calculating the value added by a teacher should be reconsidered regularly in light of new research and in light of the inherent tradeoffs of using single or multiple years.
- Changes have been made to the ways the components of IMPACT are weighted, and a new effectiveness category was added, but the reasons for these changes are not documented. The justification for these changes needs to be made available.
CONCLUSION 4-2 Changes that have been made to the relative weighting of the components of an IMPACT score mean that overall effectiveness scores are not comparable across years. The addition of a fifth effectiveness category in 2012 further complicates comparisons. Reports of trends in measured teacher effectiveness should clearly
acknowledge these changes so that readers do not misinterpret the numbers.
CONCLUSION 4-3 DCPS has procedures in place to use information from IMPACT to provide feedback and support to teachers and to encourage those who perform well to stay. The available data suggest that some of the desired changes in the workforce are evident: more than 80 percent of teachers classified as effective or higher remained in the system, while less than half of teachers classified as minimally effective remained with the system. However, these trend data do not provide conclusive evidence on whether IMPACT has been successful in meeting all of its goals, nor do they isolate its effects on students or educators from those of other policy changes that have occurred since PERAA.
Experience with IMPACT
The committee’s review of the data from IMPACT revealed marked disparities in the distribution of highest- and lowest-rated teachers by ward. Wards with the highest concentration of students in poverty tend to have teachers with lower effectiveness ratings. The source of these disparities is not clear, and it would be advisable for DCPS to investigate them.
CONCLUSION 4-4 Teachers with high IMPACT scores are not evenly distributed across DCPS schools. The data show an association between high concentrations of poverty and low IMPACT scores: average IMPACT scores for teachers in low- and medium-SES schools are consistently 24 to 30 points lower than for those teachers in the highest-SES schools. The reasons for this uneven distribution are not clear.
Like assessment systems, teacher evaluation systems should be validated to determine the extent to which the inferences about teacher effectiveness are supported by evidence. DCPS articulated a number of goals for IMPACT but has not yet developed a plan for evaluating progress toward meeting them. The committee recognizes that systematic evaluation is difficult and somewhat uncommon, but given the novel nature and potential unintended consequences of IMPACT, DCPS could benefit from careful assessment of its effects and, more generally, of the characteristics of the educator workforce.
DCPS placed a high priority on improving the quality of the teacher workforce, under the premise that improving teacher quality would lead to improved conditions and outcomes for students, particularly students who have traditionally been underserved. To date, most DCPS teachers have re-
ceived high effectiveness ratings; however, these teachers are not distributed equitably across districts with high concentrations of poverty. A structured plan for gathering validity evidence, particularly on the distribution of high-quality teachers across schools, is needed so that DCPS can evaluate how well IMPACT is reaching its intended goals and where changes are needed.
CONCLUSION 4-5 The city needs a plan for gathering evidence to evaluate the extent to which the intended inferences from IMPACT are supported, particularly with respect to the improvement of teaching in schools serving lower-achieving students.*
The city needs to undertake additional data collection and analysis to fully understand teacher quality, teacher evaluation, and teacher supports in the charter school sector as it seeks to understand and improve the quality of teaching for all public school students. There are also data that can be collected about all teachers that would not be subject to the changes in the IMPACT program, such as years of experience, highest degree, and others.
CONCLUSION 4-6 Trends in teacher performance as measured by IMPACT are a tool for tracking teacher quality, but they have important drawbacks. The relative weighting of the components has changed over time. Moreover, these measures provide information only about DCPS teachers, not about teachers in charter schools. The city would benefit from maintaining data about teachers in both DCPS and the charter schools, including
- years of experience,
- years with the school system,
- time in a specific school,
- teaching assignments,
- teacher attendance rates,
- education level and highest degree earned,
- area of certification, and
- an indicator of out-of-field teaching assignment(s).
Such information should be maintained for all teachers (those in charter schools as well as DCPS) in a manner that supports comparison across time and by ward. These data should be accessible to researchers, educators, parents, and the public.
________________
*The committee’s final version of wording for this conclusion was inadvertently not made prior to the release of the report.
This page intentionally left blank.


