
Consumer Impacts and Acceptance Issues
The success of the Corporate Average Fuel Economy/Greenhouse Gas (CAFE/GHG) national program depends in important ways on how consumers respond to the more fuel-efficient vehicles of the future. The vehicles that will be needed for compliance with the rules will implement fuel economy and other vehicle changes in a variety of ways that the consumer may or may not perceive, and they will have higher initial costs. How much will consumers value and be willing to pay for better fuel economy? Will consumers accept vehicle models with new fuel economy technologies? How will they trade off fuel economy improvements with other attributes? What are the prospects for alternative fuel vehicles (AFVs) and advanced technology vehicles (ATVs) in terms of cost, performance, and overall sales compared with conventional vehicles? This chapter addresses these and related questions of consumer impacts and acceptance of fuel economy technologies.
The chapter begins by looking at trends in the new vehicle characteristics over time. This provides context for the fuel economy standards and improvements in technology that have allowed for increases in both fuel economy and performance. The chapter then explores the issue of how consumers value fuel economy. A key premise of the regulation and a central part of the analysis of the costs and benefits of the new rules is that consumers undervalue fuel economy when they are considering new car purchases. This is evidenced by the net private savings for consumers in fuel costs relative to vehicle purchase price attributed to the rule (EPA/NHTSA 2012a, 62627). Despite a large body of literature on this issue, there appears to be no consensus on the extent to which consumers undervalue fuel economy or on how attitudes on this issue vary across the population. The chapter then turns to look in detail at evidence about consumer reaction to new technologies for fuel economy or to vehicles currently in the market. The chapter concludes with an assessment of the effect of the rules on affordability and sales.
TRENDS IN VEHICLE CHARACTERISTICS
Vehicle technology has been improving over time, and it is useful to look at the relative changes in characteristics during periods when fuel economy standards were increasing and when they were constant.
Evidence on Past Changes in Technology and Vehicle Characteristics
There is much data on average characteristics of the vehicle fleet over the past 40 years. This historical evidence shows trends in vehicle characteristics and technological change and indicates how those might be affected by such events as changes in fuel prices and fuel economy standards. Figure 9.1 shows the relative change in label fuel economy, the horsepower/weight ratio, and time to accelerate from 0 to 60 mph since 1975, using sales-weighted averages across the fleet. The average horsepower/weight ratio stayed relatively constant during the late 1970s while fuel economy increased rapidly. Both horsepower and weight were declining, but the ratio remained relatively constant. This was during the time when gasoline prices were relatively high and rising and the first CAFE standards were put in place.
The period from about 1985 to 2005 was a time with relatively low gasoline prices and constant CAFE standards for vehicles. There was substantial technological progress for vehicles during this period, and it appeared to go almost exclusively into better performance, such as horsepower and acceleration (EPA 2013; Knittel 2012). During this time there was a shift to larger vehicles in the on-road fleet—toward trucks and SUVs and away from cars. Average weight of vehicles increased, but Figure 9.1 shows that horsepower increased even more rapidly, so the horsepower/weight ratio increased while fuel economy stayed the same or fell slightly. Time to accelerate from 0 to 60 has been continually decreasing since 1982. According to MacKenzie and Heywood, “Ninety-five percent of vehicles sold today achieve a level of acceleration performance that beats the average from 1992,
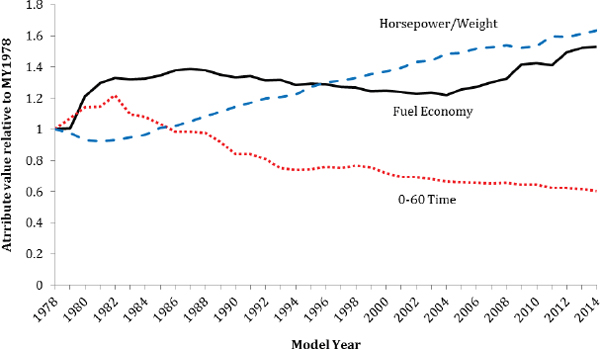
FIGURE 9.1 Label fuel economy, horsepower/weight ratio, and 0-60 mph acceleration time for MY 1978-2014 light-duty vehicles.
SOURCE: EPA (2014).
and would have put them in the top 5% in 1985” (2012). However, the rate of improvement in acceleration time has been decreasing in recent years.
The final period, from 2005, reflects important changes. Real gasoline prices started to increase rapidly around 2004, and new fuel economy standards were put in place: for light-duty trucks starting in 2005, further tightened in 2008, and for cars in the 2011 MY. Both the higher gas prices and stricter fuel economy standards tend to push fuel economy of the fleet higher, and fuel economy trended upward over this period.
The difficulty in drawing conclusions from Figure 9.1 about the relationship between performance, standards, and fuel economy is that a number of different factors are changing at the same time—gasoline prices, vehicle mix, CAFE standards, and the technologies. The variables may also not be independent of each other. For example, CAFE standards themselves have the effect of accelerating technological change in the vehicle market. Some have argued that the standards spur the rate of technology change or encourage the development of new technologies that would not otherwise have been developed (Jaffe et al. 2003). Those technologies have impacts not only on fuel economy but on other vehicle attributes as well. Klier and Linn (2013) find some statistical evidence that the light truck standards the U.S. adopted in 2007 contributed to technical change during the period from 2008 to 2012. It is unclear how much of the recent trend in greater fuel economy is due to new technology going to improved fuel economy of specific vehicles and how much is due to vehicle mix (more of the more fuel-efficient vehicles being purchased). Khanna and Linn (2013) look at this issue for 2000 to 2012 and find that about half of the improvement of roughly 4 mpg in the overall fleet is due to change in vehicle mix (market shares) and the other half to changes in technologies applied to specific vehicles.
It is clear from Figure 9.1 that vehicle technology has been continually improving over time. Figure 9.2 further illustrates this point. Knittel (2011) estimated the tradeoff between fuel economy and performance (measured in horsepower) in 1980 (blue dots) and 2006 (grey squares) and found that technological change has allowed for improvements in both fuel economy and horsepower over this period. The rate of improvement is approximately 2 percent per year.
Figure 9.2 shows the general trade-off between performance and fuel economy as well as the improvements in both vehicle characteristics between 1980 and 2006. Knittel (2012) extended his original analysis through MY 2011 and found continued technological progress, consistent with improvements in fuel economy of 1.97 and 1.51 percent per year from 2006 to 2011 for passenger cars and light-duty trucks, respectively, holding other attributes constant. These technology improvements provided opportunities for increases in both horsepower and fuel economy. A combination of market choices and regulations is likely to continue to determine the allocation of future technology change between performance and fuel economy.
Improvements in technology have also led to greater reliability. Figure 9.3 shows the results of a vehicle depend-
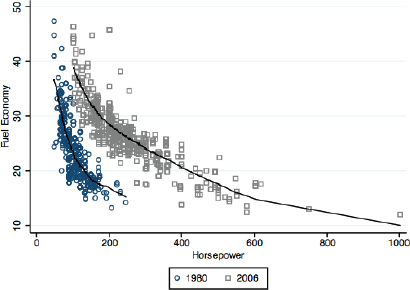
FIGURE 9.2 Fuel economy in miles per gallon (two-cycle certification CAFE) vs. horsepower, passenger cars in 1980 (blue dots) and in 2006 (grey squares).
SOURCE: Knittel (2011).
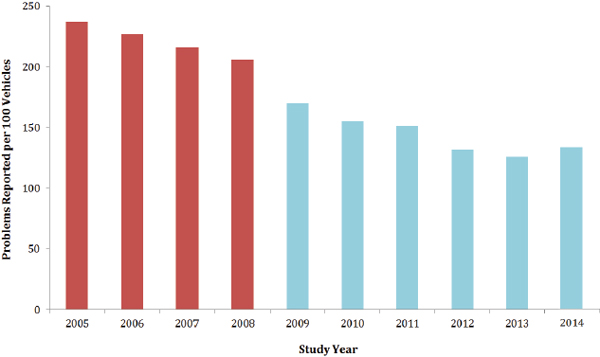
FIGURE 9.3 Results of J.D. Power U.S. Vehicle Dependability Study, in which owners of 3-year-old vehicles report problems they have experienced with their vehicles. Reported problems range from safety issues that required repair to consumer dissatisfaction with vehicle attributes. The figure colors change in 2008 to indicate a change in methodology in that year, preventing comparisons between the two periods, though the trend remains consistently downward.
SOURCE: Data from J.D. Power (2013).
ability study from 2013 that covers the years 2005-2013. Over this time period, owners of 3-year-old vehicles reported fewer problems in each subsequent year. Some of this increased reliability may be due to changes made to meet the longer warranty requirements for emissions control equipment and enhanced systems robustness with tightened onboard diagnostic monitoring requirements. In large part because vehicles are more dependable, they last longer in the fleet. The average age of both cars and trucks increased over the last 20 years, with the average age of vehicles increasing from 8.4 years in 1995 to 11.4 years in 2013.
Despite the many improvements in vehicle attributes and performance, the price of a new vehicle has risen relatively slowly over the last 20 years, increasing only about 5 percent since 1996 according to the Bureau of Labor Statistics (BLS 2014). In addition to the small increase in purchase price for new cars, there has been a shift in the variable versus fixed cost for driving new cars. Figure 9.4 compares variable and fixed costs of driving 15,000 miles, which is roughly a year of driving. Variable costs include fuel and maintenance costs and fixed costs include insurance, license, registration, taxes, depreciation, and finance charges. In the 1990s, declining gas prices and increases in fixed costs led to a declining share of total cost of driving attributed to fuel costs (or variable costs). However, in recent years, variable costs as a share of the total have been rising as a result of higher gasoline prices. Gas prices will continue to vary, increasing or decreasing the impact of fuel costs on the variable costs of driving.
Gasoline costs are likely to play an important role in how smoothly the CAFE standards are implemented in the coming years. There is evidence that consumers are more likely to purchase fuel-efficient vehicles when gasoline prices are high and less likely when gasoline prices are low. Figure 9.5 shows the trends in real gasoline prices, actual fuel economy, and the fuel economy standards for cars and trucks over time. Gasoline prices varied over the period but were generally high in the early 1980s, decreasing beginning in 1984, and were flat in real terms between 1988 and 2004. Since 2004, gasoline prices have trended upward except during the recession starting in 2008 and in the recent period starting at the end of 2014. Figure 9.5 also shows that the fuel economy standards themselves were relatively unchanged during the period from 1985 to 2011 (2004 for trucks) when real gasoline prices remained relatively low.
The actual fuel economy data in Figure 9.5 start in 1990 and show that fuel economy remains fairly flat through the 90s, starting to trend up when real gasoline prices begin to rise around 2004. Actual fuel economy continues to increase through the rest of the decade both because gas prices were sharply increasing until 2009 and because of increasing fuel economy standards for trucks starting in 2005 and cars starting in 2011. Some of the increases in fuel economy before 2008 may have been in anticipation of the standards as automakers overcomplied to bank credits for later use. Actual fuel economy is above the standards in nearly all of the years for this period except for trucks beginning in 2013. If real gasoline prices fall and remain low in the future and consumers choose larger vehicles or less-efficient used vehicles, the new, stronger CAFE/GHG standards may not deliver as much benefit as originally predicted, due to reduced sales of the more costly low-fuel-consuming vehicles.
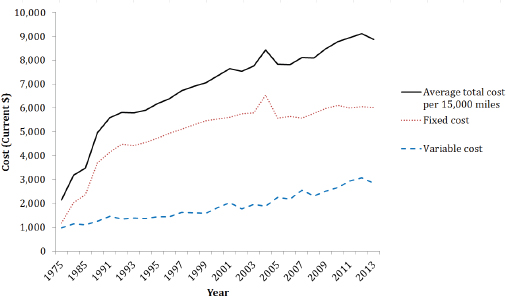
FIGURE 9.4 Average annual cost of driving a new car. The costs are an annual average over the first 5 years, assuming 15,000 miles driven per year, in current dollars. Variable costs include gasoline, maintenance, and tire costs. Fixed costs include insurance, taxes, depreciation, finance charges, license, and registration.
SOURCE: American Automobile Association (2013).
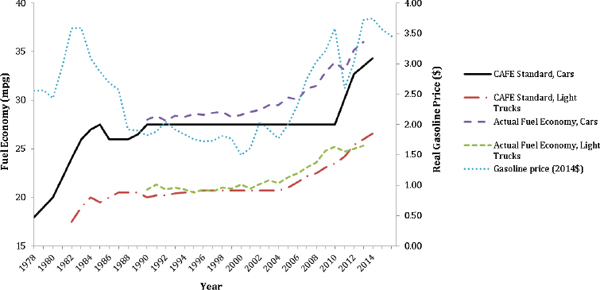
FIGURE 9.5 Fuel economy standards and actual fuel economy of cars and trucks by year plotted against real gasoline prices in 2014 dollars. All fuel economy standard and actual values are the certification fuel economy values.
SOURCE: DOT (2014); BTS (2014); EIA (2014).
Recent Changes in Fuel Economy
As shown in Figure 9.5, year-over-year improvements in fuel economy have occurred since about 2004 and will continue to occur at an accelerated rate due to stricter standards. Figure 9.6 illustrates some of the improvement that began in earnest from 2007 to 2010, focusing on the percent of vehicles in different miles per gallon categories. The percent of vehicles above 23 mpg increased from 14 percent to 50% percent in those 12 years.
Improvements in fuel economy were achieved across segments from 2009 to 2014, shown in Figure 9.7. Each segment showed a shift to a greater number of more fuel-efficient vehicle models in that period, though the study does not recognize the difference between SUVs and CUVs, nor does it describe how the fuel economy improvements were achieved.
In summary, technology used in vehicles has dramatically improved over the last three decades. The potential to trade-off fuel economy, horsepower, and other attributes has not remained fixed over time; innovation has pushed out the technology frontier for improvements to both fuel economy and other attributes. In recent years, some of this improvement has gone into better fuel economy or reliability, but much has gone to improving other vehicle attributes such as horsepower and acceleration. Fuel economy standards have impacted vehicle characteristics, but so have consumer preferences and gasoline prices. How consumers value fuel economy and other attributes is a critical question for the Agencies in setting standards and for vehicle manufacturers in selling vehicles. The economic theories attempting to understand consumer behavior are explained in the following sections, as are consumer responses to changing vehicle characteristics.
CONSUMER VALUATION OF FUEL ECONOMY: THE ENERGY PARADOX?
How consumers value fuel economy when they purchase a new or used car is critically important to evaluating the benefits and costs of fuel economy standards. The standards are essentially set based on the Agencies’ assessment of what technologies will be available and technically feasible, as long as the benefit of the entire rule exceeds the costs. Standard setting is further discussed in Chapter 10. Key considerations in understanding the standards’ impacts on consumers, automakers, and the country are whether or not the market undervalues future fuel savings relative to their expected full-lifetime discounted economic value, how that impacts the sales of vehicles with varying fuel economy, and how that bears on the need for standards, as well as the costs and benefits of these standards.
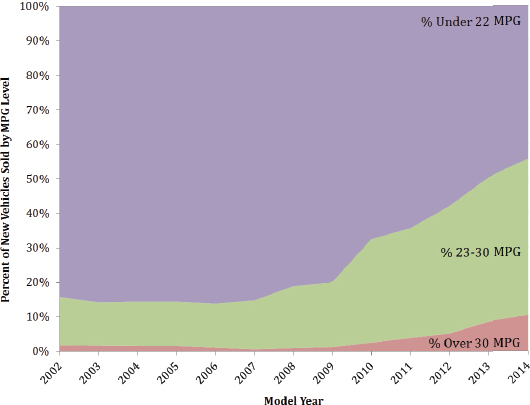
FIGURE 9.6 Percent of passenger vehicles in different label fuel economy categories by year. The percent of vehicles over 23 mpg increased from 14 percent to over 50 percent between 2002 and 2014.
SOURCE: Committee-generated, using data from Consumer Federation of America (2014).
What Is the Energy Paradox?
The “energy paradox” describes the seeming failure of markets for energy-using durable goods to adopt apparently cost-effective, energy-efficient technology (see Gillingham and Palmer 2013; Allcott and Greenstone 2012; Jaffe and Stavins 1994; Sanstad and Howarth 1994). In well-functioning markets, energy-efficient technologies should be applied up to the point where the cost of the last technology adopted equals the present value of the energy it will save. The existence of a substantial technological potential for cost-effective energy efficiency improvement that has not been implemented in the market contradicts the premise of a well-functioning market, hence the paradox. If the energy paradox exists, there are net energy savings for consumers, savings they would value, that are not being realized. Whether or not an energy paradox actually exists is the subject of continuing debate.
The Final Rule for the 2017 and later model year standards asserts that the rule will achieve cost-effective energy savings for car-buyers, implying the existence of an energy paradox:
Although the agencies estimate that technologies used to meet the standards will add, on average, about $1,800 to the cost of a new light duty vehicle in MY 2025, consumers who drive their MY 2025 vehicle for its entire lifetime will save, on average, $5,700 to $7,400 (7 and 3 percent discount rates, respectively) in fuel, for a net lifetime savings of $3,400 to $5,000. (EPA/NHTSA 2012a, 62627)
Whether such favorable results can be achieved by the standards not only affects their costs and benefits as reflected in consumers’ satisfaction with new vehicles but also affects manufacturers’ revenues, profits, and employment by virtue of the demand for new vehicles. If the Agencies’ estimates are correct and consumers perceive an increase in the value of an average new car of more than $5,000 at a cost of only $1,800, sales should increase. On the other hand, if consumers substantially undervalue future fuel savings (or if the Agencies’ estimates of the costs are incorrect), a price increase for fuel economy technologies would lead to decreased sales. If the market for fuel economy is already functioning optimally, consumers will be less satisfied, and sales and industry profits will be reduced. If, however, there are inefficiencies in the fuel economy market, public policy could save consumers money and increase industry profits (see Fischer et al. 2007; Allcott, Mullainathan, and Taubinsky 2012).
When comparing vehicles, the rational consumer of economic theory equates the additional cost of a more fuel-efficient vehicle to the present value of the future fuel
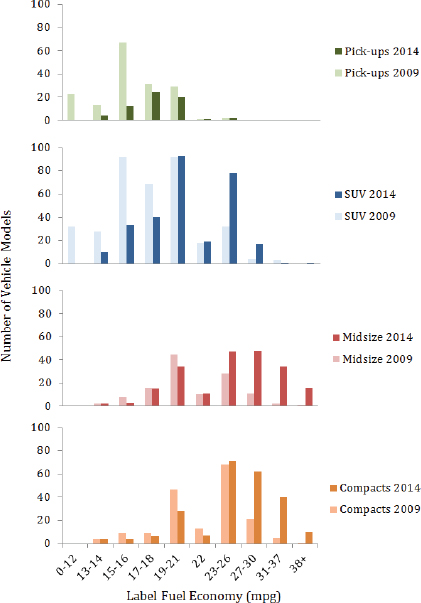
FIGURE 9.7 Number of models in several categories of label fuel economy. Between 2009 and 2014, there was a greater choice of vehicle models with better fuel economy across a variety of vehicle classes. Shown is the number of vehicle models available in 2014 and in 2009 by fuel economy range for both midsize vehicles and SUVs as an example.
NOTE: Compacts include small station wagons, and midsize includes midsize station wagons.
SOURCE: Data from Consumer Federation of America (2014).
savings it would provide, other things being equal. If consumers acted based on this model, then they should obtain the private benefits of fuel economy technologies without regulations. Mathematically, the present value, V, of future savings is the sum over the vehicle’s useful lifetime, L, of the product of the price of fuel in year i, Pi, miles traveled in year i, Mi, and the difference in fuel consumption per mile (1/E = 1/miles per gallon) between the lower (1) and the higher (2) fuel economy vehicle, (1/E1 − 1/E2), converted to present value at discount rate r.
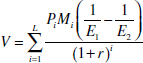
There is no doubt that typical consumers do not conform precisely to the fully informed, economically rational model. Obtaining accurate information about fuel economy improvements and costs, especially within vehicle packages, may be difficult if not impossible. Also, in calculating costs and benefits, the CAFE/GHG standards assume technolo-
gies are applied to fuel economy rather than performance, though in the real market, consumers will value and choose between many different attributes, some of which may be competing. While the above calculation may be beyond the capabilities of many vehicle buyers, they might develop accurate intuition based on their experiences or obtain the estimate from another source, such as a website or a mobile application. The question is how great the differences are and whether they cause important deviations from the ideal model in ways that fuel economy standards might either correct or exacerbate.
Undervaluation of fuel economy improvement creates what Herrnstein et al. (1993) termed an “internality,” a welfare loss that consumers impose on themselves when they fail to make optimal decisions.1 Internality inefficiencies affect only the efficiency of energy-using durable goods and not their utilization.2 This is in contrast to externalities associated with energy use, such as carbon dioxide emissions, which imply both underinvestment in energy efficiency and excessive consumption of energy services (e.g., vehicle travel). If both energy efficiency investment inefficiency internalities and energy use externalities are present, then it would be appropriate to implement a combination of policies targeting vehicle fuel economy, such as the CAFE/GHG standards and externality taxes. The distinction between externalities and energy efficiency investment inefficiencies is important because it provides a theoretical basis for economically efficient fuel economy regulations.
A fuel tax could be a policy means to correct a market externality, but it might not correct market inefficiencies in investments in fuel economy. If consumers undervalue fuel economy, then a tax on fuel equal to the marginal externality costs of fuel use would not lead to a social-welfare-maximizing market outcome for fuel economy. This is because consumers would continue to undervalue the savings (fuel cost plus tax) due to improved fuel economy. Under such conditions, Allcott et al. (2012) show that a combination of an externality tax on fuel and subsidies to efficient vehicles can maximize social welfare. If properly designed, a “feebate” consisting of a fee on inefficient vehicles with rebates to efficient vehicles can be an efficient internality tax. Likewise, an efficiency regulation that induces an appropriate shadow price on energy efficiency combined with a tax on petroleum can also be an economically efficient solution. If markets systematically underinvest in fuel economy, regulatory standards could be part of an economically efficient solution.
Why an Energy Paradox?
Numerous potential explanations for the energy paradox have been proposed. Market inefficiencies can be caused by existing regulations, asymmetric information, transaction costs, inefficient capital markets, bounded rationality,3 and deviations from perfect market assumptions (Sanstad and Howarth 1994). Some explanations focus on the difficulty of obtaining accurate information and limitations on consumers’ cognitive skills. More recently, behavioral psychologists have added behavioral anomalies to the list of possible explanations causing deviations from the economic model of the rational, utility-maximizing consumer (see Kahneman 2011). Researchers have identified several systematic behaviors that cause decision utility (the satisfaction consumers maximize when they make a choice) to differ from experienced utility (the satisfaction consumers receive when experiencing the consequences of their choice) (Gillingham and Palmer 2013).
Loss aversion, the most firmly established theory of behavioral economics, has also been proposed as a possible explanation for the energy paradox (Greene et al. 2010). In theory, the rational economic consumer possesses all the information and computational skills necessary to make an optimal choice. Yet, as Jaffe and Stavins (1994) pointed out, markets may inadequately provide information to consumers creating uncertainty about the values of different products, about a vehicle’s fuel economy, for example. Behavioral psychologists have demonstrated that human beings faced with a risky bet typically consider potential losses to be twice as important as potential gains (Kahneman 2011). Paying a higher purchase price to obtain future fuel savings is, in fact, a risky bet (Greene et al. 2010). What a vehicle’s fuel economy will be in actual use,4 what the price of fuel will be in the future, how long a vehicle will last, and how many miles it will be driven are all uncertain at the time of purchase. These uncertainties make the value of future fuel savings a probability distribution rather than a fixed quantity. By quantifying the uncertainty about future fuel savings, Greene (2011) showed that loss aversion alone could explain undervaluing future fuel savings by a factor of two or more relative to expected value.
A key property of loss aversion is that it is context-dependent. That is, if consumers do not perceive their choices as risky bets, loss aversion does not come into play. This could be relevant to evaluating fuel economy regulations, where the context will be a choice between two vehicles,
_____________
1 Under the loss aversion model presented subsequently, the failure to optimize is in fact only a failure to optimize based on the expected value of fuel savings.
2 Energy efficiency indirectly affects vehicle utilization via the energy cost per mile driven, but an undervaluation of fuel economy internality does not directly affect vehicle utilization.
3 The concept of bounded rationality acknowledges that not all consumers will have the technical skills or the time needed to make optimal decisions even if all the necessary information is available to them.
4 Rated fuel economy values are estimates of the average fuel economy for all drivers. The fuel economy an individual driver gets will vary with driving style, traffic conditions, temperature, terrain, and more. Lin and Greene (2011) found that while EPA label miles per gallon estimates were relatively unbiased predictors of fuel economy estimates reported by individuals, the variance was quite large: a 2 standard deviation interval was approximately +/− 30 percent.
both of which are more fuel efficient and more expensive, rather than a choice between two vehicles, one of which has lower fuel economy and a lower price and the other of which has higher fuel economy and a higher price. If a consumer faces the choice of paying a few thousand dollars more for a hybrid vehicle that promises much better fuel economy than a nearly identical conventional vehicle, the choice may be seen as a risky bet. On the other hand, if fuel economy regulation raises the price and fuel economy of every vehicle in the market, consumers might not perceive the marketwide increase in fuel economy as a risky bet, so loss aversion would not apply. As noted above, standards will not remove all uncertainty from the consumer decision, but the uncertainty surrounding whether to pay for fuel economy technology will be reduced as there will only be higher fuel economy, higher priced choices. Uncertainty associated with being in the new vehicle market as opposed to the used vehicle market will also decrease as used vehicles improve in fuel economy. Scientific research in this area is at a very early stage, however, and there is as yet no consensus on how the theories of behavioral economics should be applied to consumers’ decisions about fuel economy. There are many more statistical and econometric analyses of consumers’ fuel economy choices, yet the evidence on the existence of the energy paradox is inconclusive.
Empirical Evidence of How Consumers Value Fuel Economy
Much of the prima facie evidence for the existence of an energy paradox comes from engineering–economic assessments of the cost and efficiency potential of energy technologies. Past NHTSA rulemakings (e.g., EPA/NHTSA 2012a), past NRC evaluations (e.g., NRC 2002, 2011), and other studies (see, e.g., Greene and DeCicco 2000, who review older studies) found substantial potential for fuel economy increases for which future fuel savings exceed the upfront cost but which the market had not adopted. However, none of these studies account for the opportunity cost of using technologies to improve fuel economy rather than to improve the acceleration performance or increase the size of vehicles. The potential significance of opportunity cost to the consumer is discussed later in this chapter. The impact of the possible opportunity cost on the overall cost and benefit of the regulation is discussed in Chapter 10.
During its information-gathering process, the committee found that auto manufacturers perceive that typical consumers would pay upfront for only one to four years of fuel savings, a fraction of the lifetime-discounted present value. Short payback periods imply high discount rates for fuel economy, which may indicate undervaluation of fuel economy relative to its net present value, though, as discussed below, there are other explanations for the apparent short payback periods. The academic literature, on the other hand, is nearly evenly divided between supporting and contradicting the existence of an energy paradox for motor vehicle fuel economy.
Despite the economic importance of the fuel economy standards, there has been relatively little research aimed at understanding how consumers use fuel economy information when making vehicle purchase decisions. In apparently the only study of its kind, Turrentine and Kurani (2007) conducted in-depth interviews with 57 California households across nine “life-style sectors” about their entire histories of car-buying decisions and the role that fuel economy played in their choices. They began by compiling a history of the households’ car ownership decisions and asking about the reasons for buying and selling the vehicles, eventually guiding the respondents to talk about fuel economy. They found that none of the 57 California households they interviewed had ever analyzed their fuel costs in a systematic way in their vehicle purchases. Very few kept track of their gasoline costs over time or factored them into household budgets. The researchers concluded that
One effect of this lack of knowledge and information is that when consumers buy a vehicle, they do not have the basic building blocks of knowledge assumed by the model of economically rational decision making, and they make large errors estimating gasoline cost savings over time. (Turrentine and Kurani 2007, 1213)
Lack of knowledge about fuel savings could be overcome by expert services if consumers’ willingness to pay for those services exceeded their costs (or if the service were free). Yet Turrentine and Kurani’s (2007) research found that the consumers in their survey did not take advantage of such services when making purchase decisions. Sallee (2013) concluded that average consumer losses due to making fuel economy choices based on incomplete information would be $100 to $300 per vehicle. Although this is not large enough to explain all of the undervaluation of fuel economy technologies, it could be one of several contributing factors.
Consumer ability to intuitively estimate fuel cost savings when comparing automobiles was tested by Allcott (2013) using a nationally representative computer-aided survey of 2,100 U.S. households. Consumers’ estimates of the fuel cost differences between the vehicle they chose to purchase and a second best alternative were divided by the “true” fuel cost difference to produce a “valuation ratio.” However, the “true” cost differences were calculated based on EPA label ratings. This raises two difficulties for interpreting the results. First, any given consumer’s actual on-road fuel economy will differ from the EPA rating due to driving style, traffic conditions, trip lengths, speed, temperature, terrain, and other factors. Second, although there is empirical evidence concerning the bias of the EPA label ratings used until 2008 (see Lin and Greene 2010; Hellman and Murrell et al. 1984), there has been inadequate empirical measurement of the bias of the ratings revised in 2008 versus real-world experiences of motor-
ists. Thus, the “true” fuel cost estimate may or may not be a biased estimate of the mean fuel costs for all consumers and will, in general, not be an accurate estimate of the fuel costs of a particular consumer. The results from Allcott (2013) indicate that consumers undervalue fuel economy, on average by 12 percent, and that 50 percent of consumers undervalue it by 30 percent or more. A complication is that the fuel economy and fuel cost differences between consumers’ first and second choice vehicles were often small. Also, because the EPA ratings are not likely to be the actual fuel economy achieved by any given respondent, the accuracy of consumers’ estimates is confounded with the accuracy of Allcott’s measure of “true” fuel costs.
Larrick and Soll (2008) found that consumers significantly undervalued fuel economy improvements for low-mpg vehicles and overvalued improvements for high-mpg vehicles. This “mpg illusion” caused consumers to value miles per gallon differences equally, regardless of the level of fuel economy. Thus, the 10 mpg difference between a 10 mpg and a 20 mpg vehicle tended to be considered equivalent to the 10 mpg difference between a 30 mpg and a 40 mpg vehicle, even though the fuel savings would be six times as great for the 10 mpg to 20 mpg difference. The mpg illusion implies that car buyers will overvalue fuel economy increases for high-mpg vehicles relative to low-mpg vehicles, but it does not necessarily imply a general underutilization of fuel economy technologies. Allcott (2013) also found that his survey results supported the existence of an mpg illusion, though the magnitude of the effect was small.
A recent survey of the econometric literature from 1980 to 2009 found it nearly evenly split between studies that support the hypothesis of rational economic behavior toward automotive fuel economy and those that support a significant undervaluing of fuel economy by car buyers (Greene 2010). Summarizing the evidence from econometric studies of vehicle choice, Helfand and Wolverton (2011) concluded that 12 studies found significant undervaluing of fuel economy relative to its expected value, 8 studies concluded that consumers were close to the expected value, and 5 studies found consumers significantly overvalued fuel economy (Table 9.1). The authors attributed the widely varying results to difficulties in statistical inference in the complex, multiattribute vehicle choice decision and to the lack of a clear theoretical consensus about how consumers actually do evaluate fuel economy when comparing vehicles. Further complicating the issue is the fact that consumers are heterogeneous in their willingness to pay for fuel economy due to differing rates of vehicle use and differing discount rates among other factors (Allcott and Wozny 2014).
Studies published since the literature reviews have also reached mixed conclusions. The effects of gasoline price on consumer willingness to pay for vehicles of different fuel economies were analyzed by Busse et al. (2013). As the authors state, their analysis estimates the short-run effect of gasoline prices on consumer willingness to pay in that it is based on consumer comparisons among existing makes and models. It did not consider the long-run effect of manufacturers redesigning vehicles and adding fuel economy technologies. Testing a variety of assumptions about vehicle usage, lifetime, and price elasticities of supply and demand, the study inferred implicit discount rates for future fuel costs ranging from 20.9 percent per year to 6.8 percent per year, with an overall average of 6.8 percent, and averages for new and used vehicles of 2.6 percent and 8.8 percent, respectively. The mean values imply discount rates consistent with consumers’ borrowing costs over the period of the study. The authors interpreted the estimates as not supporting undervaluation of future fuel costs by car buyers.
Whether consumers value future fuel savings at more or less than their discounted present value was evaluated by Allcott and Wozny (2014) using data on transaction prices of 83 million used-vehicle sales from 1999 to 2008. Discounted present value was calculated based on each vehicle’s estimated remaining lifetime and miles. A discount rate of 6 percent was used, derived from a weighted average of actual automobile loan interest rates and the opportunity cost
TABLE 9.1 Studies on Consumer Valuation of Fuel Economy
| Undervaluation of Fuel Economy | “About Right” Valuation of Fuel Economy | Overvaluation of Fuel Economy |
| Allcott and Wozny (2009)a | Brownstone et al. (1996) | Brownstone et al. (2000) |
| Arguea et al. (1994) | Dasgupta et al. (2007) | Cambridge Econometrics (2008) |
| Berry et al. (1995) | Espey and Nair (2005) | Gramlich (2008) |
| Bhat and Sen (2006) | Goldberg (1995) | Sawhill (2008) |
| Busse et al. (2009) | Goldberg (1998) | Vance and Mehlin (2009) |
| Eftec (2008) | Klier and Linn (2008) | |
| Fan and Rubin (2010) | McManus (2007) | |
| Feng et al. (2005) | Sallee et al. (2010) | |
| Fifer and Bunn (2009) | ||
| Kilian and Sims (2006) | ||
| Langer and Miller (2008) | ||
| Train and Winston (2007) | ||
a This is an earlier version of Allcott and Wozny 2014.
SOURCE: Helfand and Wolverton (2011).
of capital (for purchases made with cash). How consumers value future fuel costs was inferred based on the effects of changes in gasoline price on vehicle transaction prices. A key factor is consumers’ expectations regarding future fuel prices. Two alternatives were considered: (1) estimates based on oil market futures prices and (2) the assumption that current price was the best predictor of future prices. The latter “no change” assumption is consistent with the findings of an extensive analysis of national survey data on consumers’ expectations about future gasoline prices from 1993 to 2010 (Anderson, Kellogg, and Sallee 2011). It is also consistent with the observation that oil prices from 1947 to 2008 are not statistically different from a random walk without drift (Hamilton 2009; Alquist and Killian 2010; Alquist et al. 2010). Allcott and Wozny found that, on average, consumers undervalued future fuel costs by about 45 percent using the better supported assumption and 24 percent if price forecasts based on futures markets were used. Consumer response to fuel price changes may be more complicated. Kilian and Sims (2006) found that consumers appear to fully value future fuel costs when gasoline prices increase but virtually ignore them when gasoline prices decrease.
Implicit consumer discount rates for the fuel savings of hybrid vehicles were estimated for the United States by Gallagher and Muehlegger (2011). The estimation assumed static fuel price expectations (consistent with fuel prices following a random walk). It also assumed that hybrid buyers would not count fuel savings over the entire expected life of the vehicle. The latter assumption was justified on the basis of either consumer short-sightedness or the failure of used car markets to attach any value to the hybrids’ higher fuel economy. Of course, neither assumption is consistent with the model of the economically rational consumer. Five different model formulations were tested as well. The estimated discount rates ranged from a low of 13.0 percent for an assumed 5-year vehicle life to 41.8 percent for an 8-year life. Since U.S. light-duty vehicles typically last 14 years or more, these results would imply very high discounting of future fuel savings over the full expected life of a typical vehicle (NHTSA 2006; Davis et al. 2013, Table 3.12).
There is also empirical evidence supporting loss aversion as a possible cause of the energy paradox. Greene (2011) showed that if consumers accurately perceived the upfront cost of fuel economy improvements and the uncertainty of fuel economy estimates, the future price of fuel, and other factors affecting the present value of fuel savings, the loss-averse consumers among them would appear to act as if they had very high discount rates or required payback periods of about 3 years. Weighing potential losses (the possibility that upfront cost would exceed uncertain future savings) twice as much as potential gains results in a similar undervaluing of future fuel savings relative to their expected value. Four nationwide random sample surveys of 1,000 respondents each, conducted between 2004 and 2013, showed that consumers considered fuel economy ratings and future fuel prices to be very uncertain (Greene, Evans, and Hiestand 2013). The surveys also produced consistent evidence that consumer willingness to pay for fuel savings implies average payback periods of 2-3 years. Some respondents were asked about their willingness to pay for a given annual fuel savings while others were asked about the fuel savings that would justify a given price increase. The distribution of payback periods was very similar regardless of which way the question was posed. Nearly identical distributions of payback periods were observed for respondents who typically purchased new vehicles and those who purchased used, indicating no difference in the way fuel economy is valued in the two markets. The responses showed a wide dispersion of implied payback periods that were not strongly correlated with the attributes of the respondents, a result that is consistent with evidence about loss aversion from behavioral psychology studies. The payback periods calculated in these studies are also consistent with automobile manufacturers’ statements to the committee about consumer willingness to pay for fuel economy improvements.
Public perception of the standards should be weighed along with other evidence concerning the nature of the market for fuel economy. If fuel economy standards force manufacturers to produce vehicles with too much fuel economy, too little performance and size, and too high of a price, one might expect the public to disapprove of the standards. On the other hand, if consumers are satisfied with the new, higher fuel economy vehicles (as, for example, the theory of loss aversion would imply) one would expect them to approve of the standards. There is a great deal of survey research on consumers’ opinions of the desirability of raising fuel economy standards and the results are remarkably consistent over time.
Public Perception of Fuel Economy Standards
The public’s perception of the CAFE standards and support for raising the standards has been highly positive for the past 25 years. Seven surveys conducted between 1988 and 1997 by groups including the American Automobile Association and the Alliance to Save Energy reported public support for raising fuel economy standards ranging from 72 percent to 95 percent (Greene and Liu 1998, Table 3). Most surveys did not make statements about the pros or cons of the fuel economy standards before asking respondents’ opinions of them; however, those that did showed decreases in support when costs of the standards were asserted in framing the question. More recent polls continue to reflect high levels of public support for fuel economy standards (Table 9.2).
The consistently high support for raising fuel economy standards is noteworthy. It is possible that after almost 35 years of experience with fuel economy standards consumers do not understand that they pay more for higher fuel economy vehicles or sacrifice other vehicle attributes. Manufacturers generally expressed concern that consumers would not be willing to pay for the price increases necessary
TABLE 9.2 Recent Surveys Show High Public Support for Fuel Economy Standards
| Study | Result | |
| Knowledge Networks for Program on International Policy Attitudes, January 2005 | 77% supported higher fuel economy standards even when they were told, “. . . it would cost more to buy or lease a car.” | |
| Pew Research Center, 2006 | 86% favored requiring better fuel efficiency for cars, trucks and SUVs while only 12% opposed | |
| The Mellman Group (for Public Opinion Strategies), November 2007 | 86% answered “favored” or “strongly favored” to the following question: “Do you favor or oppose requiring the auto industry to increase fuel efficiency, that is, increase the average miles per gallon of gasoline that cars, trucks and SUVs get? 71% answered strongly favored | |
| Gallup, March 2009 | 80% of Americans said they favored higher fuel efficiency standards for automobiles, with 19% opposed. | |
| Consumer Federation of America, May 2011 | “Do you support or oppose the federal government requiring auto companies to increase the fuel economy of the vehicles they manufacture?” Among Republicans, 70% chose somewhat or strongly support; support by Independents and Independents leaning Republican was 69%; support among Democratic voters was 81% and 85% of Independents leaning Democratic supported fuel economy requirements. | |
| Pew Clean Energy Program, July 2011 | 82% of respondents supported increasing fuel economy standards to 56 mpg by 2025 | |
| Consumer Reports, October 2011 | 77% of the public supported increased fuel economy standards in a U.S. nationally representative probability poll | |
to cover the increased costs of vehicles that could meet the 2025 standards. It is also possible that consumers do understand that standards increase the price of vehicles as well as their fuel economy and prefer the higher fuel economy outcome. In either case the overwhelmingly positive and consistent public support for fuel economy standards casts further doubt on the fully informed, economically rational model as applied to consumers’ fuel economy choices.
Summary of Consumer Valuation of Fuel Economy
How markets actually value increases in new vehicle fuel economy is critical to evaluating the costs and benefits of fuel economy and GHG standards. Unfortunately, the scientific literature does not provide a definitive answer at present. Academic studies that have analyzed the evidence on consumer willingness to pay for increased fuel economy are mixed, with some studies finding little evidence of undervaluation and others finding evidence of significant undervaluation. A range of theories and explanations is put forward for why consumers may undervalue fuel economy, and some have argued that what appears to be undervaluation may in some cases be differences in preferences and circumstances among consumers. Automobile manufacturers’ statements and survey evidence tend to support the view that consumers expect a quick payback for a vehicle with higher fuel economy, all else being equal. Survey evidence also indicates broad and consistent public support for raising fuel economy standards over the past 30 years.
In the committee’s judgment, there is a good deal of evidence that the market appears to undervalue fuel economy relative to its expected present value, but recent work suggests that there could be many reasons underlying this, and that it may not be true for all consumers. Given the importance of this question to the rationale for regulatory standards and their costs and benefits, an improved understanding of consumer behavior about this issue would be of great value.
AUTOMAKERS’ RISK AVERSION TO SUPPLYING GREATER FUEL ECONOMY
In addition to inefficiencies in how consumers value fuel economy, the Agencies in their Final Rule also raise a supply-side problem—that automakers may be risk-averse to investing in fuel efficiency and therefore undersupplying fuel economy to the marketplace in the absence of regulation (EPA/NHTSA 2012a, 2012b). The Agencies posit two reasons why this could be true: uncertainty of future consumer demand for improved fuel economy and irreversibility of the large capital investments required. While the Agencies note that risk aversion by itself does not necessarily indicate a market failure, they state that manufacturer risk aversion would lead to an underprovision of fuel economy and that increasing fuel economy standards can lead to a more optimal solution by reducing the risk for manufacturers of investing in fuel economy.
Besides poor understanding of how consumers currently value fuel efficiency, the Agencies point out that automakers face additional uncertainty in predicting future consumer demand because it appears to evolve based on a number of factors that are difficult to forecast, such as future fuel prices, economic cycles, especially recessions, and the impact of marketing efforts. The Agencies point out that consumer valuation of fuel efficiency can change more rapidly than the industry is able to change its product offerings. Long lead times for production decisions exacerbate the uncertainty since automakers must make decisions on the level of fuel efficiency years in advance, but consumer demand can
change in much shorter time frames in reaction to external events such as fuel price increases and recessions.
The Agencies also raise the possibility that in the absence of higher standards, automakers are risk-averse due to the “irreversibility” of the large capital investments necessary to develop and market fuel-efficiency technologies. According to the Agencies, the effect of this irreversibility is that for a risk adverse company, being a first mover may appear to have a greater downside risk than upside risk; that is, there is a “first mover disadvantage.” If the Agencies are correct, the risk of oversupplying the market is greater than the risk of undersupplying the market. The risk of oversupplying the market is that a manufacturer will not be able to recoup its investment. The risk of undersupplying the market is a loss of market share in the short run, but the manufacturer still has the option of investing in fuel efficiency and regaining some if not all of its lost market share. If the industry as a whole is risk-averse, then large-scale adoption of fuel-efficiency technologies may not occur. Sunding and Zilberman (2001) showed that for a risk-averse company, delaying adoption of a new technology in order to gain more information may be more profitable than adopting a new technology. Blumstein and Taylor (2013) note that firms may choose not to produce a more efficient product because the product will increase costs without creating a long-term competitive advantage. There is some evidence that the auto industry exhibits risk-averse behavior. In explaining the lack of innovation in the highly concentrated auto industry in the mid-1980s, Kwoka (1984) noted that quality was considered too uncertain and risky to create a competitive advantage and safer bets were comfort, convenience, power, and style.
As noted by the Agencies, requiring all manufacturers to increase fuel economy can reduce the manufacturer’s perceived or actual risk of investing in a fuel economy strategy and potentially lead to a more optimal provision of fuel economy in the marketplace. Furthermore, since consumers tend to be risk-averse in adopting new technologies, having more widespread penetration of the new technologies reduces the perceived consumer riskiness of that new technology. Finally, higher volumes will bring down the costs of the fuel efficiency technologies through economies of scale, learning curves, and more rapid innovation. Reducing the costs will reduce the riskiness of the investment by accelerating consumer adoption, allowing for faster cost recovery.
As noted by Blumenstein and Taylor (2013), economic theory says that the rate of innovation is likely to be suboptimal when the returns to society from innovation are greater than the returns to the innovator. Innovation to improve fuel economy has important social benefits from reduced oil use and lower GHG emissions, so subsidizing R&D efforts for fuel economy, such as through tax credits or grants for companies, could have important spillover social benefits. Blumstein and Taylor 2013 also note that in the literature there is anecdotal evidence that suggests the existence of supply-side problems in the energy efficiency markets, including principal/agent problems, first mover disadvantage, price discrimination, and suppression of new technology. Principal/agent problems are a type of market failure where the person making the investment, in this case in fuel economy, is not the person who will reap the benefits. Fischer (2010) finds that market power gives manufacturers a strategic incentive to price-discriminate by overproviding fuel economy in vehicle classes whose consumers, on average, value it more than consumers of vehicles of other classes, and underproviding it in classes whose consumers value it less.
The recent era of higher gasoline prices (2005 to 2014) provides some anecdotal evidence that tighter standards can play an important role in providing longer-term planning certainty for automakers. The 2008-2011 MY light-truck fuel economy standards and the first National Program standards for 2012-2016 MY helped create a predictable, stable regulatory environment that provided greater certainty for the automakers’ investment plans. These standards may have also motivated some manufacturers to overcomply with the CAFE/GHG standards in these years to earn credits to be used in future years. The Alliance of Automobile Manufacturers, one of the primary industry associations for automakers, voiced its members’ support for the 2009 National Program agreement, in large part due to this long-term planning certainty (Alliance of Automobile Manufacturers 2009). Domestic manufacturers of large vehicles have particularly benefited from the new footprint standards since it provides them an incentive to improve all their vehicles rather than shift to smaller cars. According to an Automotive News article from 2011
Many automakers believe that the work they’ve done since the last big [gas] price surge, and in anticipation of higher government fuel-economy standards, leaves them better prepared this time, with stables of more competitive small cars and crossovers. . . . It could be a fairer fight this time. GM and Ford not only have more competitive small cars, but hot-selling crossovers such as the Chevrolet Equinox and Ford Edge that could benefit if consumers abandon big SUVs. (Colias 2011)
Another way of viewing the auto industry is that there is substantial competition between original equipment manufacturers (OEMs) that prompts them to take innovative risks to see what customers will buy. In order to mitigate risk while pursuing innovation, an OEM is likely to start implementation on a small scale and gauge consumer reaction over a period of time. Even in the presence of risk aversion, this innovation could eventually lead to efficient provision of fuel economy if consumers demonstrate willingness to pay full value for a technology. If a manufacturer found that market share (and maybe higher-than-average profits) could be gained by providing an efficient level of fuel economy, others would follow. Once the industry learned that consumers were willing to pay the full expected lifetime-discounted
value for fuel savings, essentially all manufacturers would provide it.
EVIDENCE ON CONSUMER VALUE FOR VEHICLE ATTRIBUTES
To better understand the impact of fuel economy standards on consumers, it is important to look not just at how consumers value fuel economy, but also at how they value other attributes in the bundle of vehicle characteristics. This can suggest how they might trade-off characteristics as a result of the standards.
It is clear from past trends in vehicle performance that buyers value attributes such as horsepower and acceleration. There have been some attempts to infer the value that consumers place on different vehicle attributes (Greene and Liu 1988). Whitefoot and Skerlos (2012) summarize the ranges of values that can be inferred from this literature (Table 9.3).
The estimates vary a great deal for all of the attributes. There are a number of reasons for this. One is that there are very few studies that have attempted to carefully estimate the value of these attributes to consumers. A major difficulty with empirical estimates is that the attributes tend to be related (i.e., not independent of each other). This makes statistical analyses that attempt to value each separately very challenging. Though the Whitefoot and Skerlos study shows that the value to consumers of fuel economy is greater than the value of acceleration (Table 9.3), Klier and Linn (2012) recently attempted to carefully address the interdependence issue and found that, on average, the value of a proportionate improvement in acceleration is greater than a similar percentage improvement in fuel economy. Another reason for the variation in estimates is that consumers are different, and the range of estimates may simply reflect these differences in value for a variety of vehicle attributes.
Given the value of different attributes, it is important to ask how the characteristics of the vehicle fleet will change in the future: first in the absence of the new standards and then with the standards. The Agencies’ assessments rely on the central Annual Energy Outlook forecasts of gasoline prices, which have them rising only slightly above 2012 levels in real terms by 2025 ($3.87/gal) (EPA 2012, 491). With relatively constant gasoline prices, the Agencies assume that manufacturers in the reference case without standards will not adopt more fuel-efficient technologies on their own and cite the evidence discussed above in the section Trends and Vehicle Characteristics for 1985-2005 as justification.
TABLE 9.3 Inferred Willingness of Consumers to Pay for Vehicle Attributes
| Vehicle Attribute | Range of Willingness to Pay for Attribute ($) |
| Additional square foot of vehicle size | 366-2,150 |
| Increase of 0.01 hp/lb in acceleration | 97-3,345 |
| Reduction in fuel consumption of 1 gal/100 miles | 468-3,826 |
SOURCE: Whitefoot and Skerlos (2012).
However, technological progress is likely to continue and other characteristics are likely to improve as they have in the past. If technology in the absence of the standards were to increase horsepower, for example, the horsepower function would continue to rise while fuel economy would remain flat (weight could increase if the fleet mix shifts toward larger vehicles). With the standards in place, fuel economy would improve and the Agencies would hold horsepower and other characteristics constant in evaluating the cost and effectiveness of technologies that could be used to meet the standards. The Agencies do acknowledge that maintaining a reference or baseline case that shows no change in other attributes in the absence of standards is a potential problem with their analysis but do not attempt to address it (NHTSA 2012, 813). The technology frontier is likely to continue to shift out, so there will be opportunity costs that are not being considered. This issue is addressed more fully in the assessment of costs and benefits in Chapter 10.
The Agencies suggest a different argument in the Final Rule: that the market for the other attributes that the technologies could provide—greater power, acceleration, and size—may not have been bundled optimally for consumers in the past. One example of this is that consumers have been switching from the less-fuel-efficient, truck-based SUVs to more fuel-efficient, car-based crossover utility vehicles (CUVs) which have less capability for towing and off-road uses. It turns out that manufacturers may have been oversupplying the market with vehicles having greater heavy-duty capabilities compared to what consumers might otherwise have chosen.
It is important to assess the value consumers place on fuel economy and other vehicle attributes and how those values may change over time. The next section reviews consumer responses to recent technologies available on vehicles in the market today.
Consumer Responses to Recent Changes in Technology
New technologies will be introduced to improve performance and fuel economy, some of which elicit consumer responses that could affect overall vehicle sales. Called “consumer-facing” technologies, these new technologies include hybrids (HEVs), plug-in electric vehicles (PEVs), turbocharged engines, new types of transmissions, such as dual clutch transmissions (DCTs), and diesel vehicles, among others. In addition to the greater fuel economy accompanying new fuel efficiency technologies, consumers may have other positive user experiences:
- Improved low-speed torque (turbocharged engines, HEVs, PEVs);
- Improved acceleration, shift quality, and reduced engine noise while cruising (transmissions with more gears and larger ratio spreads);
- Smoother acceleration and a quiet ride (HEVs);
- Greater convenience of refueling at home (PEVs); and
- Lower and more certain fuel costs (electricity vs. gasoline for PEVs).
There may also be a reduction in attributes:
- Shorter range between refueling (limited-range battery electric vehicles [BEVs]);
- Loss of trunk space (compressed natural gas vehicles, CNGVs, and hydrogen fuel cell vehicles [FCEVs]);
- Performance issues (e.g., shift optimization resulting in noise, vibration, and harshness (NVH) and shift busyness, start-stop hesitation, turbo lag, and drivability concerns with dual-clutch transmissions (DCTs)); and
- Consumer dissatisfaction with and distrust of label fuel economy relative to in-use fuel economy, particularly for high-fuel-economy vehicles.
When the committee was formed in early 2012, concerns existed about the evolving utility of vehicles due to new technologies such as BEV range anxiety and the NVH of driving a vehicle equipped with a dual-clutch transmission or stop-start. Now, more than 2 years later, manufacturers have made tremendous strides in addressing flaws and limitations of some new gearboxes and other technologies. Concerns and issues still exist, but the speed with which manufacturers can and have addressed problems is impressive. These rapid improvements are due in large part to the fact that so many of the powertrains and technologies of today are electronic or computer-assisted, allowing for minute adjustments and calibrations to very complex machinery.
General Motors (GM) recently employed a short time frame for changes to its Chevrolet Malibu, for example. The vehicle was completely redone for MY 2013 but GM announced a change to its 2.5L four-cylinder engine, adding stop-start technology for MY 2014. “The days of waiting to make changes based on traditional timing cycles is a thing of the past,” said John Hanh, brand marketing manager for the Chevrolet Malibu. “We’re going to react to customers as quickly as we can when we develop new technology and the customer needs it” (Mateja 2013; Pund 2013). GM stop-start implementation has been well received in the marketplace (Nagy 2014).
Not all consumer dissatisfaction with new technologies is as easily fixed, however. Some manufacturers have received such negative responses about the performance of some implementations of stop-start technology, for example, that they provide the option of disabling stop-start at each vehicle start. Other consumers have requested adjustments to the transmission shift calibration because they felt the shifts from gear to gear were too obvious or frequent, particularly on seven-, eight-, and nine-gear boxes. Some technologies require new behavior from the driver, as happened when antilock brakes were introduced, while others involve a consumer learning the new feel of driving a car with, for example, more gears.
A look at history shows examples of American consumers knowingly sacrificing some fuel economy for convenience and performance. For example, until recently, standard transmissions typically experienced better fuel economy than an automatic when used in like-for-like products, but so few Americans purchased standard transmissions that only a few OEMs even offered them on a handful of products. This trade-off is being altered by technology improvement. New technologies developed for automatic transmissions such as dual-clutch provide both the convenience of an automatic and better fuel economy than standard versions. Consumer wishes remain paramount, however, and dry DCTs came under harsh criticism from consumers and enthusiasts alike when introduced. Wet DCTs have not faced the same criticism, however, and even dry clutch versions are being improved to enhance drivability.
The diesel engine is an example of the complexity of the decisions customers must make when purchasing a new vehicle. The value to the consumer is arrived at differently than for a gasoline vehicle: the diesel-powered vehicle is more expensive than its gasoline equivalent, the fuel consumption is considerably lower, diesel fuel costs more than gasoline, and the residual value is higher (see Chapter 3). The market is also different, with fewer vehicle manufacturers offering fewer models from which to choose. Through November 2014, the German brands of VW, Audi, Mercedes, BMW, and Porsche combined made up 82 percent of the diesel car market in the United States, excluding pickup trucks from GM, Ford, and Chrysler. Newcomers like the Chevrolet Cruze and Chrysler Jeep Grand Cherokee provide more diversity for the consumer, and these new offerings could result in increased diesel penetration. The higher residual value of a diesel-powered vehicle and the lower net cost of fuel results in a diesel vehicle having a total cost of ownership lower than equivalent gasoline vehicles over a period of 3 years and 5 years. This fact, if realized by the purchaser, will have a positive effect on sales, but other negative considerations also prevail, such as fewer fueling stations, costs of maintenance of the aftertreatment system, and the net effect on the environment, such as perceived greater criteria emissions from diesel engines. EPA notes a projection for diesel penetration of 1.5 percent for passenger cars and light trucks in 2014 (EPA 2014), however sales of diesels in 2014 were 0.84 percent of all light- duty vehicle sales (Cobb 2015). This compares to over 50 percent penetration in Europe and even a 50 percent penetration in the light-heavy pickup trucks in the United States (Class 2b and 3).
Concerns about new technology implementation are not unique to fuel economy technologies. In today’s high-
technology world, consumers judge the utility of vehicles in ways unimaginable just a few years ago. Starting in 2006, after BMW, Audi, and Mercedes-Benz introduced new in-cabin vehicle system interface technologies, J.D. Power changed its initial quality survey (IQS) criteria to evaluate these types of systems. Vehicle owners had significant difficulties adjusting to the new, centralized functions. A manufacturer saw reliability scores for two brands plummet in new car surveys—not because of anything related to whether the engine turned on every morning, but instead related to the telematics and human–machine interface (HMI) installed in the vehicle (Bowman 2011; Consumer Reports 2012b). “It is not technology per se that generates new problems, but rather its integration and execution,” Neal Oddes, Director of Product Research and Analysis at J.D. Power, noted (Janes 2013), an observation that could be made for some of the fuel-saving technologies being launched today. The reliability ratings show that the perceived value and utility of a vehicle declines precipitously if the technology does not enhance the consumer’s ownership experience. This is true of consumer-facing fuel economy technologies as well.
Market Trends That Have Led to Greater Fuel Economy
Some consumer choices result in improved fuel economy. These include reduction in the number of cylinders as well as the transition from body-on-frame to unibody. With the considerable improvements in fuel economy and performance in internal combustion engines (ICEs), particularly when mated to a high-efficiency transmission, consumers have migrated away from V8 engines to more fuel efficient six- and four-cylinder engines. The average number of cylinders for light-duty vehicles dropped from 5.90 in MY 2004 to 5.27 in MY 2010 (EPA 2013). This is one of the other reasons fuel economy has improved 22 percent (5.5 mpg) since 2005 (EPA 2013). In addition, six- and four-cylinder engines benefited from significant investment in maximizing the fuel efficiency of these engines and mated transmissions. These improvements in fuel economy in ICE vehicles with familiar technologies provide the consumer with less incentive to invest in new technologies and new vehicles.
The shift from SUVs to CUVs is another example of a consumer choice that resulted in improved fuel economy. In the last 12 years, the U.S. new car buyer has moved away from traditional, truck-based SUVs like the Chevrolet Suburban or the Toyota 4-Runner toward more fuel-efficient, car-based CUVs such as the Nissan Rogue and BMW X5. According to IHS Automotive, in 2000, just 3 percent of all vehicles sold in the United States were CUVs and 17 percent were SUVs. By the end of 2012, the numbers had changed dramatically, with 26 percent of new vehicles designated as CUVs and 7.5 percent as SUVs according to WardsAuto.
This migration toward lighter, more fuel-efficient vehicles preceded the 2008 spike in fuel prices, although gas prices were rising at a slow but steady pace for the previous few years. The 2008 fuel price spike only spurred more demand for, development of, and introduction of CUVs. The sharp increase in CUV demand initially occurred outside of any direct policy mandates (see Figure 9.8).
CUVs are lighter and more fuel efficient than their SUV counterparts. Manufacturers began introducing CUVs into the United States in a trickle, with the Toyota RAV-4 arguably the first CUV to debut, in 1997, followed closely by the Honda CR-V and the Subaru Forester the next year. Lexus rolled out the venerable RX for premium buyers in 1998. As shown in Figure 9.8, the rise in CUV sales corresponded with a fall in market share for both minivans and SUVs, reflecting changing consumer preferences as new buyers, such as Generation Xers, entered the market. CUVs provide the consumer with many valued attributes such as commanding ride height, seating for 5-8 passengers, and all-wheel drive. These attributes come in a lighter, more fuel-efficient package than that of SUVs along with faster acceleration, easier handling, and a softer, more comfortable ride. Due to unibody versus body-on-frame construction and to the choices manufacturers have made about which vehicle traits to offer, most CUV models have reduced off-road capabilities, along with a lower tow rating and minimal low gear range. Most consumers do not need such rugged attributes but do value the cargo room, high seating position, comfort, and fuel efficiency the crossover affords. In a 2012 report from the Mintel Group, 60 percent of respondents said “off-road and snow capabilities” were “important” and 51 percent said “towing ability” was “important,” while 93 percent said “fuel efficiency” and “steering and handling” were important. Reliability, safety, and comfort all scored even higher for importance.
As consumer acceptance of CUVs spread, more manufacturers traded out truck-based vehicle architecture for car-based, including in iconic vehicles like the Ford Explorer and the long-running Nissan Pathfinder. When Ford discontinued the truck-based Explorer in MY 2010, the label fuel economy for the XLT four-door with a V6 and five-speed automatic transmission was 14 mpg city, 20 mpg highway. The car-based 2014 XLT Explorer has a new, more fuel- efficient V6 engine and a more efficient six-speed automatic transmission and is labeled at 17 mpg city and 24 mpg highway, a full 20 percent improvement in fuel economy.
The transition from SUVs to CUVs over the last decade is one reason that average certification fuel economy for new light-duty vehicles has risen from 24.8 mpg in MY 2005 to 30.3 mpg in MY 2014 (EPA 2013). During that time, fuel prices rose from just $2.39/gal in 2007 to $3.37/gal as of February 3, 2014 (EIA 2014). During this gas price rise, customers continued to purchase what they perceived to be “trucks”—CUVs, SUVs, pickups, and vans—with the market consistently split 50/50 between cars and CUVs/SUVs/pickups/vans (Experian Automotive 2014). In reality, at least from a vehicle architecture perspective, the market shifted

FIGURE 9.8 Light truck share of vehicle fleet by type of vehicle, showing the breakdown of the light-truck segment into CUVs, SUVs, minivans, pickups, and vans. CUVs rose in market share over the period.
SOURCE: Autodata (June 2013).
substantially in that time to more fuel-efficient car-based vehicles, which include CUVs. Shares of car-based vehicles (cars, minivans, and CUVs) increased from 66.4 percent in 2005 to 78.9 percent in 2012 (Baum 2014). The transition from V8 to V6 engines and from SUVs to CUVs indicates that consumers will make trade-offs of attributes they don’t value in order to gain better fuel economy.
Alternative Technology Vehicles
Manufacturers are also introducing a host of alternative technology vehicles (ATVs) that encompass an array of fuel-saving technologies, including HEVs and PEVs as well as AFVs such as biodiesel, compressed natural gas (CNG), propane, and hydrogen fuel cell vehicles. These vehicles are helping the United States to reduce its dependence on petroleum and to reduce vehicle emissions, but availability often varies by state, and there are barriers to deployment including cost, infrastructure, technological advancements, and consumer acceptance.
Hybrid and Electric Vehicles
Sales of hybrid vehicles have gained ground since their introduction. Recently, many models have been offered in a range of vehicle classes. Market share of hybrid vehicles grew steadily from 2011 to 2013, although sales were down 8.8 percent in 2014 vs. 2013 (Autodata September 2014; Cobb 2015). In MY 2013, 19 different brands offered a total of 41 different hybrid models, featuring everything from the lowest-priced Honda Insight Hatchback ($18,725), the segment-leading Toyota Prius Hatchback ($24,200), up to the priciest model, the $120,060 Lexus LS 600h L Sedan, and the biggest, the 19-foot long Chevrolet Silverado 1500 Crew Cab pickup, now discontinued (all prices from Edmunds.com 2014). Among the 41 individual models available in 2013, 11 offered all-wheel-drive and 6 showed four-wheel-drive, including two pickup trucks from GM. The 2014 Toyota Prius offered the best label fuel economy at 51 mpg city, 48 mpg highway, while the pricey 2014 Lexus LS 600h offered the worst at just 19 mpg city, 23 mpg highway, a point below GM’s five full-size truck offerings, which get 20 mpg city, 23 mpg highway.
Despite all of these models displaying an array of utility, price, fuel economy, and brands, hybrid sales accounted for just 3.4 percent of new vehicles sales in 2013, up a fraction from 3.3 percent in 2012, according to Autodata (December 2013). In 2014, hybrids represented only 2.75 percent of new light-duty vehicle sales, probably as a result of falling gasoline prices (Cobb 2015). The Toyota Prius lineup is the most
popular hybrid vehicle model series, recording a 42 percent hybrid market share in 2014, down from a 45 percent market share in 2013 and 49 percent in 2012.
Consumer surveys show that there has been no upward trend in interest in purchasing an HEV or PEV in recent years (Strategic Vision, Annual surveys), although there is very wide regional variation in hybrid sales. In California, for example, the market share for conventional hybrids in 2013 was 6.8 percent of all light-duty sales. The Toyota Prius was the single best-selling model of all passenger cars, including both ICEs and ATVs, in California in 2013 (California New Dealer Association 2014). According to Experian Automotive, California accounted for 25.3 percent of all hybrids and PEVs sold in the United States in 2013. Florida, with 6.2 percent share of hybrid and PEV sales, was a very distant second (see Figure 9.9). This variation can often be attributed to the demographics and values of the consumers in each state but also localized incentive programs such as rebates, tax credits, access to HOV lanes, and availability of supporting infrastructure.
The modest size of the hybrid market does not necessarily reflect a lack of consumer demand for fuel efficiency overall but may be more a reflection of consumer perception of the lack of value for the hybrid drivetrain in particular. Furthermore, due to higher, size-based fuel economy standards in recent years, there is increasing availability of more fuel-efficient vehicles in every market segment, including pickup trucks. According to Automotive News, “improvements in the fuel economy of many mid-sized cars mean consumers now can save money without drastically reducing the size of their vehicles.” (Bunkley 2013)
Other Alternative Fuel Vehicles
As mentioned above, other vehicles using alternative fuels such as biodiesel, CNG, propane, and hydrogen are in the market, each with its own set of challenges and opportunities. Unlike hybrid vehicles, which run on gasoline, alternative fuel vehicle challenges include establishing a fueling infrastructure. Hydrogen fuel cell vehicles in particular have the potential to be two to three times more efficient than an ICE and offer the opportunity to dramatically decrease petroleum consumption and GHG emissions, though they will require an entirely new fueling infrastructure. Currently, the infrastructure is very limited, with just 10 stations in the United States at the end of 2013 (see Chapter 4). Hyundai just released its Tucson fuel cell vehicle for lease in Southern California, where nearly all of the hydrogen fueling stations
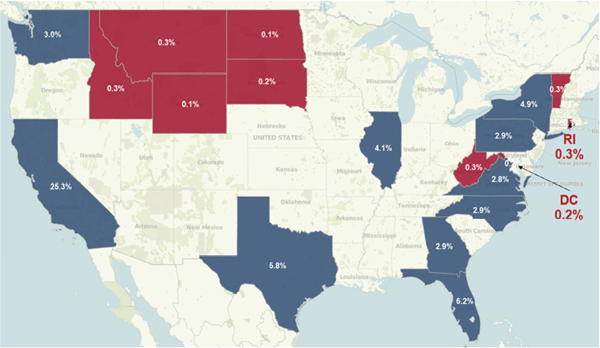
FIGURE 9.9 Uptake of hybrid and electric drivetrains is highly regional. States with the highest percent registrations of HEVs and PEVs are shown in blue, while those with the lowest percent registrations are shown in red.
SOURCE: Experian Automotive as of December 31, 2013 (U.S. light-duty vehicles only).
are currently located. The midsize crossover has a driving range up to 265 miles and takes just 10 minutes to refuel.
Natural gas vehicles come in two varieties: CNG and liquefied natural gas (LNG). Both fuels are commercially available, relatively low in price, and burn with lower emissions of criteria pollutants than gasoline or diesel, though all must meet the same tailpipe emissions standards. Vehicles equipped with CNG get about the same fuel efficiency as gasoline-powered vehicles. LNG, currently used mostly by medium- and heavy-duty trucks, has volumetric energy density about 65 percent that of gasoline, requiring about 1.5 gallons of LNG to provide the same energy as a gallon of gasoline. There are currently 737 CNG stations in various parts of the United States but only 58 LNG stations. The only car that can currently fuel with natural gas is the 2014 Honda Civic Natural Gas, but the all-new 2015 Chevrolet Impala can run on either gasoline or natural gas, using bi-fuel technology.
Propane (liquefied petroleum gas) powered vehicles have been around for decades, resulting in widespread infrastructure, with 2,714 refueling stations, mostly for medium- and heavy-duty vehicles. Similar to the natural gas vehicles, there are two different kinds of propane vehicles: dedicated, using only propane, and bi-fuel, with two systems for the two fuels. However, also similar to natural gas, there is limited product availability for light-duty vehicles. Currently there are no propane light-duty vehicles available on showroom lots. Instead, the consumer can order a truck or van from a dealership with a “prep-ready engine package” and convert the vehicle to propane use. Existing conventional vehicles can be converted to propane as well by certified installers, but the procediure can cost anywhere from $4,000 to $12,000 (DOE n.d.).
All AFV technologies address the issues of petroleum demand, emissions, and security of petroleum, but they all require significant infrastructure investment in order to become mainstream. Some automakers expressed concern that consumer familiarity with alternative fuel vehicles was a major market barrier to sales of these vehicles. Consumers are not accustomed to fueling at home or at the workplace with electricity, for example. Knowledge of and infrastructure for these vehicles may be localized due to the nature of new technology market diffusion, as discussed previously and reported in a recent NRC report (NRC 2015). These are not new challenges—these fuels were all mentioned as “alternative fuels” in the 1992 Energy Policy Act—but migrating away from the gasoline ICE continues to be a challenge in most parts of the United States. The regulatory treatment of AFVs is discussed in Chapter 10.
A challenge of increasing CAFE/GHG national program standards in 2020-2030 lies in how much improvement in fuel economy can be wrung from ICE and, beyond that, in overcoming consumers’ perceived risk of new, consumer-facing technologies. Consumers are not risk-oriented when making a large purchase such as a car (Indiana University 2011, 5). If the fuel economy standards require widespread application of new technologies, will consumers be willing to pay more for these vehicles, or will they keep their existing vehicles longer and delay the greening of the fleet?
Survey Results on Fuel Economy and Other Attributes
The extent to which consumers value fuel economy will affect their willingness to purchase more fuel-efficient vehicles, especially if they perceive trade-offs with other attributes they value. When making a purchase decision, consumers may consider vehicles based on class, brand, features, or other specific considerations. Within the subset of vehicles that meet their basic needs, consumers consider a variety of broader vehicle attributes, including fuel economy but also reliability, durability, quality of workmanship, and value for money. Some attributes may be competing (such as horsepower and fuel economy), while others may be complementary (such as durability and reliability). Individual consumers value attributes differently, as shown by the wide variety of classes, makes, and models of vehicles available on the market. There is a vast amount of consumer survey data available for analysis on U.S. consumer attitudes toward fuel economy. These data indicate that many consumers value fuel economy, though it is not their only consideration.
The most reliable information about consumer preferences comes from surveys of drivers who have made a recent new car purchase. One such survey, conducted by Strategic Vision in 2013 of over 300,000 new vehicle buyers, found that while consumers value fuel economy, most do not consider it the most important attribute. In this survey, after a consumer bought or leased a new vehicle, he/she rated the importance of 49 possible reasons. In response to the question “Why did you decide to buy the particular model you did rather than some other model? How important was each of the following in your decision?” 45 percent of consumers said fuel economy was “extremely important” when selecting the vehicle they purchased or leased. The most highly rated attribute was reliability, which 68 percent of respondents said was “extremely important” for their purchase decision. Consumers could rate multiple characteristics as “extremely important,” showing that they value a variety of attributes and must balance sometimes competing priorities (see Table 9.4).
Instead of rating all attributes, consumers are also often asked to select the most important attribute in purchasing a vehicle. In the Strategic Vision survey, fuel economy ranked fourth, with 8.27 percent of consumers choosing it as the most important. Value for money, reliability, and previous experience with brand were the top three reasons ranked “most important” by consumers in that survey.
Another approach to surveys asks the general public what they view as important attributes in considering a vehicle purchase. These surveys can provide information about trends in public attitudes over time. They show that consumers have a
| Rank (of 54) | Reason for Purchase | % |
| 1 | Reliability | 70 |
| 2 | Durability | 60 |
| 3 | Value for money | 59 |
| 4 | Quality of workmanship | 59 |
| 5 | Manufacturer’s reputation | 54 |
| 6 | Safety design features in case of accident | 53 |
| 7 | Ease of handling/maneuverability | 52 |
| 8 | Warranty/guarantee | 52 |
| 9 | Seating comfort | 49 |
| 10 | Engine performance | 49 |
| 11 | Fuel economy | 45 |
Survey data from Strategic Vision, October 2012-June 2013.
strong interest in fuel economy when considering a purchase, although stated interests may differ from actual purchase decisions (NADA 2014; Consumer Reports 2013; Morpace Inc. 2013). These surveys show mixed evidence about how important fuel economy is relative to other vehicle attributes for consumers intent on purchasing a vehicle. The National Automobile Dealers Association (NADA) 2013 survey asked respondents to identify the most important factor in determining which new vehicle to purchase. “Quality and dependability” was the selected factor by the most respondents (23%), with fuel economy chosen as most important by 14 percent of respondents, the second largest group. For truck buyers, 25 percent said “quality and dependability” was the most important factor, with nearly 11 percent citing brand and 9.6 percent indicating fuel economy as the most important consideration. In the 2014 New Car Buyer Survey from NADA, shown in Table 9.5, the survey question was changed to ask consumers to rank in order 10 vehicle attributes, rather than to provide the most important factor. While fuel economy was only the fourth highest rated attribute when all attributes could be rated as most important, when forced to choose the most important attribute, fuel economy was chosen as most important factor by the most respondents (NADA 2014). While fuel economy ranked first and cost of ownership second, environmental impact was ranked in seventh place, a sign that consumer interest in fuel economy might be related mostly to financial motivation.
There is much diversity in the attributes consumers value, and those values may impact their choice of desired vehicle type. In their purchase decision, consumers may select a vehicle class based on their top priorities, and then search within that class for other attributes they value. For example, consumers who value fuel economy or handling highly may search for compact vehicles, while consumers who value towing and hauling may search for SUVs or trucks. The Fuels Institute notes that shoppers interested in different vehicle classes have different priorities:
Consumers shopping primarily for a specific class of vehicle showed a diversity of preferred vehicle attributes. Those considering smaller vehicles (coupes and sedans) were more likely to cite performance or technological attributes as influential, while those considering larger vehicles (minivans, SUVs and crossovers) found cost, capacity and safety to be more important. (Fuels Institute 2014)
In addition to variation between consumers in their valuation of vehicle attributes, there is also variation in how they value vehicle attributes at different times during the purchase
TABLE 9.5 NADA New Car and SUV/Truck Preference Surveys, August 2014
| Ranking of Factors Considered during New Car Purchase | Ranking of Factors Considered during New SUV/Truck Purchase | ||||||||||||||||||
| Factor | Average Rank | Ranka | Factor | Average Rank | Ranka | ||||||||||||||
| Fuel Economy | 3.0 | 1 | Fuel Economy | 3.4 | 1 | ||||||||||||||
| Cost of Ownership | 3.8 | 2 | Cost of Ownership | 3.6 | 2 | ||||||||||||||
| Power and Performance | 4.2 | 3 | Power and Performance | 4.2 | 3 | ||||||||||||||
| Advanced Safety Systems | 4.8 | 4 | Versatility and Utility | 4.9 | 4 | ||||||||||||||
| Versatility and Utility | 5.2 | 5 | Advanced Safety Systems | 5.0 | 5 | ||||||||||||||
| Build Quality and Reliability | 5.8 | 6 | Build Quality and Reliability | 5.5 | 6 | ||||||||||||||
| Vehicle Design | 6.1 | 7 | Vehicle Design | 6.1 | 7 | ||||||||||||||
| Environmental Impact | 6.6 | 8 | Environmental Impact | 6.8 | 8 | ||||||||||||||
| Brand | 7.4 | 9 | Brand | 7.3 | 9 | ||||||||||||||
| Technology | 8.2 | 10 | Technology | 8.3 | 10 | ||||||||||||||
a 1 – Most Important, 10 – Least Important.
decision process: “Early on, it is about brands that excite and have stronger foundational security. Closer to purchase it is about product (mpg is a part) and price” (Alexander Edwards, Strategic Vision, pers. comm.).
At first there appears to be a contradiction between, on the one hand, many consumers saying they highly value fuel economy and, on the other, market trends that indicate large numbers of consumers continue to purchase less fuel efficient vehicles, such as trucks and SUVs. This apparent discrepancy shows that while consumers value fuel economy, they do so in the context of other attributes they also value. Consumers, therefore, may choose the most fuel- efficient vehicle that meets their needs and is in their price range, rather than the most fuel- efficient vehicle on the market. A recent survey by the Fuels Institute also highlighted this seeming contradiction between stated and revealed preference: While 84 percent of consumers say they are financially driven by fuel economy, they continue to buy larger, less fuel-efficient vehicles, indicating that they look for the most fuel-efficient version of a vehicle they already want to purchase. “An SUV customer might compare cost and fuel economy between several available SUVs, but might not be willing to consider shifting to a smaller vehicle that delivers superior economic value” (Fuels Institute 2014).
Consumers are buying fuel-efficient versions of vehicles that suit their wants and needs. This incentivizes manufacturers to provide best-in-class fuel economy—but not at the expense of other core attributes—and reinforces the decision of regulators to require different classes of vehicles to meet different standards via the different passenger car and light truck footprint standards. This accounts for why the market is seeing the success of crossovers with smaller displacement engines, for instance, but not a significant movement away from crossovers as a segment overall. It may also explain the reluctance of mainstream consumers to adopt alternative technology vehicles that may be perceived to sacrifice reliability and durability for improved fuel economy.
There is a great deal of variation in consumers’ attitudes toward different types of vehicles, vehicles attributes, and fuel economy. More study to understand consumer valuation of fuel economy and indeed consumer motivation for vehicle purchases overall is critical to resolving some of these discrepancies and further understanding the buying process and its implications for the costs and benefits of the fuel economy standards.
COSTS AND BENEFITS OF THE NEW RULES TO INDIVIDUAL CONSUMERS
The Agencies assess the costs and benefits of the fuel economy rules for individual consumers and for society as a whole. The structure of the regulations and the societal impacts are discussed in Chapter 10. Consumer response to the new CAFE/GHG standards has important impacts on the costs and benefits of the rule, as well as on sales of vehicles and employment in the automotive industry. The Agencies have attempted to assess how consumers will respond to the new CAFE/GHG standards by looking at the private costs and benefits to the average consumer. They examine the costs and benefits to the consumer of owning the vehicle over the first 5 years, which is a common way of measuring cost of vehicle ownership. This approach to measuring the costs of ownership may not be the best way to understand the impact of the standards on vehicle sales. A cost of ownership is the cost once the vehicle has been purchased. More relevant for vehicle sales is the cost from the consumer’s perspective before purchase, including undervaluation of fuel economy. The Agencies examine this undervaluation of fuel economy in some of their sensitivity analyses, but these analyses do not factor into the costs and benefits of the Final Rule (NHTSA 2012). The implications of the up-front perceptions of the value of fuel savings need to be included in an analysis of private consumer costs and benefits for consistency in the costs and benefits. For example, if consumers on average do not perceive much value from fuel economy, they are also unlikely to account for any residual value from a higher fuel economy vehicle. If the explanation for consumer undervaluation of fuel economy is instead that consumers are loss-averse, then the analysis should instead be based on whether consumers perceive the purchase of a more fuel efficient vehicle as a risky bet when the context of the choice is that all vehicles have been made more fuel efficient.
Agency Analysis of the Standards’ Impact on Consumers Costs
The benefits to individual consumers are primarily the fuel savings they will get from driving more fuel-efficient vehicles (see Figure 10.8). As noted above and acknowledged by the Agencies, there is great variation in the value of fuel savings across individuals in the population depending on, for example, how much they drive, how much uncertainty they perceive in the fuel savings they will get, and how attentive they are to estimating the savings.
The costs to consumers are made up of the higher vehicle price due to the added components to raise fuel economy (discussed extensively in Chapters 2-6) and a range of other changes in cost, including higher sales taxes, insurance costs, financing costs, and maintenance and repair. In calculating costs and benefits, the Agencies assume no opportunity cost to the loss of attributes forgone to provide fuel economy (EPA/NHTSA 2012a, 62714). Each of these costs and the Agencies’ approaches to estimating them are reviewed below. The committee’s approach is necessarily qualitative, as to perform a quantitative assessment would have required significant committee resources. The committee also notes that the Agencies have undertaken such assessments in their regulatory analysis (EPA/NHTSA 2012b; EPA 2012; NHTSA 2012).
Fuel Costs
The Agencies, for their central estimates of consumers’ buying responses, assume that consumers will consider 5 years of fuel savings. They based this estimate on the approximate average term of consumers’ loans to finance the purchase of new vehicles (EPA/NHTSA 2012a, 62991). The savings in fuel expenditures will depend on fuel prices as well as on the type of fuel. One important uncertainty for consumers is the price of gasoline. To reflect the uncertainty of gasoline prices in the future, the Agencies’ analysis is based on estimates from the Energy Information Agency (EIA) Annual Energy Outlook (AEO) 2012 of $3.87/gallon, and the range of high and low prices is drawn from the AEO 2012 high and low price of oil scenarios (EPA/NHTSA 2012a, 62617). In the most recent EIA AEO (2015), estimates of high gasoline prices are at about $3.65 per gallon in 2015 dollars, rising to $5.05 per gallon in 2030 in 2013 dollars. The low price forecast ranges from $2.21 per gallon in 2015 to $2.45/gallon in 2030, while the midrange rises through the period from $2.31 to about $3.20 per gallon in 2030. Historically there has been much variability in the EIA’s AEO forecasts, however, so these numbers are likely to change with each yearly AEO update. The Agencies also rely on EIA estimates for diesel and electricity prices. Recently, gasoline prices have hit new lows, reaching $2.04 per gallon on average for the week of January 26, 2015. In the first three weeks of March 2015, the price per gallon was higher, staying above $2.40 (EIA 2015). Updated gas price forecasts for 2022-2025 should inform the midterm review.
Sales Tax
To estimate the average cost increase due to sales tax, the Agencies took the most recent auto sales tax data by state and weighted it by state population to estimate a national weighted-average sales tax of 5.46 percent. The Agencies chose to weight by using U.S. Census data on population because new vehicle sales by state were not available. To approximate new vehicle sales by state, NHTSA analyzed the change in new vehicle registrations (using R.L. Polk data) by state across recent years and found that the national weighted-average sales tax rate was almost identical to that resulting from the use of Census population estimates as weights.
Insurance Costs
The Agencies estimated the increase in collision and comprehensive (e.g., theft) car insurance over the base 5-year period since these are the portions of insurance costs that change with vehicle value. Using data from a Quality Planning study on average collision plus comprehensive insurance costs for new vehicles in 2010 dollars and data from the Bureau of Economic Analysis on average new vehicle prices, the Agencies estimated that insurance costs were, on average, 1.86 percent of the new vehicle prices. Using data from the Quality Planning study, the Agencies estimated collision plus comprehensive insurance costs due to the decrease in vehicle value when the vehicle is 5 years old to be 1.50 percent. At a 3 percent discount rate, present value of the stream of insurance costs over 5 years would be equal to 8.0 percent of the vehicle’s price.
Financing Costs
The Agencies also estimated increases in costs due to the interest paid if the purchaser takes out a loan. The Agencies assumed that 70 percent of new vehicle purchases are financed based on a news article citing CNW Marketing Research (Bird 2011).
Using proprietary forecasts from IHS Automotive, the Agencies developed an average of 48-month bank and auto finance company loan rate of 5.16 percent for years 2017 through 2025 when deflated by IHS Automotive’s corresponding forecasts of the consumer price index (CPI). The average person taking a loan will pay 5.43 percent more (at a 3 percent discount rate) for their vehicle over the 5 years than a consumer paying cash for the vehicle at the time of purchase. However, there will be a great deal of variation in the financing costs to different individuals. Subprime lending rates even on new cars start at about 19 percent, while those with the best credit scores will pay a good deal less than 5.16 percent.
Residual Value
To estimate residual value (or resale value) of the vehicle after 5 years, the Agencies apply the same average resale value rate for today’s vehicle, 35 percent, to the increase in incremental costs that are a result of fuel-economy-improving technologies. Discounting the residual value back 5 years using a 3 percent discount rate (= 35% × 0.8755) yields an effective residual value of 30.6 percent. There is some evidence from the used car market that higher-fuel-efficiency vehicles such as hybrid and diesel vehicles can retain higher value than comparable conventional vehicles. Gilmore and Lave (2011), using auction data from Manheim Auctions, showed that after 3 years of ownership, the Toyota Prius and the Volkswagen Jetta TDI diesel vehicle retained a greater percentage of their initial purchase price than the conventional gasoline vehicles.
Maintenance and Repair Costs
The Technical Support Document (TSD) provides the most thorough discussion of maintenance and repair costs of the standards (EPA/NHTSA 2012b, 3-260). The Agencies evaluated existing data for 20 different technologies to determine if there were costs that could reasonably be attributed
to the new standards. The Agencies concluded that 9 of the technologies identified could lead to a change in maintenance costs. The Agencies could not identify any other technologies that would have significantly different maintenance costs. (For further detail, see EPA/NHTSA 2012b, 3-261 to 3-264.)
The only non-EV technologies identified are two levels of low rolling resistance tires and diesel fuel filters. Tires, regardless of technology type, must be replaced multiple times over the life of the vehicle. The higher maintenance costs associated with low rolling resistance is due to the higher replacement cost. Diesel fuel filters are estimated to need replacing every 20,000 miles. Gasoline vehicles appear not to need fuel filter changes attributed to the rule.
Six of the 20 technologies with different maintenance costs due to the rule are associated with electric vehicles and four of those technologies decrease maintenance costs. The four that decrease maintenance—oil change, air filter replacement, engine coolant, and spark plug replacement—are intuitively obvious since EVs do not have an ICE. The two maintenance costs that increase are battery pack-related—battery coolant replacement and battery health check. Additionally, PEV batteries have a limited warranty of 5 or 8 years. Battery life is not known for this first generation of PEVs, but if the battery needs to be replaced in the 15 year life of a vehicle its cost would overwhelm any maintenance savings. Today’s price for a Nissan Leaf battery replacement is $5,500 while a Volt battery replacement costs $2,300 (Blanco 2014; Voelcker 2014). The Nissan Leaf battery replacement price is less than the cost and Nissan admits to selling the replacement at a loss (Voelcker 2014). Battery cost estimates as evaluated by the committee are presented in Chapter 4. Battery replacement cost, should replacement need to occur, will be a large expense and will be larger than the maintenance cost of an ICE vehicle, and much larger than any of these additional ownership costs considered by the Agencies.
For repair costs, the Agencies account for costs of repairs covered by manufacturers’ warranties (EPA/NHTSA 2011, 74925-74927) through the indirect cost multiplier methodology, which has a manufacturer warranty component. For repairs out of warranty, the Agencies choose not to compute an estimate due to insufficient data on frequency of different types of repairs and the immaturity of the new technologies just entering the fleet. The Agencies did not discuss possible changes in maintenance or repair costs for aluminum body vehicles, which may be higher than for steel vehicles, as noted in Chapter 6.
Agencies’ Analysis of the Standards’ Impact on Affordability, Sales, and Employment
As part of estimating the cost and benefit of the rule to the nation, the Agencies estimated the impact of the fuel economy standards on customer purchase decisions, vehicle sales, vehicle affordability, and employment in the automotive industry.
Private Cost of Vehicle Ownership
To evaluate sales and employment impacts, the Agencies evaluate consumer purchase decisions by estimating the private costs of ownership that consumers might include when making purchase decisions. The Agencies considered four factors discussed above: sales tax, insurance costs, financing costs, and residual values over the first 5 years of the vehicle’s life (see Table 9.6). In addition, the Agencies did some sensitivity analyses, including varying assumptions of how consumers and manufacturers value years of fuel saved (NHTSA 2012, 830).
Overall, NHTSA finds that the residual value outweighs the increase in cost of ownership due to higher sales tax, insurance, and financing costs (NHTSA 2012, 832). At a 3 percent discount rate, the Agency finds that consumer valuation of the incremental purchase cost (before fuel savings are considered) is reduced by 12 percent. For the average MY 2025 incremental purchase cost of $1,836, this is equivalent to a reduction of $221 on the net consumer valuation (before fuel savings) of $1,615. This decrease in net consumer valua-
TABLE 9.6 Private Cost of Ownership at Purchase Decision Born By the Individual Consumer
| Cost as a percent of purchase price | Cost | |
| Incremental Purchase Cost MY2025 | $1,836 | |
| Discount rate | 3.0% | |
| Increase due to higher sales tax | +5.5% | +$101 |
| Increase due to higher insurance costs | +8.0% | +$147 |
| Increase due to higher financing costs | +5.10% | +$94 |
| Residual value recovered at resale | −30.64% | −$563 |
| Change in value | −12.04% | −$221 |
| Net consumer valuation (without fuel savings) | $1,615 | |
NOTE: In addition to the 3 percent discount rate case presented above, the agencies also examine a 7 percent discount rate case.
tion is used in estimating the impact on sales. The cumulative impact of these additional cost considerations is to improve consumer payback, and increase sales and employment, compared to a case where these additional cost factors are not considered. The residual value does assume fuel savings after the initial 5-year period. The impact on sales should consider how consumers value fuel economy at purchase as well as any residual value recovered at resale for improved fuel efficiency.
Vehicle Demand
In addition to the impact of fuel economy regulations on individual consumer choices, the Agencies’ analysis of the effects of the CAFE/GHG national program recognizes the importance of the underlying demand for vehicles. Consumer demand for vehicles may be changing in the coming years for a number of reasons. There may be a growing number of households who choose not to own a car. The number of households without a car (Madigan 2014) has increased nearly every year since 2005, when it was 8.87 percent and up to 9.22 percent in 2012, according to the University of Michigan (Sivak 2014; DeGroat 2014) and the U.S. Census Bureau. But most relevant is that this percent without a vehicle varies widely by geographical area, similar to alternative vehicle sales but in entirely different ways. Many more East Coast households are carless than in California, for example. New York City (56.5%), Washington D.C. (37.9%), Boston (36.9%), and Philadelphia (32.6%) are the top four cities for carless households, with San Francisco (31.4%) in fifth place and the only West Coast city until Seattle, in tenth place, with 16.6 percent of households. Increasing rates of urban density as well as access to public transportation could lead to decreasing rates of overall vehicle ownership over time.
Another evolving factor influencing car buying is household formation. In 2000, 68.1 percent of households were defined as “family,” either married couples with children, married couples without children, single parents with children, or other family (U.S. Census Bureau 2000). In 2010, that figure dropped to 66.4 percent because single-person households climbed from 25.8 percent to 26.7 percent (U.S. Census Bureau 2012). In addition, new reports from Pew Research Center reports 42 million adults 25 and older have never been married, about 20 percent of the population. The Bureau of Labor Statistics recently reported that 50.2 percent of Americans over 16 are single, up from 37.4 percent in 1976 and the first time more adults are single than married (Madigan 2014; Miller 2014). If urbanization continues to rise, consumers may migrate away from full ownership of larger, less-fuel efficient vehicles and into smaller vehicles, they may use vehicles through car share, or they may potentially abandon vehicles altogether. At the same time, as single-person households and urbanization and density increase, EV sales could be hurt by more complicated access to charging at home as consumers move into apartments and multi-family dwellings and away from single-family homes with garages. These issues are just another example of the fluidity, complexity, and diversity of forecasting consumer demand and fuel economy.
Urbanization and household formation are also influencing the growth of alternative transportation methods such as car sharing programs, for example Car2Go and Zipcar, and on-demand transport services such as Uber and Lyft. These programs could influence vehicle ownership as well. What is clear is that there is a great deal of variation across consumers in attitude toward different types of vehicles, vehicle attributes, and fuel economy. Certainly, more study needs to be conducted on the changing demographics in the marketplace and its influence on vehicle demand.
Sales
If consumers consider higher fuel economy vehicles to be too expensive, they will purchase fewer new vehicles and retain used vehicles for a longer period, slowing down the rate of stock turnover and thereby the rate of improvement in the fuel economy of the on-road vehicle stock. On the other hand, if new, higher fuel economy vehicles are seen to be more desirable, used vehicle prices will decline relative to new vehicles, and scrappage rates will increase, as will the rate of improvement in the fuel economy of the on-road vehicle stock.
The effect of the standards on vehicle sales will depend on (1) the actual cost increase, (2) the actual fuel savings achieved, (3) how consumers perceive the value of future fuel savings at the time of purchase, including loss aversion, and (4) the price elasticity of demand for new vehicles.5 There is reasonable evidence that the price elasticity of new vehicle demand in the United States is approximately −0.8 to −1.0 (e.g., Goldberg 1998; McCarthy 1996; Bordley 1993; Levinsohn 1988). If the price elasticity of vehicle demand is −1, then an increase in price of 1 percent causes a decrease in sales of 1 percent. If consumers assigned no value ($0) to the increased fuel economy brought about by the regulations, the regulations would unambiguously reduce vehicle sales. The Final Rule estimates that the average price of a new vehicle will increase by approximately $1,800. Prepurchaseperceived fuel savings are assumed to be about 1-4 years by the auto companies and by a number of other studies, or about $500 to $2,000, in contrast to full fuel savings over the life of a vehicle of more than $5,000, discounted to present value. If consumers valued the full fuel savings estimated by the Agencies of 5,000 present value dollars, the effect of the rule on sales would be the same as a price decrease of $3,200, and new vehicle sales would increase. If costs are higher than estimated and if the perceived fuel savings are low, as
_____________
5 The price elasticity of demand is a unitless quantity that economists use to measure the sensitivity of demand to changes in price. It is the percent change in quantity demanded that would result from a 1 percent change in price, all else being equal.
most auto companies argue they are, the result would be an overall price increase, which would decrease vehicle sales.
If consumers undervalue fuel economy due to loss aversion, then the impact on sales will depend on the context in which consumers make their purchase. If all vehicles have higher fuel economy and higher cost due to the standards, then they will not face a risky bet and loss aversion will not come into play. If, on the other hand, they do perceive the purchase as risky, such as if they look to the used car market for a cheaper, less fuel efficient vehicle, then loss aversion will still apply. Also, views on fuel economy could change over time if there is learning about the advantages of more fuel-efficient vehicles, resulting in consumers’ greater valuation of fuel economy over time. In general, new car sales impacts due to the standards will depend critically on how buyers perceive the value of the fuel savings and alternative attributes available in the vehicle market.
In addition to the effects on overall new vehicle sales, the costs and benefits of the rule may impact the mix of vehicles sold. If the costs of the rule are relatively high and the benefits relatively low, then price-sensitive consumers may opt to shift to less expensive new vehicles, such as smaller vehicles from larger vehicles. They may also purchase used vehicles. Currently the fleet mix is not being tracked. The Agencies monitor the mix of vehicles in the fleet and should track the effect of the rule on the sales mix.
The Agencies acknowledge that it is not clear which way sales will go:
Since consumers are different and use different reasoning in purchasing vehicles, and we do not yet have an account of the distribution of their preferences or how that may change over time as a result of this rulemaking, the answer is quite ambiguous. Some may be induced by better fuel economy to purchase vehicles more often to keep up with technology, some may purchase no new vehicles because of the increase in vehicle price, and some may purchase fewer vehicles and hold onto their vehicles longer. There is great uncertainty about how consumers value fuel economy, and for this reason, the impact of this fuel economy proposal on sales is uncertain. (NHTSA 2012, 838)
As discussed in the section Trends in Vehicle Characteristics, evidence from the most recent era of higher fuel prices (2005 to present) suggests that there is no inherent conflict between higher fuel economy and increased vehicles sales. Since 2009, when the market hit a recent low of 10.4 million units, fuel economy and total vehicles sales have been steadily increasing, driven by a combination of a recovering economy, sustained high fuel prices, and more attractive vehicle offerings, including the availability of more fuel-efficient vehicle models in every market segment. The availability of new vehicle models, especially in a period of high fuel prices, can enhance vehicle sales by providing a compelling reason for consumers to upgrade their existing vehicle (Isidore 2012). Recently, fuel prices have dropped somewhat, ranging in 2014 from $3.60/gal to $2.25/gal. Low fuel prices may have uncertain effects on sales and the types of vehicles consumers want to purchase in combination with the new regulations. These effects will need to be examined if fuel prices remain low.
Affordability
If the cost and fuel savings estimates of the Final Rule are approximately correct, the standards appear to make vehicles more affordable for both new and used car buyers. This is primarily due to the fuel savings they will realize over the lifetime of the vehicle as compared to the increase in the initial purchase price of the vehicle. The committee’s views on the standards’ costs and benefits are presented for individual technologies in Chapters 2-6 and for the rule as a whole in Chapter 10. To the extent there are net benefits to consumers, they are likely to be greater for low-income households, which predominantly own used cars. In the United States, only the highest income quintile spends more each year on new vehicles than used vehicles (BLS 2011, Table 1). While the market values of vehicles depreciate at approximately 10 percent per year,6 vehicle use decreases by only about 3-4 percent and fuel economy remains nearly constant over a vehicle’s lifetime (see Lin and Greene 2011). As a consequence, expenditures on vehicles decrease more rapidly with vehicle age and therefore with the owner’s income than expenditures on fuel (Figure 9.10). U.S. households in the lowest two income quintiles spent almost 50 percent more on fuel than on vehicles in 2011. Households in the highest income quintile spent about 25 percent less on fuel than on vehicles. The Final Rule assumes the standards will increase vehicle prices by about 6 percent but reduce fuel consumption by one-third relative to the 2016 standards. If these estimates are correct and the price of fuel is close to that assumed in the rule’s analysis, all income groups would benefit.7 Across all income groups, U.S. households spent nearly equal amounts on fuel ($2,655) and on new and used vehicles ($2,669). These are income group averages. Households that do not own vehicles would be affected only indirectly by the changes in vehicle prices and fuel economy.
Despite the fact that a cost of ownership calculation indicates that consumers will benefit from the new, higher fuel economy vehicles, if consumers are myopic when it comes to fuel savings in purchasing new or used cars, many more fuel-efficient cars may be perceived as more expensive. A new fuel-efficient car that costs even 6 percent more may appear to be less affordable than an alternative used car or than no vehicle purchase at all, if the fuel saving are only valued at
_____________
6Edmunds.com, Inc. (2010), for example, estimates that the market value of a 5-year-old new car will be about 40 percent of its purchase price, with higher depreciation over the first two years of 18 and 31 percent total depreciation after year 1 and year 2.
7 This assumes that an average light-duty vehicle costs about $30,000, as reported by the Federal Trade Commission (2014).
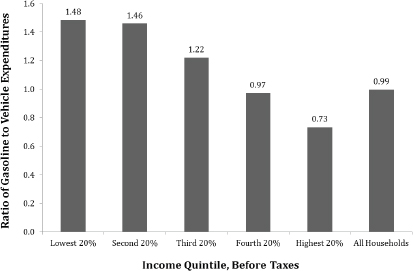
FIGURE 9.10 Ratio of household expenditures on gasoline + motor oil to expenditures on vehicles by income quintile.
SOURCE: BLS, CES (2011), Table 1.
2 or 3 years. This may be particularly true if entry-level car buyers shop between the used and new vehicle markets. As a result, people may hold onto current cars longer or may shift from the new to the used car market. This can affect the mix of new and used cars and affect the estimated GHG emissions and overall fuel savings. Used car prices may increase in this scenario and fuel economy improvements in the used car fleet may be slowed, which will affect the cost and benefits of the rule to consumers as well as to society.
Another aspect of vehicle affordability is the ability of the customer to finance his/her purchase. Though few low-income consumers purchase new vehicles, to the extent that some do, financing and liquidity constraints may be important. When making a purchase, some new car buyers may not be able to take account of long-term fuel savings because they cannot get lending terms that reflect those fuel savings. As a general rule, it appears that lenders do not consider fuel costs when qualifying applicants for auto loans, although there are some exceptions as noted in the Final Rule (EPA/NHTSA 2012a, 62950). The failure to take into account fuel savings could lead to some potential car buyers on the margin being denied loans even though the annual fuel savings could offset the higher loan payment. More investigation is needed to understand lender behavior and how the problem can be addressed.
Finding 9.1 There have been continual improvements in vehicle technology over time, enabling improvements in many vehicle attributes at relatively low cost. Much of the technology change during the period from 1985 to 2005 went to improve attributes such as horsepower and acceleration, and not to fuel economy. Since 2004, both average fuel economy and performance have trended upward. Rising gasoline prices are likely to have contributed to higher fuel economy during this latter period.
Finding 9.2 Fuel economy and GHG regulations themselves are likely to create additional incentives for innovation to reduce cost and enhance effectiveness of fuel savings approaches, beyond what would have occurred in their absence, in both known and unanticipated new technologies.
Finding 9.3 The energy paradox implies that consumers do not fully account for the expected present discounted value of fuel-saving technologies when they purchase new vehicles. Manufacturers perceive that consumers require relatively short payback periods of 1 to 4 years for fuel economy improvements. A large amount of literature in the economics and policy community attempts to understand and measure the extent and magnitude of consumer undervaluation of fuel economy, but the empirical evidence is still mixed. The results of recent studies find that consumers’ responses vary from requiring payback in only 2 to 3 years to almost full lifetime valuation of fuel savings. The energy paradox is an important argument for fuel economy regulations and has a bearing on the private costs and benefits of the standards.
Finding 9.4 There are a range of theories and explanations for why consumers may or may not fully value lifetime fuel savings, all of which may have some validity as responses across the population are likely quite diverse. Some consumers may be loss-averse or risk-averse, not wanting to take on what may be perceived as a risky investment in fuel economy, while others may lack understanding of the amount and value of the future stream of fuel savings, especially as technologies are bundled into vehicle packages. Some of the apparent
undervaluation may simply reflect the fact that consumers have higher value for other vehicle attributes than for fuel economy. It is important to resolve these issues because they will affect the costs and benefits of the rule.
Recommendation 9.1 The Agencies should do more research on the existence and extent of the energy paradox in fuel economy, the reasons for consumers’ undervaluation of fuel economy relative to its discounted expected present value, and differences in consumers’ perceptions across the population.
Finding 9.5 In the absence of increasingly stringent fuel economy standards, vehicle manufacturers may be risk-averse to long-term investments in fuel economy technologies. There has been much less analysis of supply-side considerations than of demand-side considerations. Better understanding of manufacturer risk aversion and other supply-side barriers would improve the assessment of the benefits and costs of the CAFE and GHG rules.
Recommendation 9.2 The Agencies should conduct more research on the existence and extent of supply-side barriers to long-term investments in fuel economy technologies.
Finding 9.6 The value of fuel economy is related to the value of other vehicle attributes to consumers. Therefore, understanding the value to consumers of vehicle attributes other than fuel economy is important for the assessment and implementation of the fuel economy rules. If consumers value other attributes, and such attributes are forgone to obtain fuel economy in order to meet the regulations, the benefits and costs of these attributes will need to be accounted for in an assessment of the rule. These attributes could include any technological progress to vehicles that could be made in lieu of fuel economy, including horsepower, acceleration, or accessories that add weight, for example. The few existing studies have found a wide range of values for different vehicle attributes, including for fuel economy, but new survey and statistical approaches may offer promise for improving estimation of the value of these different attributes.
Finding 9.7 Consumers consistently cite quality, reliability, and dependability as the most important factors in vehicle purchase decisions while simultaneously assigning high value to fuel economy. In balancing reliability, fuel economy, and other attributes they value, customers buy fuel-efficient versions of vehicles that suit their other wants and needs. There is a great deal of variation in consumer attitudes toward different types of vehicles, vehicles attributes, and fuel economy.
Finding 9.8 Markets are segmenting in ways that may allow for better fuel economy without a loss in other valued characteristics. For example, there has been a shift in recent years for some consumers away from SUVs and to CUVs. CUVs have similar and even sometimes greater interior size and comfort but trade the towing, off-road, and low-gear-range capabilities of the SUV for the greater fuel economy of a car platform. For a large and growing segment of buyers, this trade-off offers improved value.
Finding 9.9 There is evidence that consumers will not widely adopt technologies to improve fuel economy that interfere with driver experience or comfort. For example, some stop-start and dual-clutch transmission applications have been strongly criticized by consumers. However, over time, implementations of new technologies can improve and potentially find consumer acceptance, and some fuel economy technologies improve drivability or performance, which may be valued by consumers. A challenge in meeting the CAFE/GHG standards in 2020-2025 lies in what further improvements can be gained from the internal combustion engine. Failing that, vehicle manufacturers may encounter significant barriers in marketing new, consumer-facing technologies, especially those with perceived or real trade-offs in vehicle utility, such as driving range for limited-range BEVs.
Finding 9.10 The opportunity to finance a more fuel-efficient vehicle with higher upfront price could be improved if lenders were able to factor in the projected benefits of fuel cost savings for that vehicle model over the life of the loan.
Recommendation 9.3 The Agencies should study the value of vehicle attributes to consumers, consumer willingness to trade off other attributes for fuel economy, and the likelihood of consumer adoption of new, unfamiliar technologies in the vehicle market. This will enable the Agencies to better understand consumer response to the CAFE rules and better assess the rules’ costs and benefits.
Allcott, H., S. Mullainathan, and D. Taubinsky. 2014. Energy policy with externalities and internalities. Journal of Public Economics, accepted for publication and available online as of January 30.
Allcott, H. 2012. The welfare effects of misperceived product costs: Data and calibrations from the automobile market. American Economic Journal: Economic Policy 5(3): 30-66.
Allcott, H., and M. Greenstone. 2012. Is There an Energy Efficiency Gap? Working Paper 228, Energy Institute at Haas, University of California at Berkeley, January.
Allcott, H., and N. Wozny. 2014. Gasoline prices, fuel economy, and the energy paradox. The Review of Economics and Statistics, December, 96(5): 779-795.
Alliance of Automobile Manufacturers. 2009. Automakers Support President in Development of National Program for Autos. Press Release, May 18.
Alquist, R., and L. Kilian. 2010. What do we learn from the price of crude oil futures? Journal of Applied Econometrics 25(4): 539-573.
Alquist, R., L. Kilian, and R.J. Vigfusson. 2010. Forecasting the Price of Crude Oil. in Elliot and Timmerman, eds., Handbook of Economic Forecasting, forthcoming, Elsevier.
Anderson, S.T., R. Kellogg, and J.M. Sallee. 2011. What Do Consumers Believe about Future Gasoline Prices? NBER Working Paper 16974, National Bureau of Economic Research, Cambridge, MA, April.
Baum, A. 2014. Analysis of Wards Sales Data. Baum & Associates. Ann Arbor, MI. March.
Bird, C. 2011. Should I Pay Cash, Lease or Finance My New Car? CNW Marketing Research. http://www.cars.com/go/advice/Story.jsp?section=fin&story=should-i-paycash&subject=loan-quick-start& referer=advice&aff=sacbee.
Blanco, S. 2014. Chevy Volt replacement battery cost varies wildly, up to $34,000. AutoblogGreen, January 10. http://green.autoblog.com/2014/01/10/chevy-volt-battery-replacement-cost-34000/.
BLS (Bureau of Labor Statistics). 2011. Consumer Expenditures. http://www.bls.gov/opub/reports/cex/consumer_expenditures2011.pdf
BLS. 2014. Historical Consumer Price Index for Automobiles. http://www.bls.gov/cpi/cpi_dr.htm.
Blumenstain, C., and M. Taylor. 2013. Rethinking the Energy Efficiency Gap: Producers, Intermediaries, and Innovation. Working Paper. Energy Institute at Haas, Berkeley, CA.
Bordley, R.F. 1993. Estimating Automotive Elasticities from Segment Elasticities and First Choice/Second Choice Data. The Review of Economics and Statistics 75(3): 455-462.
Bowman, Z. 2011. Consumer Reports pulls Recommended rating on Ford Edge, Lincoln MKX - MyFord Touch to blame? Autoblog, January 4. http://www.autoblog.com/2011/01/04/consumer-reportspulls-recommended-rating-on-ford-edge/.
Bradsher, K. 2002. High and Mighty: SUVs—The World’s Most Dangerous Vehicles and How They Got There. PublicAffairs, a member of the Perseus Book Group.
BTS (Bureau of Transportation Statistics). 2013. Table 3-17: Average Cost of Owning and Operating an Automobile(a) (Assuming 15,000 Vehicle-Miles per Year). U.S. Department of Transportation. http://www.rita.dot.gov/bts/sites/rita.dot.gov.bts/files/publications/national_transportation_statistics/html/table_03_17.html.
BTS. 2014. Table 4-23: Average Fuel Efficiency of U.S. Light Duty Vehicle. U.S. Department of Transportation. http://www.rita.dot.gov/bts/sites/rita.dot.gov.bts/files/publications/national_transportation_statistics/html/table_04_23.html.
Bunkley, N. 2013. mpg improvements aid mid-sized sales. Automotive News, March 11.
Busse, M., C. Knittel, and F. Zettelmeyer. 2013. Are consumers myopic? Evidence from new and used car purchases. American Economic Review. February.
California New Dealer Association. 2014. California Auto Outlook 10(1), released February.
Choi, J. NADA 2013 Car Shopper Preference Survey: Quality and Dependability Trump Fuel Economy. NADA Blog. http://www.nada.com/b2b/NADAOutlook/UsedCarTruckBlog/tabid/96/entryid/298/NADA-Spring-2013-Car-Shopper-Preference-Survey-Quality-and-Dependability-Trump-Fuel-Economy.aspx.
Cobb, J. 2015. December 2014 Dashboard. Hybridcars.com, January 6. http://www.hybridcars.com/december-2014-dashboard/.
Colias, M. 2011. Buyers move toward better fuel economy. Automotive News, March 14. http://www.autonews.com/apps/pbcs.dll/article?AID=/20110314/RETAIL07/303149972/1135.
Competitive Enterprise Institute. 1998. National Environmental Survey. Prepared by the polling company for the Competitive Enterprise Institute. http://cei.org/sites/default/files/CEI%20Staff%20-%20National%20Environmental%20Survey.pdf.
Consumer Federation of America. 2014. For First Time Over 50 Percent of Current Year Models Get More than 23 MPG; Over 11 Percent Get 30 MPG! CFA, April 29. Figures 1-3. http://www.consumerfed.org/news/778.
Consumer Reports. 2012a. High gas prices motivate buyers to change direction: Nearly three-quarters of surveyed motorists would consider an alternative-fuel vehicle for their next car. Published online May 2012. http://www.consumerreports.org/cro/2012/05/high-gas-prices-motivate-drivers-to-change-direction/index.htm.
Consumer Reports. 2012b. Ford offers MyFord Touch upgrades for current owners, 2013 models. Consumer Reports News, March 5. http://www.consumerreports.org/cro/news/2012/03/ford-offers-myford-touch-upgrades-for-current-owners-2013-models/index.htm.
Consumer Reports. 2013. Survey: Car shoppers want better fuel economy, here’s why. Consumer Reports News, February 4. http://www.consumerreports.org/cro/news/2013/02/survey-car-shoppers-want-better-fuel-economy-here-s-why/index.htm.
DeGroat, B. 2014. Hitchin’ a ride: Fewer Americans have their own vehicle. University of Michigan Regents. Michigan News, January 23. http://ns.umich.edu/new/releases/21923-hitchin-a-ride-fewer-americans-have-their-own-vehicle.
DOE (Department of Energy). n.d. Propane Vehicle Conversions, Alternative Fuels Data Center. http://www.afdc.energy.gov/vehicles/propane_conversions.html.
DOT (Department of Transportation). 2014. National Transportation Statistics. Table 4-23: Average Fuel Efficiency of U.S. Light Duty Vehicles. http://www.rita.dot.gov/bts/sites/rita.dot.gov.bts/files/publications/national_transportation_statistics/html/table_04_23.html.
Edmunds.com, Inc. 2010. How fast does my new car lose value? http://www.edmunds.com/car-buying/how-fast-does-my-new-car-lose-valueinfographic.html.
Edmunds.com. 2014. Data Center. http://www.edmunds.com/industry-center/data/.
Edwards, A. 2014. Strategic Vision. E-mail message to author, August 19.
EIA (Energy Information Administration. 2014. Weekly Retail Gasoline and Diesel Prices, Petroleum and Other Liquids. http://www.eia.gov/dnav/pet/pet_pri_gnd_dcus_nus_w.htm.
EIA. 2015. Annual Energy Outlook 2015. http://www.eia.gov/forecasts/aeo/section_prices.cfm. Accessed April 24, 2015.
EPA (Environmental Protection Agency). 2012. Regulatory Impact Analysis: Final Rulemaking for 2017-2025 Light-Duty Vehicle Greenhouse Gas Emission Standards and Corporate Average Fuel Economy Standards. PA-420-R-12-016.
EPA. 2014. Light-Duty Automotive Technology, Carbon Dioxide Emissions, and Fuel Economy Trends: 1975 through 2014. EPA-420-S-14-001.
Fischer, C., W. Harrington, and I.W.H. Parry. 2007. Should automobile fuel economy standards be tightened? The Energy Journal 28: 1-30.
Fischer, C. 2010. Imperfect Competition, Consumer Behavior, and the Provision of Fuel Efficiency in Light-Duty Vehicles, RFF Discussion paper 10-60, December 2010.
EPA/NHTSA. 2011. 2017 and Later Model Year Light-Duty Vehicle Greenhouse Gas Emissions and Corporate Average Fuel Economy Standards, Proposed Rules. EPA 40 CFR Parts 85, 86 and 600; 49 CFR Parts 523, 531, 533, 536 and 537. Federal Register 76(231):74854-75420.
EPA/NHTSA. 2012a. 2017 and Later Model Year Light-Duty Vehicle Greenhouse Gas Emissions and Corporate Average Fuel Economy Standards; Final Rule 77(199) October 15.
EPA/NHTSA. 2012b. Joint Technical Support Document, Final Rulemaking 2017-2025 Light-Duty Greenhouse Gas Emission Standards and Corporate Average Fuel Economy Standards. EPA-420-R-12-901.
Fuels Institute. 2014. Consumers and Alternative Fuels: Economics are Top of Mind. http://www.fuelsinstitute.org/ResearchArticles/ConsumersandAlternativeFuels.pdf.
Gallagher, K.S., and E. Muehlegger. 2011. Giving green to get green? Incentives and consumer adoption of hybrid vehicle technology. Journal of Environmental Economics and Management 61: 1-15.
Gallup. 2009. Americans Green-Light Higher Fuel Efficiency Standards. Accessed September 20, 2013. http://www.gallup.com/poll/118543/americans-green-light-higher-fuel-efficiency-standards.aspx.
Gillingham, K., and K. Palmer. 2013. Bridging the Energy Efficiency Gap: Insights for Policy from Economic Theory and Empirical Analysis, RFF DP 13-02, Resources for the Future, Washington, D.C., January.
Gillis, J., and M. Cooper. 2013. On the Road to 54 mpg: A Progress Report on Achievability. Consumer Federation of America. April.
Gilmore, E., and L. Lave. 2011. Comparing Resale Prices and Total Cost of Ownership for Gasoline, Hybrid and Diesel Passenger Cars and Trucks. Working Paper. Carnegie Mellion University.
Goldberg, P.K. 1998. The effects of Corporate Average Fuel Efficiency standards in the U.S. Journal of Industrial Economics XVLI(1): 1-33.
Greene, D.L. 2010. How consumers value fuel economy: a literature review. EPA 420-R-10-008, Environmental Protection Agency, Office of Transportation and Air Quality, March.
Greene, D.L. 2011. Uncertainty, loss aversion and markets for energy efficiency. Energy Economics 33: 608-616.
Greene, D.L., D. Evans, and J. Hiestand. 2013. Survey evidence on the willingness of U.S. consumers to pay for automotive fuel economy. Energy Policy 61: 1539-1550.
Greene, D.L., and J. Liu. 1988. Automotive Fuel Economy Improvements and Consumers’ Surplus. Transportation Research Part A 22A(3): 203-218.
Hamilton, J.D. 2009. Understanding crude oil prices. The Energy Journal 30(2): 179-206.
Helfand, G., and A. Wolverton. 2011. Evaluating the consumer response to fuel economy: a review of the literature. International Review of Environmental and Resource Economics 5(2): 103-146.
Hellman, K.H., and J.D. Murrell. 1984. Development of Adjustment Factors for the EPA City and Highway mpg Values. SAE Technical Paper Series No. 840496, Society of Automotive Engineers, Warrendale, Pennsylvania.
Herrnstein, R.J., G. Lowenstein, D. Prelec, and W. Vaughan, Jr. 1993. Utility maximization and melioration: Internalities in individual choice. Journal of Behavioral Decision Making 6: 149-185.
Hyundai. n.d. We’ve Reimagined the Idea of an Electric Vehicle. https://www.hyundaiusa.com/tucsonfuelcell.
Indiana University. 2011. Plug-in Electric Vehicles: A Practical Plan for Progress. The Report of an Expert Panel. School of Public and Environmental Affairs at Indiana University. http://www.indiana.edu/~spea/pubs/TEP_combined.pdf.
Isidore, C. 2012. Fuel efficiency drives car sales. CNNMoney, April 2. http://money.cnn.com/2012/04/02/autos/fuel-efficiency-car-sales/.
Jaffe, A.B., R.G. Newell, and R.N. Stavins. 2003 Technological change and the environment. in K-G. Mäler and J. Vincent (Eds.) Handbook of Environmental Economics, North-Holland.
Jaffe, A.B., and R.N. Stavins. 1994. The energy-efficiency gap: What does it mean? Energy Policy 22(10): 804-810.
Janes, G. 2013. The Increasing Importance of User Experience. Visual Logic, September 2. http://vlgux.com/2013/09/importance-of-user-experience/.
Jensen, C. 2011. Consumer Reports Poll Shows Support for Stronger Fuel-Economy Standards. New York Times. http://wheels.blogs.nytimes.com/2011/11/14/consumer-reports-poll-shows-support-for-stronger-fuel-economy-standards/?_r=0.
Kahn, J. 1986. Gasoline prices and the used automobile market: A rational expectations asses price approach. Quarterly Journal of Economics 101(2): 323-340.
Kahneman, D. 2011. Thinking Fast and Slow. Farrar, Straus and Giroux, New York.
Khanna, S., and J. Linn. 2013. Do Market Shares or Fuel Economy Explain Rising Shares of New Vehicle Fuel Economy? Resources for the Future Discussion Paper, 13-29. September.
Kilian, L., and E.R. Sims. 2006. The Effects of Real Gasoline Prices on Automobile Demand: A Structural Analysis Using Micro Data. University of Michigan.
Klier, T., and J. Linn. 2013. Technological Change, Vehicle Characteristics, and the Opportunity Costs of Fuel Economy Standards, RFF Discussion paper, Washington, D.C.
Klier T., and J. Linn. 2012. New vehicle characteristics and the cost of the Corporate Average Fuel Economy standards. Rand Journal of Economics 43(1):186-213.
Knittel, C. 2011. Automobiles on Steroids: Product Attribute Trade-offs and Technological Progress in the Automobile Sector. American Economic Review, December, pp. 3368-3399.
Knittel, C. 2012. Reducing petroleum consumption from transportation. Journal of Economic Perspectives. 26(1): 93-118.
Knittel, C. 2013. Are consumers myopic? Evidence from new and used car purchases. The American Economic Review 103(1): 1-41.
Krupnick, A., I.W.H. Parry, M. Walls, T. Knowles, and K. Hayes. 2010. Toward a New National Energy Policy: Assessing the Options. Resources for the Future, Washington, D.C. www.Energypolicyoptions.org.
Kwoka Jr., J.E. 1984. Market power and market change in the U.S. automobile industry. Journal of Industrial Economics 32(4): 509-22.
Levinsohn, J. 1988. Empirics of Taxes on Differentiated Products: The Case of Tariffs in the U.S. Automobile Industry. Trade Policy Issues and Empirical Analysis, National Bureau of Economic Research, pp. 9-44.
Lin, Z., and D.L. Greene. 2011. Predicting Individual On-road Fuel Economy Using Simple Consumer and Vehicle Attributes. SAE Technical Paper 11SDP-0014, Society of Automotive Engineers, Warrendale, PA, April 12.
MacKenzie, D., and J. Heywood. 2012. Acceleration Performance Trends and the Evolving Relationship Between Power, Weight, and Acceleration in U.S. Light-Duty Vehicles: A Linear Regression Analysis. MIT Department of Mechanical Engineering. http://web.mit.edu/sloan-autolab/research/beforeh2/files/MacKenzie&Heywood-TRB-2012-1475.pdf.
Madigan, K. 2014. Vital signs: More households don’t own a car. The Wall Street Journal, January 21. http://blogs.wsj.com/economics/2014/01/21/vital-signs-more-households-dont-own-a-car/?mg=blogs-wsj&url=http%253A%252F%252Fblogs.wsj.com%252Feconomics%252F2014%252F01%252F21%252Fvital-signs-more-households-dont-own-a-car.
Mateja, J. 2013. Chevy’s Gamble on Stop/Start Paying Off, Exec Says. WardsAuto, December 23. http://wardsauto.com/vehicles-amp-technology/chevy-s-gamble-stopstart-paying-exec-says.
McCarthy, P.S. 1996. Market price and income elasticities of new vehicle demands. The Review of Economics and Statistics LXXVII(3): 543-547.
McConnell, V. 2013. The New CAFE Standards: Are they Enough on Their Own? RFF Discussion paper 13-14. Washington, D.C., May. http://www.rff.org/Publications/Pages/PublicationDetails.aspx?PublicationID=22180.
Mellman Group. 2007. Voters Strongly Support Stricter Fuel Efficiency Standards Which They See As Vital For National Security. The Mellman Group, Inc. and Public Opinion Strategies. http://www.pewtrusts.org/uploadedFiles/wwwpewtrustsorg/Reports/Global_warming/poll-energy-national-security.pdf.
Miller, R. 2014. Is Everybody Single? More Than Half the U.S. Now, Up From 37% in ‘76. Bloomberg. http://www.bloomberg.com/news/2014-09-09/single-americans-now-comprise-more-than-half-the-u-s-population.html.
Mintel Group. 2012. SUVs and CUVs - US - April 2012. http://reports.mintel.com/display/590296/?__cc=1.
Morpace, Inc. 2013. PACE Study: Consumers are willing to pay more and sacrifice performance for vehicles with better fuel economy. PR Newswire, November 4. http://www.prnewswire.com/news-releases/pace-study-consumers-are-willing-to-pay-more-and-sacrifice-performance-for-vehicles-with-better-fuel-economy-230529961.html.
NADA. 2014. 2014 New Car Shopper Preference Survey. NADA Used Car Guide: Perspective. August. http://automotivedigest.com/wp-content/uploads/2014/08/2014-NADA-New-Car-Shopper-Preference-Survey.pdf.
Nagy, B. 2014. 2014/2015 Chevrolet Malibu buyers embrace start/stop technology. Kelley Blue Book, July 23. http://www.kbb.com/car-news/all-the-latest/20142015-chevrolet-malibu-buyers-embrace-startstop-technology/2000010939/.
NHTSA (National Highway Traffic Safety Administration). 2012. Final Regulatory Impact Analysis: Corporate Average Fuel Economy for MY 2017-MY2025 Passenger Cars and Light Trucks. Office of Regulatory Analysis and Evaluation, National Center for Statistics and Analysis.
NRC (National Research Council). 2002. Effectiveness and Impact of Corporate Average Fuel Economy (CAFE) Standards. Washington, D.C.: The National Academies Press.
NRC. 2011. Assessment of Fuel Economy Technologies for Light-Duty Vehicles. Washington, D.C.: The National Academies Press.
NRC. 2015. Overcoming Barriers to Deployment of Plug-In Electric Vehicles. Washington, D.C.: The National Academies Press.
Pew Charitable Trusts. 2011. Pew Clean Energy Program poll finds strong support for ambitious standards. http://www.pewenvironment.org/news-room/press-releases/administration-auto-industry-in-sync-with-americans-opinion-on-fuel-economy-85899362431.
Pund, D. 2013. Marchionne Says Nine-Speed Auto Still in the Works for Dodge Dart [2013 Detroit Auto Show]. Car and Driver, January 14. http://blog.caranddriver.com/dodge-dart-to-get-nine-speed-automatic-2013-detroit-auto-show/.
Sallee, J.M. 2013. Rational Inattention and Energy Efficiency. Working Paper 19545, National Bureau of Economic Research, Cambridge, MA, October.
Sanstad, A.H., and R.B. Howarth. 1994. Normal markets, market imperfections and energy efficiency. Energy Policy 22(10): 811-818.
Sivak, M. 2014. Has Motorization in the U.S. Peaked? Part 4: Households without a Light-Duty Vehicle. University of Michigan Transportation Research Institute. January. http://deepblue.lib.umich.edu/bitstream/handle/2027.42/102535/102988.pdf.
Smith, D. H. 2011. GM Investments in Fuel Economy, Design and Quality Paying Off. Automotive Discovery, August 5. http://automotivediscovery.com/gm-investments-in-fuel-economy-design-and-quality-paying-off/929726/.
Stoklosa, A. 2013. 2013 Dodge Dart Rallye 1.4T Manual. Car and Driver, February. http://www.caranddriver.com/reviews/2013-dodge-dart-rallye-14t-manual-long-term-test-wrap-up-review-no-one-will-miss-us-page-4.
Sunding, D., and D. Zilberman. The Agricultural Innovation Process: Research and Technology Adoption in a Changing Agricultural Sector. Chapter 4 in Handbook of Agricultural Economics, Volume 1, eds. B. Gardner and G. Rausser (Elesvier 2001).
Thurlow, A. 2013. Survey: For U.S. shoppers, fuel economy trumps performance. Automotive News, November 8.
Turrentine, T.S., and K.S. Kurani. 2007. Car buyers and fuel economy? Energy Policy 35: 1213-1223.
U.S Bureau of Labor Statistics. 2011. Consumer Expenditures Survey 2011, Table 2. Income before taxes: Average annual expenditures and characteristics. http://www.bls.gov/cex/2011/Standard/income.pdf. Accessed Feb. 3, 2014.
U.S. Census Bureau. 2012. Households and Families: 2010. 2010 Census Briefs, 5. http://www.census.gov/prod/cen2010/briefs/c2010br-14.pdf.
U.S. Federal Trade Commission. 2014. Buying a New Car. http://www.consumer.ftc.gov/articles/0209-buying-new-car.
Voelcker, J. 2014. Nissan Leaf $5,500 Battery Replacement Loses Money, Company Admits. Green Car Reports, July 24. http://www.greencarreports.com/news/1093463_nissan-leaf-5500-battery-replacement-loses-money-company-admits.
WardsAuto. Data Center. http://wardsauto.com/data-center.
Whitefoot, K.S., and S.J. Skerlos. 2012. Design incentives to increase vehicle size created from the U.S. footprint-based fuel economy standards. Energy Policy 41: 402-411.
World Public Opinion (WPO). 2006. U.S. Public Favors Raising Auto Fuel Efficiency (CAFE) Standards. http://www.worldpublicopinion.org/pipa/articles/btenvironmentra/193.php?nid=&id=&pnt=193&lb=bte.


