
The basic function of a transmission, together with the differential, is to reduce the relatively high engine output speeds to the vehicle’s slower wheel speeds and to increase the torque applied to the wheels. Figure 5.1 illustrates a six-speed transmission enabling engine torque variation across changing engine speeds. Integral to many automatic transmissions are hydraulic torque converters, which also provide significant torque multiplication under starting and low speed conditions. Transmission design affects vehicle fuel consumption in two ways: First, increasing the number of gear ratios and providing a larger ratio spread allows the internal combustion engine to operate more often in regions of high efficiency. These design features concurrently provide smaller change steps to maintain nearer-to-optimum engine speeds. Second, reducing parasitic losses within the transmission improves transmission efficiency and reduces vehicle fuel consumption. In addition to these considerations, adapting transmissions to new fuel-efficient, turbocharged, downsized engines with fewer cylinders and to diesel engines with higher torque fluctuations generally necessitates additional torsional vibration damping.
In addition to pursuing improvements in conventional automatic transmissions, which dominate light-duty vehicles in the United States, a variety of alternative transmission designs are being developed and introduced into production. Dual-clutch transmissions (DCTs), with significantly lower parasitic losses, have already been introduced in some production vehicles and are providing reductions in fuel consumption. However, drivability and consumer acceptance issues remain for the most efficient dry-clutch DCTs. The continuously variable transmission (CVT) has seen a recent resurgence, and its penetration in the new vehicle fleet has increased significantly. Although the CVT provides the ideal ratio for any operating condition, the full potential of this attribute is not realized because the parasitic losses can exceed those of a conventional automatic transmission.
These approaches are being pursued by vehicle manufacturers and suppliers and are discussed in this chapter. The first section discusses the fundamentals of transmissions and covers design architecture, number of ratios and ratio spreads, and parasitic losses within various transmissions. The second section discusses specific transmission-related technologies, some considered and others not considered by the Corporate Average Fuel Economy (CAFE) rule analysis. In the second section, the committee’s estimates of the effectiveness of each technology are presented, along with the committee’s approach to estimating costs. The chapter concludes with the committee’s findings and recommendations on transmissions.
TRANSMISSION FUNDAMENTALS FOR ACHIEVING FUEL CONSUMPTION REDUCTIONS
The energy distribution in a typical gasoline vehicle is shown in Figure 5.2. Driveline losses, which include the transmission, differential, and final drive gear, consume 5 to 6 percent of the energy input to the vehicle. Transmission losses alone consume approximately 4 percent of the energy. Since engine losses are approximately 70 percent, engine gross output energy is 30 percent of the input energy of the gasoline fuel. Thus, transmission losses of 4 percent of the energy input equal approximately 13 percent of the engine gross output. Consequently, if transmission losses could be reduced by 15 percent, fuel consumption would be reduced by 2 percent (0.15 × 4% = 0.6% reduction in losses; 0.6%/30% = 2% FC reduction).
Transmission Architectures
Transmissions have been categorized by the Environmental Protection Agency (EPA) as automatic, CVT, and manual. EPA’s estimated market share for each type of transmission in 2014 is shown in Figure 5.3. Automatic transmissions include conventional planetary automatic transmissions and DCTs. The architectures of these transmissions as well as CVTs are discussed in this section.
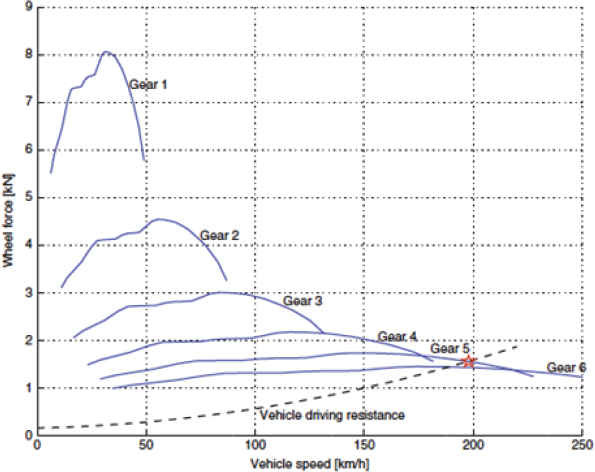
FIGURE 5.1 Wheel force, which is proportional to wheel torque, versus vehicle speed, which illustrates multiplication of engine torque and reduction in engine speed provided by a six-speed transmission. The vehicle resistance line determines maximum vehicle speed.
SOURCE: Reprinted from Eriksson and Nielsen (2014) with permission.
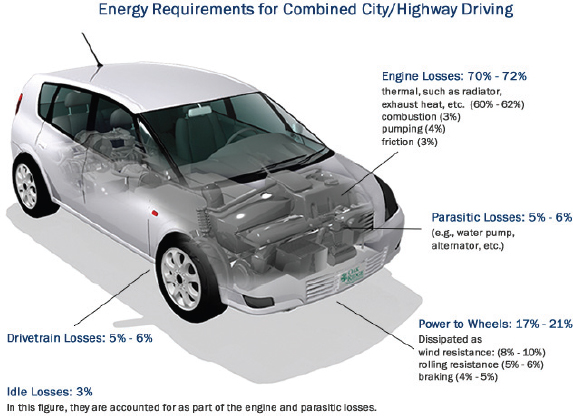
FIGURE 5.2 Energy distribution in a gasoline vehicle.
SOURCE: DOE (2014).

FIGURE 5.3 Market share of different types of transmissions in 2014.
SOURCE: Data from EPA (2014).
Planetary Automatic Transmission
Automatic transmissions (ATs) are currently the dominant transmission in the United States and are likely to remain the leading choice through 2025 (EPA 2014). Most automatic transmissions use planetary gear sets and are popular in large part due to their ease of operation and smooth launch feel off of idle. They have also benefited from over 70 years of continuing development and improvements in cost effectiveness. The smooth launch feel is made possible by the torque converter that not only provides a fluid coupling between the engine and the driveline but also provides significant torque multiplication at launch.
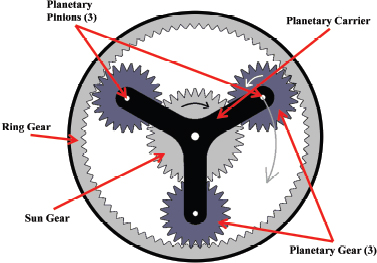
Conventional automatic transmissions generally use planetary gear sets to transfer power and multiply engine torque to the drive axle. A simple planetary gear set, shown in Figure 5.4, consists of three parts: a sun gear, a planet carrier, and a ring gear. A limited number of gear ratios are available from a single planetary gear set. Gear sets can be combined to increase the number of available gear ratios. A modern transmission will have various configurations of planetary gear sets to provide the various gear ratios required for the vehicle. The following three types of planetary gear sets are generally used in automatic transmissions:
- Simpson gear set has two planet carriers and two ring gears with a common sun gear. This provides three forward gears plus neutral and reverse.
- Ravigneaux gear set has two sun gears and two planet carriers with a common ring gear. This provides four forward gears plus neutral and reverse.
- Lapelletier gear set connects a simple planetary gear set to a Ravigneaux gear set. This provides six to eight forward gears.
Six-Speed Automatic Transmissions
Six-speed automatic transmissions are currently widely used in the market, while seven-, eight-, and nine-speed transmissions are also in production, although with smaller market shares. A typical six-speed planetary transmission is shown in Figure 5.5 and includes the torque converter, the planetary gear set, clutches, the gerotor oil pump, and the valve body. A transmission control unit (TCU) is used to activate multiple solenoid valves that apply hydraulic pressure through the valve body to actuate or release multiple clutches and brakes that are applied or released to control the output speed ratio. The efficiency of conventional automatic transmissions ranges from 86 to 94 percent, where transmission efficiency is defined as the power output divided by the input power, multiplied by 100.
Eight-Speed Automatic Transmissions
Recent introductions of eight-speed transmissions have included the ZF 8HP45 transmission in several Chrysler products, including Ram pickup trucks and rear wheel drive (RWD) cars and numerous vehicles from several European manufacturers. The General Motors 8L90 transmission was introduced in the 2015 MY large pickup trucks and large SUVs and the Chevrolet Corvette sports car. The ZF eight-speed transmission, shown in Figure 5.6, consists of a torque converter, four planetary gear sets, and five shifting elements (brakes A and B; clutches C, D, and E). The use of five shifting elements is notable since the outgoing six-speed automatic transmission also used five shifting elements.
Nine-Speed Automatic Transmissions
Several nine-speed automatic transmissions have also been recently introduced. These include the front wheel drive (FWD) ZF 9HP, recently introduced in the Jeep Cherokee, and the Mercedes 9G-Tronic, recently introduced in a Mercedes E350 with a 3.0L diesel engine (Daimler 2013).
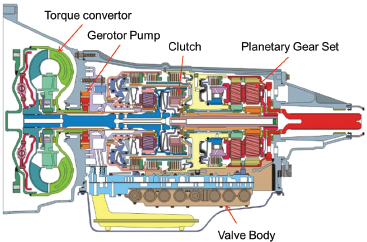
FIGURE 5.5 Typical six-speed planetary automatic transmission.
SOURCE: Copyright © 2006 ATSG (Automatic Transmission Service Group).
Ten-Speed Automatic Transmissions
Ford Motor Company and General Motors announced in 2013 that they are jointly developing nine- and ten-speed automatic transmissions for reduced fuel consumption and improved performance, particularly with smaller engines (Healey and Woodyard 2013). In 2014, VW announced that it had plans for a ten-speed dual clutch transmission for better fuel economy.
Due to advancements in architecture optimization, the increased ratios in these new transmissions are being implemented with minimal increase to package size, component count, and cost. Software optimization tools are being used to develop architectures requiring fewer elements by utilizing some of the elements (e.g., planetary gear elements) for multiple speeds. However, these new transmissions have high development costs and long design and validation phases. After defining a suitable layout, a new transmission generally takes 5 years for design, development, and implementation in production.
Dual-Clutch Transmission
DCTs are architecturally similar to manual transmissions but add automated shifting and typically utilize two coaxial input shafts and two clutches to shift between the two input shafts, as shown in Figure 5.7. This enables DCTs to perform a clutch “hand-off,” where the clutch of the currently utilized gear opens as the clutch of the next gear to be engaged closes. With precise control of the releasing clutch and the engaging
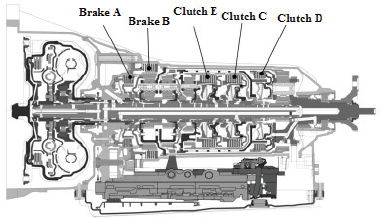
FIGURE 5.6 Cross section of the ZF eight-speed automatic transmission – 8HP45.
SOURCE: Dick et al. (2013). Reprinted with permission from SAE paper 2013-01-1272 Copyright © 2013 SAE International.
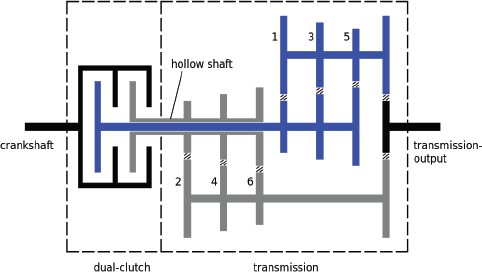
FIGURE 5.7 Schematic of a dual clutch transmission.
SOURCE: C-Lover, Wikimedia Commons, http://commons.wikimedia.org/wiki/File:Dual-clutch_transmission.svg, public domain, accessed February 13, 2015.
clutch for the next gear, smooth shift quality approaching that of a conventional automatic transmission can be achieved. DCTs have parasitic losses similar to a manual transmission, which are significantly lower than a conventional planetary automatic transmission because of the benefit of on-demand pumps, use of splash lubrication, and minimized clutch drag losses since only two clutches are used.
Although DCTs offer significant potential for minimizing transmission losses, they have faced customer acceptance obstacles in the United States, primarily since the U.S. market is accustomed to the smooth feel of a torque converter during launch, which is difficult to replicate with DCTs. The launch feel becomes more of an issue with downsized, turbocharged engines that provide less transient torque at launch. These engines, when paired with a DCT, often require a “launch gear” to provide suitable acceleration from a stop that equals the feel provided by a torque converter.
The lack of smooth launch performance with DCTs has prompted Honda to announce the development of an eight-speed DCT for the 2015 MY, featuring the first use of a torque converter in a DCT (Carney 2014). This should provide the smooth low-speed driving dynamics of a traditional automatic transmission with a gearbox that is more efficient. As an additional benefit, torque multiplication of the torque converter will improve acceleration from idle.
Another method OEMs are using to increase the market penetration of DCTs is to implement the wet-clutch version instead of the dry-clutch version. While the current dry-clutch DCT can offer 0.5 percent to 1 percent lower fuel consumption, current designs sacrifice drivability and suffer from poor customer acceptance. This difference in drivability and consumer acceptance can be seen in the comparison of two of Volkwagen’s MY 2015 vehicles, the VW Golf and the VW Polo. The Golf, with a wet-clutch DCT, has received many positive reviews and awards, while the Polo, with a dry-clutch DCT, has received poor reviews for transmission-related drivability.
Continuously Variable Transmission
The continuously variable transmission (CVT) is becoming more popular due to its simple mechanical design and potential fuel economy benefits. EPA estimated that the U.S. market share of CVTs would increase to 19.3 percent in 2014. In contrast, the compliance demonstration scenario for the 2017-2025 standards within the Technical Support Document (TSD) has a zero percent penetration for CVTs. Several 2014 MY vehicles with CVTs are among the vehicles with high fuel economy ratings, as shown in Figure 8.11 in Chapter 8. A typical CVT consists of two cone-shaped pulleys and a connecting belt, as shown in Figure 5.8. By moving the cone-shaped pulley halves axially, the pulleys are able to produce a continuous variation in the ratio of the engine input speed to the driveline output speed. This continuous variation in ratios allows the engine to operate at its most efficient condition for the power level required. The CVT also benefits from the lack of discrete shift events of conventional automatic transmissions, preventing customer issues with possible shift harshness. In the near term, the belt-driven CVT is likely to remain the only type that will have any market penetration in the light-duty market before 2020. There is the possibility that the toroidal CVT may be offered in light-duty applications in the 2020 to 2030 time frame. The toroidal architecture has been tested by multiple OEMs, but these OEMs have currently chosen to go with conventional belt designs for production.
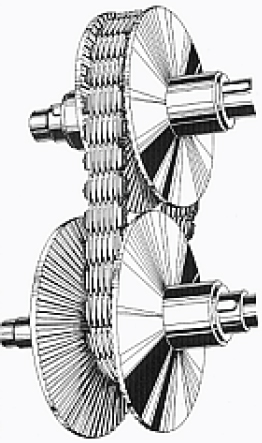
FIGURE 5.8 CVT with details of the steel belt.
SOURCE: Büdeler Naumann, Wikimedia Commons, http://commons.wikimedia.org/wiki/File:Pivgetriebe.png, accessed March 2, 2015.
The Dana Variglide continuously variable planetary (CVP) technology is another promising CVT technology (Dana Holding Corp. 2014). This technology was derived from the Fallbrook NuVinci CVP. While currently not in any known near-term production plans, this technology may be offered in the 2020 to 2030 time frame.
In contrast to this advantage, drawbacks to the CVT include slow consumer acceptance due to nontraditional engine sounds and vibrations and concerns about the materials used in the manufacturing of the belt. A term commonly used to describe the feel of most CVTs is “rubber band” because the connection between the driver’s throttle input and the vehicle’s acceleration response is often not as direct as with a conventional planetary automatic transmission. Some manufacturers have instituted a calibration from the control of a CVT that mimics an automatic transmission, but this can result in less-than-optimal fuel economy. However, in spite of the previously poor acceptance of CVTs in the U.S. market, OEMs have begun targeting specific vehicle types for CVTs as a method of reintroducing CVTs into the U.S. marketplace. An electronically controlled CVT (eCVT), used in powersplit hybrids, consists of a planetary gear set shown in Figure 4.2.
Manual Transmission
Manual transmissions (MTs) are estimated by EPA to have a market share in the U.S. of only 3.7 percent, in part because manual transmissions require the driver to manually actuate the clutch and change the gear. The manual transmissions in current vehicles are generally cheaper to manufacture, lighter in weight, better performing, and more fuel efficient than all but the newest automatic transmissions. Additionally, while more driver effort is required to operate a manual transmission than an automatic transmission, manual transmissions have a simpler mechanical design, as shown in Figure 5.9. In a manual transmission, the gears on the output shaft and the parallel layshaft are always engaged with each other. A selected gear is subsequently engaged to the output shaft with the use of a synchronizer. The collar of the synchronizer makes frictional contact with the gear before the dog teeth make contact to engage the output shaft. The synchronizers are engaged with forks that are controlled by rods engaged by the shift lever.
The lower cost of a manual transmission results not only from the simplicity of design but also from the absence of a transmission control unit (TCU), which generates costs for control software and calibration. Manual transmissions have the highest efficiency due to their inherently low parasitic losses. Because they are usually splash-lubricated from gears spinning in the oil sump, manual transmissions usually do not require the oil pump or forced cooling that most automatic transmissions require. These factors contribute to a manual transmission’s ability to transfer torque with only about 4 percent energy loss of the engine’s gross output, compared to 13 percent loss for conventional automatic transmissions.
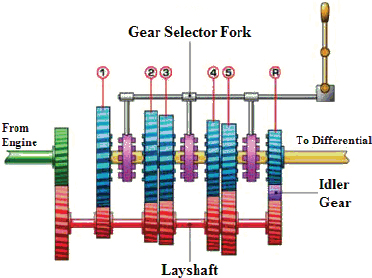
FIGURE 5.9 Manual transmission.
SOURCE: Brain (2000). Reprinted courtesy of HowStuffWorks.com. All rights reserved. http://auto.howstuffworks.com/transmission3.htm.
Automated Manual Transmission
Automated manual transmissions (AMTs) are essentially manual transmissions with either electromechanical or electrohydraulic actuators added to automate both the clutch and gear selection. This transmission architecture promised parasitic losses nearly equivalent to manual transmissions, but with the same ease of operation as a conventional automatic transmission. While the AMT was successful in delivering low parasitic losses, it had significant deterioration in driving comfort when the fully automatic mode was not engaged. Figure 5.10, which is a plot of vibration dose value (VDV), a common metric used to measure shift comfort, shows that AMTs are significantly worse than conventional automatic transmissions and dual clutch transmissions. In short, the single clutch on an AMT introduced a lag in acceleration that drivers found uncomfortable. Due to this issue, AMTs are not considered acceptable for the U.S. market.
Number of Ratios and Ratio Spread
There are two primary methods employed in transmissions to reduce vehicle fuel consumption. The transmission ratios and the ratio spread are chosen so that the engine can operate at the lowest available BSFC1 condition for the power level required.2 The upper portion of Figure 5.11 shows the engine operating conditions on the CAFE cycle for a vehicle with a six- speed automatic transmission, and the lower portion of the figure shows the BSFC island map overlaid with several lines of constant power. The green dots show the lowest BSFC value for each constant power line. The upper plot shows that many of the operating conditions are between 1,000 rpm and 1,500 rpm and are close to the minimum BSFC condition for the power required. Some of the other conditions are at higher loads and speeds, but the lines of constant power are generally contained within the same region of BSFC values. There is, however, some opportunity to move some of the operating conditions at higher engine speeds toward the best BSFC values for reduced fuel consumption. The dominant trend toward reduced engine speeds for reduced fuel consumption is limited by NVH and drivability concerns.
An Argonne National Laboratories’ (ANL) study of the impact of transmission technologies on fuel efficiency evaluated the fuel economy improvements of six-speed and eight-speed automatic transmissions. The ratios used for this study
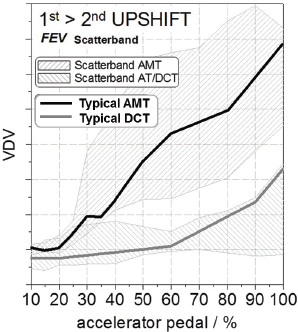
FIGURE 5.10 Comparison of vibration dose value (VDV) for automated manual transmission (AMT) with conventional automatic transmission (AT) and dual clutch transmission (DCT).
SOURCE: Govindswamy, Baillie, and D’Anna (2013).
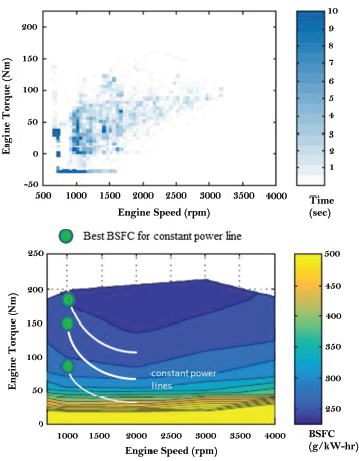
FIGURE 5.11 Engine operating conditions on the CAFE cycle for a vehicle with a six-speed automatic transmission and a BSFC island map overlaid with several lines of constant power.
SOURCE: Developed from Middleton et al. (2015).
_____________
1 The brake-specific fuel consumption (BSFC) is equal to an engine’s fuel consumption (g/hr) divided by brake power (kW), which is the usable output power of an engine. BSFC is proportional to the inverse of engine efficiency (usable work/fuel energy input). A BSFC map displays islands of constant BSFC as a function of engine torque, or BMEP, versus engine speed. Brake-specific fuel consumption is typically measured with the engine operated on a dynamometer.
2 The gear, or transmission, ratio is the ratio of the rotational speed of the driving gear to the rotational speed of the final drive gear.
are listed in Table 5.1; they represent ratios of transmissions currently on the market.
In addition to providing increased torque multiplication from idle and significantly lower engine speeds at high vehicle speeds, reducing the steps between each gear is another enabler for reduced fuel consumption. The reduced steps between each gear allow the engine to operate closer to the minimum fuel consumption condition for the power required for every operating condition. The ability of these reduced steps to facilitate operation closer to the minimum fuel consumption condition is illustrated in Figure 5.12. A line of constant power is overlaid on a BSFC island map. Operating conditions on this constant power line are shown for the six-speed and eight-speed transmissions. As illustrated, the eight -speed transmission is capable of operating closer to the lowest available BSFC condition shown at an engine speed of 1,000 rpm. In contrast, the engine with the six-speed transmission operates at a speed of more than 200 rpm over the engine speed provided by the eight-speed transmission. As a result, for this example of a constant power condition, the eight-speed transmission would operate with 5 percent lower fuel consumption. This example also illustrates the benefit of a CVT with continuously variable ratios to reach the lowest available BSFC condition, without having the constraints of a stepped ratio transmission.
Ratio spread is defined as the first gear ratio divided by the top gear ratio. As additional gears have been added to transmissions, with lower first gears and higher top gears, the ratio spread has also increased significantly over the years, shown in Figure 5.13. The highest ratio spread of 9.8:1 is shown for the Jeep Cherokee with the ZF nine-speed automatic transmission. The larger ratio spread provides increased torque multiplication off idle and significantly lower engine speeds at high vehicle speeds, which reduces fuel consumption.
| Gear Number | 1 | 2 | 3 | 4 | 5 | 6 | 7 | 8 | |||||||||||
| Reference 5-speed automatic | 2.56 | 1.55 | 1.02 | 0.72 | 0.52 | ||||||||||||||
| 6-speed transmissions | 4.15 | 2.37 | 1.56 | 1.16 | 0.86 | 0.52 | |||||||||||||
| 8-speed transmissions | 4.6 | 2.72 | 1.86 | 1.46 | 1.23 | 1 | 0.82 | 0.52 | |||||||||||
SOURCE: Moawad and Rousseau (2012).
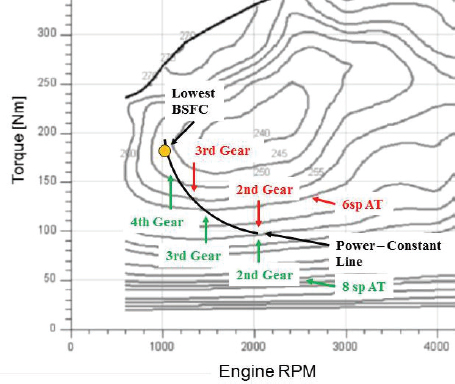
FIGURE 5.12 Fuel consumption benefits of an eight-speed compared to a six-speed automatic transmission, shown as an overlay on a BSFC island map.
SOURCE: Adapted from Dick et al. (2013). Reprinted with permission from SAE paper 2013-01-1272. Copyright © 2013 SAE International.
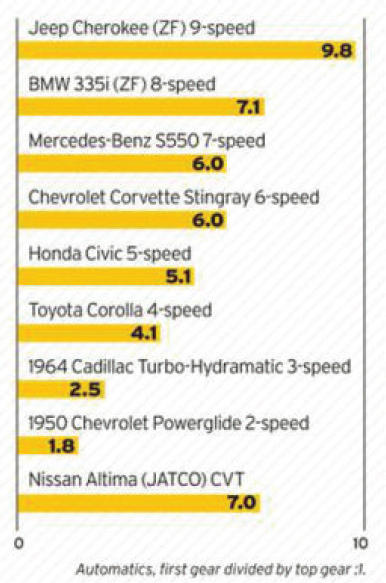
FIGURE 5.13 Increase in ratio spread over the past 65 years.
SOURCE: Sherman (2013). Published in Car and Driver magazine, December 2013.
A comparison of the engine operating envelopes for a vehicle with a six-speed automatic transmission and an eight-speed automatic transmission is shown in Figure 5.14. Compared to the six-speed transmission, the eight-speed transmission results in the engine operating at higher BMEP3 levels over a narrower speed range and at lower average speeds, all of which tend to reduce fuel consumption.
As automatic transmissions and dual clutch transmissions trend toward higher numbers of ratios and ratio spreads, diminishing benefits for fuel consumption reduction are anticipated. Recent studies, such as the one by Getrag (Eckl and Lexa), shown in Figure 5.15, have indicated that only minimal reductions in fuel consumption are achieved beyond 7 ratios and a ratio spread of 8.5. This result depends on the engine and vehicle specifications, so the results may not apply to all vehicles. Additionally, the results from Figure 5.15 are based on the New European Drive Cycle (NEDC) and have the potential for different results on U.S. drive cycles. There is evidence later in this chapter indicating that the benefits of reducing transmission parasitic losses can be greater than the benefits of moving from seven speeds to nine. Moving from an 8.5 ratio spread to 10 also does not provide significant fuel economy benefits but may provide improved performance.
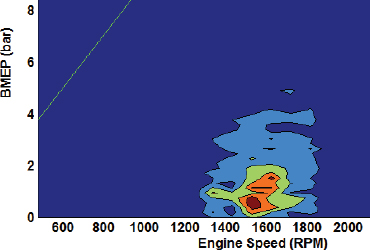
FIGURE 5.14 Engine operating conditions for six-speed (left) and eight-speed (right) automatic transmissions on the FTP-75 drive cycle. Note that the color scale shows the density of the operating points, where dark blue represents no operating points and dark red represents the highest density of operating points. The eight-speed transmission (right) compared to the six-speed transmission (left) results in a narrower range of engine speeds and higher level of BMEPs, which result in improved fuel economy.
SOURCE: Shidore et al. (2014).
The committee has also found, through full system simulations conducted by the University of Michigan, that as the engines incorporate more new technologies to improve fuel consumption, including variable valve timing and lift, direct injection, and turbocharging and downsizing, the benefits of increasing transmission ratios or switching to a CVT diminishes. Similar results have been reported from other modeling studies. As the engine efficiency map improves, the penalty of having a larger ratio step between gears is significantly reduced compared to the example shown in Figure 5.12 for a naturally aspirated engine. As discussed in Chapter 8, the benefit of an eight-speed transmission over a six-speed transmission is reduced by approximately 15 percent when added to a modestly turbocharged, downsized engine instead of a naturally aspirated engine.
There are, however, other reasons for going to higher ratio spreads and speeds. DCTs, for example, do not have the
_____________
3 Brake mean effective pressure, or BMEP, is the torque per cubic inch of engine displacement. It is used to evaluate an engine’s efficiency when producing torque at a given engine displacement. The higher the BMEP of an engine, the more work it produces for a given engine displacement. This is a theoretical value and does not represent actual in-cylinder pressures of the engine.
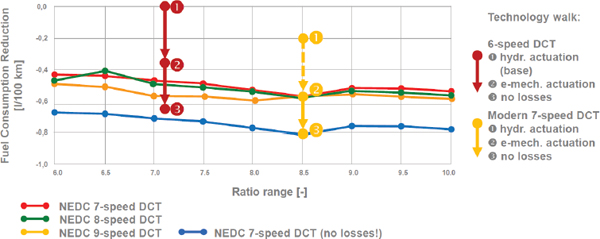
FIGURE 5.15 Fuel consumption reduction as a function of ratio range and number of speeds (ratios).
SOURCE: Eckl and Lexa (2012).
torque multiplication provided by a torque converter. In order to achieve acceptable vehicle launch feel, an ultrahigh first gear, significantly exceeding the 4.6:1 shown in the previous example, may be required to compensate for the lower transient torque available at launch from turbocharged, downsized engines. A very low final ratio can also be implemented to enable lower engine speed at highway speed. Some OEMs have already implemented such low ratio gears, which can maintain highway speed but require a downshift for any acceleration or grade. The two requirements for a high first gear and low final gear can result in an overall ratio spread of up to 10.5 for a dual clutch transmission. To maintain the ratio steps in the same range as smaller ratio spread transmissions, thus preventing unpleasant shift feel, a larger number of gears will be required, particularly for DCTs without torque converters. The first example of this is Volkswagen’s announcement of the ten-speed DCT discussed previously. Conventional automatic transmissions are not expected to require the large ratio spreads of DCTs to achieve acceptable launch feel because torque converters provide torque multiplication during launch. The Honda DCT that utilizes a torque converter will also not require a higher number of speeds for customer satisfaction.
Parasitic Losses
The second method for reducing fuel consumption involves improving efficiency by reducing parasitic losses of the transmission. Losses in a modern eight-speed automatic transmission operated over the combined CAFE city and highway cycles are shown in Figure 5.16. The total parasitic losses result in a 6 percent loss in fuel economy for this example transmission, and the categories of loss are identified in the figure, with oil supply, drag torque, and creep or idle torque being the three largest categories. Since the EPA/Ricardo study (2011) showed that baseline, four-speed automatic transmissions in the 2010 MY had losses of approximately 10 percent; the estimates were scaled to this level to represent the 2010 MY baseline that NHTSA used in its analysis of transmission technologies. The 2010 MY baseline transmission losses are listed in Table 5.2. Technologies for further reductions in transmission losses for each category shown in Table 5.2 are reviewed in this section.
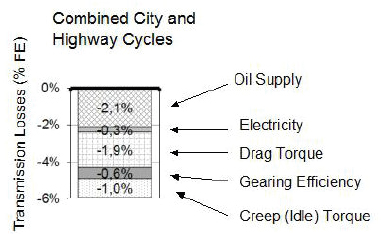
FIGURE 5.16 Transmission losses in a modern eight-speed automatic transmission.
SOURCE: Dick et al. (2013). Reprinted with permission from SAE paper 2013-01-1272. Copyright © 2013 SAE International.
TABLE 5.2 Transmission Losses Estimated for a 2010 Baseline Automatic Transmission
| Losses | Losses - % FE |
| Oil Supply | 3.6 |
| Electricity | 0.5 |
| Drag Torque | 3.2 |
| Gearing Efficiency | 1.0 |
| Creep (Idle) Torque | 1.7 |
| Total Losses | 10.0 |
NOTE: Transmission is four-speed automatic with torque converter.
Oil Supply
Automatic transmissions require an oil pump for lubrication and for hydraulic pressure for clutch clamping. The pressure range for automatic transmissions and dual clutch transmissions is generally dictated by the clamping force required on the clutch plates to transmit torque without slipping. Typically, automatic transmissions operate with oil pressures between 5 and 20 bar. An example plot of clutch torque capacity versus pressure is shown in Figure 5.17. The relationship between torque and pressure varies with the clutch diameter, number of plates, friction material, and oil properties.
The dominant loss in the oil supply category results from the oil pump. Automatic transmissions have typically used gerotor-type pumps driven off the torque converter. Alternative pump systems for oil supply are shown in Figure 5.18. These systems range from reducing the main supply pressure, using a more efficient vane pump, applying a dual-stage vane pump, and using a variable displacement pump. The variable displacement vane pump has the greatest potential to reduce losses and improve fuel economy by 1 percent, relative to a conventional fixed gerotortype pump. The high efficiency gearbox—level 1, discussed later in the chapter—includes the variable displacement vane pump.
Recently introduced transmissions have incorporated off-axis dual displacement or variable displacement vane pumps, as shown in Figure 5.19. These pumps are often driven by a chain off the main input axis and sometimes with a speed ratio change in order to operate the pump in a more efficient speed range. The variable displacement allows for quick response to provide high pressures required for high torque clutch engagement, but since the majority of operating points are at lower steady-state torque, the pump can operate at a significantly lower displacement for much of the drive cycle. Application of off-axis pump designs can also allow the pump to be downsized to reduce parasitic losses. This ability to operate the pump at a speed different from the torque converter’s speed enables a smaller diameter pump since the speeds can be higher.
Further reductions in oil pump energy losses can be achieved with a dual pump system. The energy losses for a dual pump system are compared to a variable displacement vane pump over the NEDC driving cycle in Figure 5.20 for both conventional automatic transmissions and CVTs. Studies have shown that utilizing a small vane pump that is sized to cover the majority of driving conditions and a second electric auxiliary pump to cover high pressure demands can provide approximately a 2 percent reduction in fuel
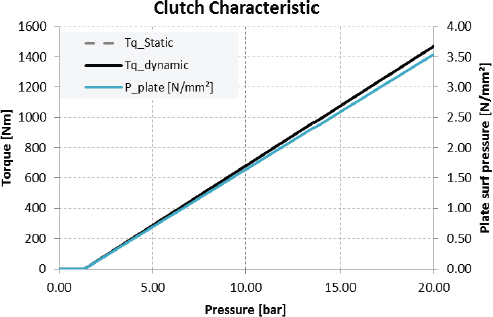
FIGURE 5.17 Typical clutch torque capacity as a function of hydraulic pressure.
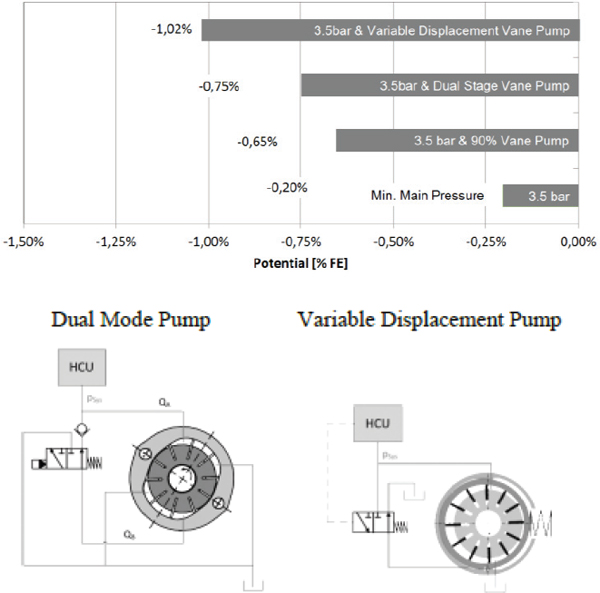
FIGURE 5.18 Alternative pump systems for oil supply.
SOURCE: Dick et al. (2013). Reprinted with permission from SAE paper 2013-01-1272 Copyright © 2013 SAE International.
consumption. The Mercedes 9G-Tronic transmission uses this type of dual pump system. However, the improvement in fuel consumption comes at the cost of a second pump. Alternatively, a single, variable displacement vane pump could be used to reduce costs, but this would sacrifice a small percentage of the efficiency improvement of the dual pump system for conventional automatic transmissions, as shown in Figure 5.20. The smaller, more frequently operating pump of the dual pump system can be better optimized for its operating conditions than the larger, single variable displacement pump. During periods of relatively low pressure demand, such as steady speed highway driving, the smaller, optimized pump would operate the majority of the time. The high efficiency gearbox—level 2, discussed later in the chapter—includes a dual pump system. As shown in Figure 5.20, the oil pump for the CVT has higher energy losses than a conventional automatic transmission. Consequently, improvements in the oil pump for the CVT can provide larger reductions in energy losses in this transmission.
High efficiency gearbox—level 3—involves removing a full-time oil pump from the automatic transmission and using an on-demand electric pump for lubrication/cooling and electromechanical shifting. Similar to some DCTs that use electric motors for shifting, an electric motor, ball ramp, and axial bearing can be used to shift a wet clutch in a conventional automatic transmission. A fully functional
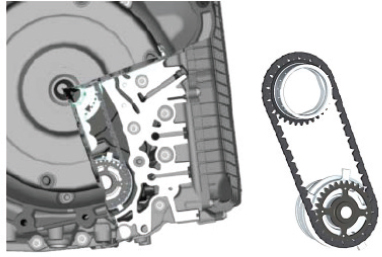
FIGURE 5.19 Off-axis double stroke vane pump.
SOURCE: Gartner and Ebenhock (2013). Reprinted with permission from SAE paper 2013-01-1276. Copyright © 2013 SAE International.
automatic transmission with this technology was developed by FEV; the shifting element is shown in Figure 5.21. The system has the additional benefit of locked end positions so that no power is required to maintain the clamp load on a clutch. Eliminating the pump can result in up to a 3.6 percent reduction in fuel consumption for conventional automatic transmissions, as indicated in Table 5.2. Production-proven technology would require a redesign of an automatic transmission architecture. As a result, this technology is considered applicable after 2025.
Drag Torque
Clutches
The second largest loss is due to drag torque from the clutches, brakes, bearings, and seals. Transmissions that use wet clutches, which include conventional automatic transmissions and DCTs, will incur drag losses from open (disengaged) clutch packs rotating in oil. The loss is caused by the shearing of oil between the rotating, open clutch plates. The smaller gaps between the plates and higher viscosity oil will result in a higher shearing loss. While DCTs will only have one open clutch at any given time, an automatic transmission may have from two to four. Additionally, a DCT will deselect the synchronizer for cruising conditions to reduce the loss to synchronizers rather than open the clutches. The clutch packs are used in automatic transmissions to change ratio by locking elements of planetary gear sets. A typical six-speed automatic transmission may have five clutch packs, while an eight- or nine-speed may have five or six. New transmission designs will attempt to keep as few clutches open as
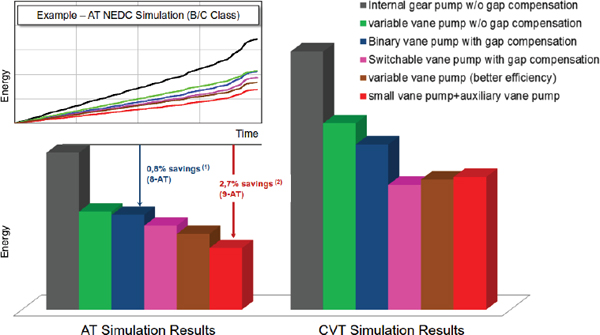
FIGURE 5.20 Transmission oil pump designs for reduced energy consumption in conventional automatic transmissions and CVTs.
SOURCE: Shulver (2013).
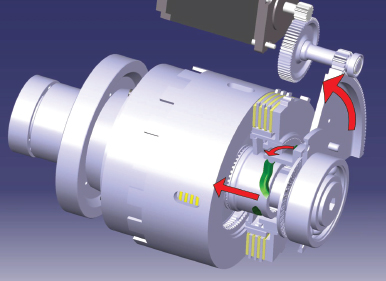
FIGURE 5.21 Electric motor with ball ramp and axial bearing for shifting a wet clutch in a conventional planetary automatic transmission.
SOURCE: Govindswamy, Baillie and D’Anna (2013).
possible in each gear due to the drag losses. In several new transmission architectures, two clutch packs are open at any given time, leaving the other three or four closed. Clutch drag losses vary significantly due to differences in clutch sizes and overall transmission architecture.
New advancements in clutch plate technology have resulted in significant reductions in drag losses. The friction material on the clutch plates today generally includes grooves to optimize oil flow through the plates, which enhances cooling and reduces losses. Placing wave springs between the plates, as shown in Figure 5.22, creates wider gaps between the plates to allow oil to flow more freely between the plates. The larger the gap, the less oil shearing, but the larger gaps can have negative effects on clutch response time. The springs also add parts and cost. Figure 5.23 shows results from a Borg Warner study (Martin 2012) indicating that a 90 percent reduction in clutch drag loss can be achieved from a baseline of flat friction plates. While not shown in Figure 5.23, other components that should be considered are dual-rate clutch pistons since they are able to increase running clearance and still offer acceptable performance. Since most current automatic transmissions currently use clutch plates with some grooving in them, a modern transmission may achieve a clutch drag loss reduction of approximately 50 percent. Computational fluid dynamics can be used to create groove patterns that remove the oil from the shearing interface.
Clutch Slip
While it is most efficient to close a clutch as quickly as possible, the abrupt closure can cause unpleasant noise, vibration, and/or harshness (NVH). When shifting between gears in an automatic transmission or a DCT, some amount of clutch slip is required for smoothness, but slip has the negative effect of generating considerable heat, which requires cooling flow, and results in an increase in fuel consumption. As engine torsional vibrations continue to increase with turbocharged, downsized engines, clutch slip is increasingly being used for the lockup torque converter clutch of conventional automatic transmissions and in DCTs to reduce the transmission of these torsionals to the wheels. This slip across a clutch results in a power loss. Conventional automatics sometime utilize micro-slip as a means to improve NVH. This process involves slipping the clutch very slightly
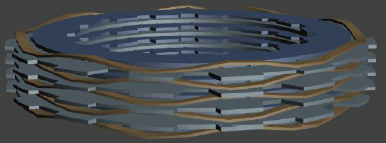
FIGURE 5.22 Wave springs for separating clutch plates
SOURCE: Martin (2012).
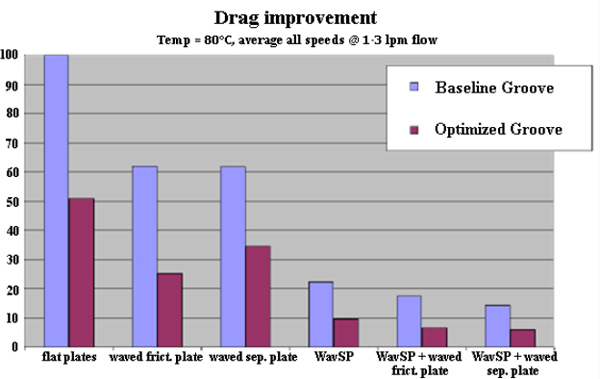
FIGURE 5.23 Improvements in clutch drag.
SOURCE: Martin (2012).
to smooth out some of the vibrations in the driveline that would have been transmitted by a locked, direct coupling. However, this practice is quite inefficient when compared to a damper and should generally be avoided if possible. This loss can be approximately 100 W at cruise speeds (resulting from 20 rpm micro-slip and 50 Nm torque). Usually, micro-slip is only used when passing through a small rpm range known to cause unacceptable NVH. In DCTs using a clutch for launch, a considerable amount of power is lost during the initial vehicle launch through clutch slip that is used to prevent engine stall and ensure smooth acceleration.
Churning
Churning losses in a transmission occur when a component, such as a gear, synchronizer, or clutch pack, rotates through an oil bath. In manual transmissions and DCTs, some amount of churning is required, as those transmissions typically depend on splash lubrication for their internal components. Automatic transmissions and CVTs typically employ forced lubrication, which results in less churning loss but requires a pump to pressurize oil. Oil levels in a transmission that result in rotating components churning the oil and in energy loss need to be kept as low as possible while still providing adequate lubrication.
The viscosity of transmission oil changes significantly with temperature. Transmissions operating with fully warmed-up oil have significantly lower spin losses, as shown in Figure 5.24. It is therefore desirable to warm up the transmission oil as quickly as possible. A rapid warm-up system for transmission oil was estimated to provide a fuel consumption reduction of 0.8 percent at a 2017 direct manufacturing cost of $45-$63.
Bearings and Seals
Bearings and seals used in transmissions also contribute to drag torque losses. Replacing the widely used tapered roller bearings with angular contact ball bearings has been shown to provide a 50 to 75 percent reduction in bearing friction in dual clutch transmissions, manual transmissions, and differentials. However, not all applications will allow for replacing tapered roller bearings due to the duty-cycle and architecture requirements. This is especially true in some highly loaded differentials.
Newly developed low-friction seals for transmission bearings can reduce seal friction by 50 percent to provide an overall reduction in bearing friction loss of approximately 10 percent (NSK 2014). Seal friction was reduced by narrowing the seal lip and modifying its shape. The seal lip shape was improved to stabilize the contact pressure around its edge.
Drag Losses
Low-Friction Lubricants
Similar to the use of low-viscosity engine oil for reduced fuel consumption, low-viscosity automatic transmission fluids (ATFs) can be used for additional reductions in fuel
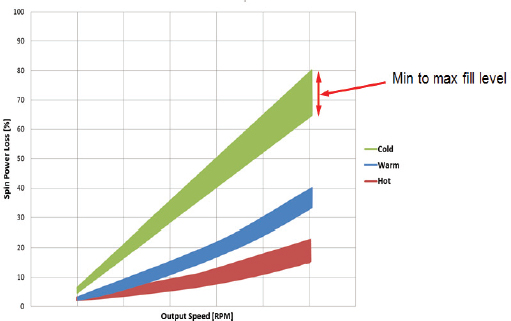
FIGURE 5.24 Spin loss vs. temperature and oil level.
SOURCE: Baillie et al. (2014).
consumption. While low-viscosity oil can result in reduced spin loss, it can also result in increased wear on gears and bearings. In a gear mesh, oil is used to create a thin film between the gear teeth to prevent metal to metal contact. For this purpose, higher viscosity oil is usually preferred, and using lower viscosity oil can necessitate making gears and bearings larger to reduce the unit loads on the gear teeth and bearings for acceptable life with lower viscosity oil, in turn raising the cost. The results presented by Noles (2013), shown in Figure 5.25, indicate that about a 2 percent fuel consumption reduction was obtained on the FTP 75 cycle by switching to the lowest viscosity oil. It is unclear if this transmission could still pass a minimum 150,000 mile durability requirement with this low viscosity ATF. Further investigation of the fuel consumption reductions and associated durability are required. The committee has assumed a conservative 0.5 percent benefit from lower viscosity oil at a 2017 direct manufacturing cost of $50, which is included in the high efficiency gearbox (level 2) estimate. The cost is primarily due to the need to review and update gear and bearing sizes. Validation testing will be required to ensure durability and performance, as well as the need to potentially update calibrations based on different hydraulic circuit performance.
Gearing Efficiency
Gears are one of the most efficient and cost effective means of transferring torque in a transmission. However, when torque is transmitted through gears, some amount of this torque is lost to heat as the gear teeth slide together, squeezing oil between them. These losses can be reduced by improving the surface finish on the gears. Superfinishing the gears and using various coatings on the gear teeth can provide a reduction in fuel consumption but at an increased cost. There is currently limited information available that correlates gear finish to fuel economy. The committee assumes that approximately 0.3 percent is a representative estimate for the reduction in fuel consumption with superfinishing the gear teeth in an automatic transmission.
Parasitic Loss Differences in Transmission Architectures
The differences in parasitic losses among the main transmission architectures are summarized below:
Automatic Transmissions
- Constant pump operation for clutch pressure and cooling,
- Forced lubrication,
- Open clutch drag,
- Torque converter inefficiencies while unlocked (idle and low speed), and
- Micro-slip.
Dual-Clutch Transmissions
- On-demand pump operation (or electromechanical actuation),
- Similar spin loss to a MT (for dry DCTs and next generation wet DCTs),
- Splash or on-demand lubrication,
- Only one open clutch in a wet DCT during certain operating conditions, and
- No torque converter inefficiencies.
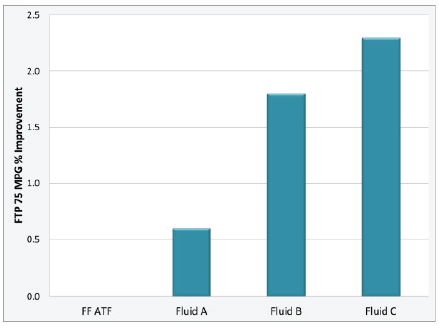
FIGURE 5.25 Fuel economy improvements with low friction lubricants in a 2.0L, four-cylinder SUV equipped with a FWD six-speed automatic transmission.
SOURCE: Noles (2013). Infineum, presented at 2013 SAE Transmission Symposium.
Continuously Variable Transmissions
- Pressure required by the sheaves at high torque,
- Low number of open clutches (usually zero or one),
- Torque converter inefficiencies while unlocked (idle and low speed), and
- Micro-slip.
The relative power losses for conventional automatic transmissions, DCTs, and CVTs are shown as a function of input speed in Figure 5.26 and as a function of input torque in Figure 5.27. Conventional automatic transmissions have parasitic losses from clutches, the torque converter, and constant pump operation. DCTs typically have the lowest losses, as shown in Figure 5.26, due largely to benefits from an on-demand pump, splash lubrication, and fewer open clutches. CVTs are traditionally penalized due to high pressures required for the sheaves to maintain clamp-load on the belt. However, the latest generation of CVTs is approaching conventional automatic transmission loss levels due to advanced controls, improved piston/belt designs, and reduced clamping pressures. CVTs benefit from having only a single clutch that is closed for drive and a brake that is closed for reverse.
Figure 5.27 shows that the DCT has the lowest losses while the CVT and conventional automatic transmission have similar losses at low input torques. However, the losses of the CVT increase significantly as input torque increases due to the high pressures required to maintain the clamping force. These results depend on specific designs, but significant “over clamping” may be used to ensure no belt slip during low-speed transient maneuvers. Such over clamping significantly increases the losses.
The vast majority of DCT losses over a typical fuel economy drive cycle can be attributed to load-independent drag and splash losses, as illustrated in Figure 5.28. For over 90 percent of the NEDC test cycle, the engine operates at less than 50 percent of rated torque. At 50 percent of rated torque, the average CVT losses are 85 percent higher than for a DCT, as shown in Figure 5.27. These losses continue to increase for high torque loads, so that a degradation in customer fuel economy would be anticipated for driving conditions beyond the CAFE test cycles.
DCTs were introduced into the U.S. market in production vehicles with six speeds and wet clutches. Dry clutch DCTs were also introduced in production and are capable of providing an additional 0.5 to 1 percent fuel consumption reduction at a direct manufacturing cost savings of approximately $50 to $60 relative to a wet clutch DCT. However, a dry clutch DCT has a limited maximum torque capability so that its use is limited to applications with smaller engines, despite having more efficiency than a wet clutch. The dry clutches do not require oil cooling flow and therefore do not contribute to oil churning losses that are incurred with wet clutches. The difference in losses between wet and dry clutch DCTs is shown in Figure 5.29. However, advances in wet clutch design, such as using on-demand cooling to create a “damp” clutch, have reduced the parasitic losses typically associated with a wet clutch. New clutch plate designs and leakage-free actuation have also contributed to reducing the losses of a wet clutch. The next generation wet clutch DCTs are expected to have
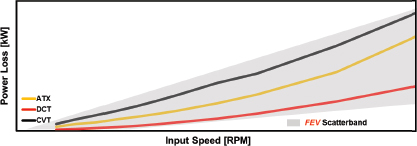
FIGURE 5.26 Transmission power losses as a function of input speed.
SOURCE: Govindswamy, Baillie, and D’Anna (2013).
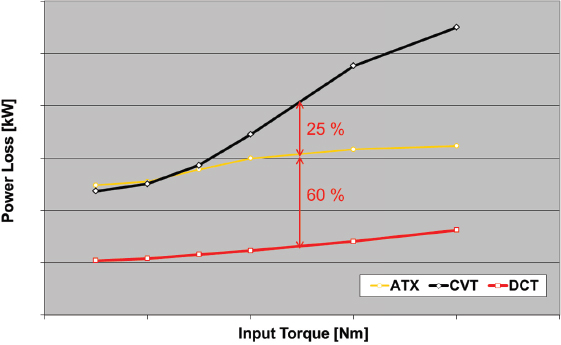
FIGURE 5.27 Transmission power losses as a function of input torque.
SOURCE: Baillie et al. (2014).
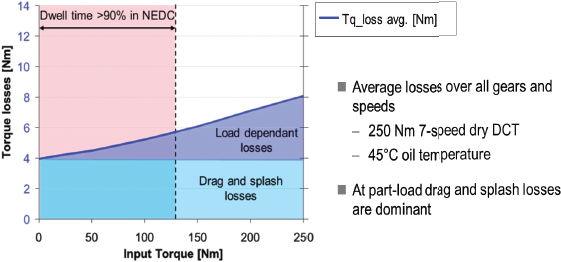
FIGURE 5.28 Torque losses as a function of input torque for a dual clutch transmission.
SOURCE: Baillie et al. (2014).
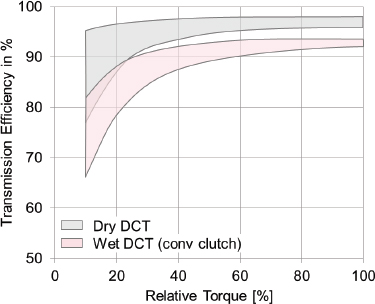
FIGURE 5.29 Comparison of wet and dry DCT efficiencies.
SOURCE: Baillie et al. (2014).
efficiencies approaching the lower end of the range shown for dry clutch DCTs.
FUEL CONSUMPTION REDUCTION TECHNOLOGIES CONSIDERED IN THE FINAL CAFE RULE ANALYSIS
This section discusses the committee’s fuel consumption reduction and direct manufacturing cost estimates and compares them to NHTSA’s estimates. Fuel consumption reduction effectiveness and direct manufacturing costs are generally presented for a midsize car with an I4 engine for simplicity. However, a complete set of estimates for transmission technologies for a midsize car with an I4 dual-overhead camshaft (DOHC) engine, a large car with a V6 DOHC engine, and a large light truck with a V8 overhead valve (OHV) engine are provided in Table 5A.1 for effectiveness and Table 2A.2a, b, and c (Annex) for 2017, 2020, and 2025 for direct manufacturing costs, respectively.
Learning Factors
In the following discussion of costs, several of the estimated costs shown in the TSD are derived from EPA/FEV teardown cost analyses. These costs are generally valid for the 2012 MY and are shown in 2010 dollars. The TSD shows costs for the 2017 through the 2025 MY, which are generally derived from the estimates for the 2012 MY. The estimates for the later years are derived by applying learning factors to the 2012 MY estimates. NHTSA applied learning curve Type 11 to most of the transmission technologies and Type 12 to continuously variable transmissions; these learning factors are shown in Table 5.3. The committee has continued to apply the same learning factors to the cost estimates in this chapter. Learning factors are discussed in greater detail in Chapter 8.
Improved Automatic Transmission Controls/Externals
Improved automatic transmission controls (IATCs) are defined in the NHTSA RIA (NHTSA 2012) as consisting of Aggressive Shift Logic—Level 1 (ASL1) and Early or Aggressive Torque Converter Lockup. ASL1 reduces fuel consumption by operating the engine at lower speeds and higher loads by shifting into a higher gear when possible. The degree to which the engine can operate at lower speed is limited by factors such as NVH and engine “lugging.”
Early torque converter lockup is used to reduce the high parasitic losses that occur in a torque converter when it is open and to provide reductions in fuel consumption. Modern transmissions tend to lock up the torque converter just off idle and keep it locked for most driving conditions above 1,000 to 1,300 rpm. In situations where total lockup is not possible due to NVH concerns, the option of partial lockup, or micro-slip, which results in some clutch slip, can be employed. The torque converter, when open, is a fluid coupling that serves as a torsional vibration damper for torsional vibrations
TABLE 5.3 Learning Factors for Most Transmission Technologies
| Learning Factor | 2012 | 2017 | 2020 | 2025 | |||||||||||||||
| Type 11 | 1.00 | 0.87 | 0.81 | 0.74 | |||||||||||||||
| Type 12 | 1.1 | 0.95 | 0.89 | 0.81 | |||||||||||||||
Base year with LF - 1.00 is 2015 for Type 12
at low engine speeds. The ability to lock up the converter at low engine speeds has been extended by enhancing the ability of the torsional vibration dampers. Improved dampers and micro-slip control of the lockup clutch have enabled earlier lockup speeds.
NHTSA assumes that IATC will be applied to the baseline transmission before upgrading the transmission, but generally IATC is applied at the same time as an upgrade to a six-speed transmission is applied. The committee’s estimates of effectiveness and costs for IATC are shown in Table 5.4.
Shift Optimization
Shift optimization, which is also called Aggressive Shift Logic—Level 2 (ASL2), is defined by NHTSA as a strategy that selects the appropriate transmission ratio to keep the engine operating near its most efficient point for a given power demand. During development of this strategy, Ricardo estimated that fuel economy benefits of up to 5 percent can be obtained when compared to typical MY 2010 shift maps. In this strategy, the transmission controller continuously evaluates all possible gear options that would provide the necessary tractive power (while limiting the adverse effects on driveline NVH) and selects the gear that lets the engine run in the most efficient operating zone. Ricardo acknowledged in its report that the ASL2 (shift optimization) strategy currently adversely affects drivability and, hence, consumer acceptability. The optimum shift strategy for fuel economy can often result in NVH issues or driver discomfort as the transmission experiences shift “busyness” due to frequent changes in gear ratios. NHTSA recognized that deteriorating NVH is a limiting factor in the degree of shift optimization possible and made attempts to prevent the transmission from shifting more often than in a baseline test case. Many vehicle manufacturers provided the same feedback and indicated that they had implemented similar aggressive shift strategies, only to provide updated calibrations to limit the aggressive shift strategy to reduce customer complaints about frequent shifting.
Because of this consistent feedback, the committee recommends that shift optimization is not available to provide NHTSA’s estimated 3.9 to 4.1 percent reduction in fuel consumption. This is particularly significant since shift optimization was shown by NHTSA to be nearly a no-cost technology, which gave it the best cost effectiveness (dollars per percent fuel consumption reduction) of any of the technologies defined by NHTSA for the 2017 to 2025 CAFE rulemaking. New shift optimization algorithms continue to be applied to new transmission and vehicle combinations, but this is considered an integral part of the calibration process for any new transmission/vehicle and not a separate technology. In order to recognize that there are always continuous improvements being made in the areas of controls and NVH, the committee has applied a 0.5 to1.0 percent fuel consumption reduction to shift optimization (ASL2). A 2025 direct manufacturing cost of $22 equal to the cost for ASL1 was estimated for shift optimization and is primarily the result of NVH-related hardware necessary to allow the more aggressive shift strategy.
Six-Speed Automatic Transmissions
Effectiveness
Argonne National Laboratories used its Autonomie vehicle simulation tool to provide NHTSA with fuel consumption reduction results for several transmission technologies in support of the final CAFE rulemaking (Moawad and Rousseau 2012). ANL’s results from simulating a vehicle with six- and eight-speed automatic transmissions are shown in Table 5.5. Two different levels of efficiency were evaluated for the eight-speed transmission. These results were used by the committee for evaluating NHTSA’s fuel consumption reduction effectiveness estimates.
NHTSA estimated in the TSD (EPA/NHTSA 2012) that a six-speed automatic transmission can provide a 2.0 percent reduction in fuel consumption relative to a four-speed automatic transmission. The Autonomie vehicle simulation results shown in Table 5.5 indicate a 0.77 percent reduction for a six-speed relative to a five-speed transmission. Extrapolating the Autonomie results to a six-speed from a four-speed transmission is estimated to provide more than
| Improved Automatic Transmission Controls/Externals (IATC) | NRC Estimated Most Likely Fuel Consumption Reduction (%)a | NHTSA Estimated Fuel Consumption Reduction (%)a | NRC Estimated Most Likely MY2025 DMC (2010$)a | NHTSA Estimated MY 2025 DMC (2010$)a | |||||||||||||||
| Aggressive Shift Logic - Level 1 (ASL1) | 22 | 22 | |||||||||||||||||
| Early Torque Converter Lockup | 20 | 20 | |||||||||||||||||
| Overall IATC | 2.5 - 3.0 | 3.00 | 42 | 42 | |||||||||||||||
aRelative to baseline.
| Fuel Consumption (L/100 km) | |||||||||||||||||||
| Conventional - Automatic Transmission | FTP | HFET | Combined | ||||||||||||||||
| 5-speed - 92% efficiency | 7.64 | 5.50 | 6.50 | ||||||||||||||||
| 6-speed - 92% efficiency | 7.62 | 5.44 | 6.45 | ||||||||||||||||
| Improvement (%) | 0.38 | 1.11 | 0.77 | ||||||||||||||||
| 6-speed - 92% efficiency | 7.62 | 5.44 | 6.45 | ||||||||||||||||
| 8-speed - 92% efficiency | 7.53 | 5.29 | 6.33 | ||||||||||||||||
| Improvement (%) | 1.08 | 2.61 | 1.90 | ||||||||||||||||
| 8-speed - 92% efficiency | 7.53 | 5.29 | 6.33 | ||||||||||||||||
| 8-speed - 96% efficiency | 7.31 | 5.13 | 6.14 | ||||||||||||||||
| Improvement (%) | 2.92 | 3.05 | 2.99 | ||||||||||||||||
SOURCE: Moawad and Rousseau (2012).
twice the fuel consumption reduction shown in the table, or approximately 2 percent reduction. Based on these results and other feedback received from vehicle manufacturers and suppliers, the committee’s low most likely estimate of 2 percent agrees with NHTSA’s estimate. A high most likely estimate of 2.5 percent was based on feedback received by the committee.
Cost
The TSD for the 2017-2025 MY CAFE standards indicates that a six-speed automatic transmission has a 2017 direct manufacturing cost of −$13 (savings) relative to a four-speed automatic transmission. In contrast to this estimate, the TSD for the earlier 2012-2016 MY CAFE standards (EPA/NHTSA 2010) developed a cost of $101 for a six-speed automatic transmission relative to a four-speed automatic transmission. The derivation of the $101 direct manufacturing cost is summarized in Table 5.6, based on the following steps:
- The FEV teardown cost analysis determined that the six-speed transmission was $106 less costly than the five-speed transmission (EPA/FEV 2010). The TSD indicated that this “counterintuitive” result was attributed to the six-speed transmission having a Lepelletier-type gear set instead of a conventional planetary gear set, which requires an additional one-way clutch. The issues with the FEV cost teardown study are described in Box 5.1.
- To relate the six-speed transmission cost to a four-speed transmission, the TSD applied a $91 cost estimate from the NPRM for a five-speed transmission relative to a four-speed transmission.
- The TSD proceeded to average the non-Lepelletier gear set cost with the Lepelletier gear set cost (the FEV cost teardown estimate of −$106). NHTSA estimated the cost of a six-speed transmission without the non-Lepelletier gear set at $215 (2007 dollars) relative to four-speed transmission. Subtracting the $91 (four-speed to five-speed transmission) gave a cost of $124 for the non-Lepelletier cost of a six-speed transmission relative to a five-speed transmission.
- Averaging the $124 for the non-Lepelletier gear set transmission with the FEV cost of −$106 for the Lepelletier gear set transmission yielded an average cost of $9 for a six-speed transmission relative to a five-speed transmission.
- The $9 cost (five-speed to six-speed) was added to the $91 cost (four-speed to five-speed) to provide a cost of $101 (2007 dollars) for a six-speed transmission relative to a four-speed transmission.
Subsequent to the 2012-2016 MY TSD, the EPA/NHTSA 2017-2025 MY Technical Support Document estimated a direct manufacturing cost of −$13 (savings) for a six-speed automatic transmission relative to a four-speed automatic
TABLE 5.6 Derivation of Direct Manufacturing Costs for Automatic Transmission (2007 dollars)
| Technology | Non-Lepelletier Cost Used in 2011 CAFE Analysis | NPRM | FEV Teardown (Lepelletier-like) | Final Rule | Comments | ||||||||||||||
| 5-Speed Relative to 4-Speed Automatic | $91 | N/A | $91 | Final Rules uses NPRM Value | |||||||||||||||
| 6-Speed Relative to 5-Speed Automatic | −$106 | $9 | $215 − $91 = $124 [$124 + (−$106)]/2 =$9 | ||||||||||||||||
| 6-Speed Relative to 4-Speed Automatic | $215 | $153 | N/A | $101 | $91 + $9 = $101 (values are rounded) | ||||||||||||||
NOTE: Blank cells represent values not considered in this analysis; N/A means that FEV did not conduct a teardown study of the technology. Refer to text for more detail on the Comments column.
SOURCE: EPA/NHTSA (2010).
BOX 5.1
FEV Cost Teardown Study Issues:
Six-Speed versus Five-Speed Automatic Transmission
The FEV cost teardown study (EPA/FEV 2010) had the following issues: (1) the baseline was not a four-speed automatic transmission but was a five-speed transmission, and (2) the six-speed transmission had a Ravigneaux gear set, whereas the five-speed transmission has three planetary gear sets, which is more complex than the Ravigneaux gear set. The three planetary gear sets require nine control elements (four disc clutches, three disc brakes, and two sprag clutches), whereas the six-speed transmission with the Ravigneaux gear set only requires six control elements (two disc clutches, three disc brakes and one sprag clutch). FEV recognized these issues by providing the following statement in their study:
In regard to the 5-speed automatic transmission, many of innovative ideas implemented into the 6-speed automatic could have been incorporated into a new 5-speed if it were to be redesigned. The most obvious NTA (New Technology Advances) would be adopting a similar Ravigneaux geartrain design, which could conceivably have the same financial benefit recognized by the 6-speed automatic.
This was an unusual teardown cost analysis since the five-speed transmission contained more hardware (i.e., approximately 150 more parts), and was generally more complex, than the six-speed transmission. As a result, the six-speed transmission established a zero-cost baseline from which an incremental cost for the five-speed was established. The majority of the incremental cost increase of the five-speed over the six-speed was associated with the two additional clutch packs, the need for a counter shaft assembly, and some additional gearing.
transmission, which appears to have resulted from using only the case with the Lepelletier gear set. Applying the approach used by NHTSA in Table 5.6, which considers both Lepelletier and non-Lepelletier gear sets rather than the Lepelletier gear set alone, the committee developed incremental direct manufacturing costs for both gear sets, as shown in Table 5.7. The costs derived in Table 5.7 were adjusted to 2010 dollars from 2007 dollars by the GDP factor of 1.04. Then the appropriate learning factors were applied to derive the 2017, 2020, and 2025 direct manufacturing costs. The committee’s estimated effectiveness and costs for six-speed automatic transmissions relative to four-speed automatic transmissions are summarized in Table 5.8. Accounting for the two different gear sets separately is preferable, although this information is not readily available to EPA in the manufacturers’ certification applications. Since most light-duty vehicles will have transmissions with at least six speeds by the 2016 MY, this is not a critical cost issue for the 2017 to 2025 MY time frame but does affect total costs from the null or 2008 MY baseline vehicle.
Previous estimates for transmissions with increased ratios are shown in Table 5.9. These previous estimates are higher than the current estimate, but the committee believes that this reflects maturity, especially for the six-speed automatic transmission. Many current six-speed automatic transmissions have been on the market long enough to have undergone refinements directed toward improving efficiency and reducing costs. For example, the GM 6T40 FWD transmission is currently in its third generation.
Eight-Speed Automatic Transmissions
Effectiveness
NHTSA estimated that an eight-speed automatic transmission can provide a 4.6 percent reduction in fuel consumption relative to a six-speed automatic transmission, which is significantly larger than the 1.9 percent estimated by the Autonomie vehicle simulation results shown in Table 5.5. Vehicle manufacturers indicated that the fuel consumption reductions shown by NHTSA in the TSD and RIA were overstated. The Autonomie simulations appear to confirm this finding. Based on these findings, together with consistent input received from vehicle manufacturers and suppliers, the committee’s most likely effectiveness estimate ranges from 1.5 to 2.0 percent. NHTSA’s estimate of 4.6 percent is assumed to include not only the benefits of upgrading from a six-speed transmission to an eight-speed transmission, but also the benefits of the efficiency improvements that are discussed in the following section.
Cost
EPA contracted FEV to conduct a cost teardown study of an eight-speed automatic transmission relative to a six-speed automatic transmission and concluded that the eight-speed transmission would have an incremental cost of $61.84 (EPA/FEV 2011). This analysis compared the ZF eight-speed 8HP70 RWD transmission with the ZF six-speed 6HP26 RWD transmission. The six-speed transmission incorporates a Lepelletier automatic transmission gearing
| Technology | Non-Lepelletier Gearset Cost Used in 2011 CAFE Analysis | NPRM | Lepelletier-Like Gearset Cost from FEV Teardown Analysis | Comments | |||||||||||||||
| 5-Speed Automatic from 4-Speed Automatica | $91 | $91 | Apply NPRM Cost | ||||||||||||||||
| 6-Speed Automatic from 5-Speed Automatica | −$106 | FEV Teardown Cost | |||||||||||||||||
| 6-Speed Automatic from 4-Speed Automatica | $215 | −$15 | |||||||||||||||||
| Adjusted to 2010$ | $224 | −$16 | 1.04 GDP Factor | ||||||||||||||||
| Adjusted for Learning | |||||||||||||||||||
| 2017 | $195 | −$13 | Learning Factor = 0.87 | ||||||||||||||||
| 2020 | $181 | −$12 | Learning Factor = 0.81 | ||||||||||||||||
| 2025 | $165 | −$11 | Learning Factor = 0.74 | ||||||||||||||||
a2007 dollars.
| 6- and 8-Speed Automatic Transmissions | NRC Estimated Most Likely Fuel Consumption Reduction (%)a | NHTSA Estimated Fuel Consumption Reduction (%)a | NRC Estimated Most Likely MY2025 DMC ($)a | NHTSA Estimated MY2025 DMC ($)a | |||||||||||||||
| 6-Speed Automatic from | 2.0 - 2.5 | 2.0 | −11 | −11 | |||||||||||||||
| 4-Speed Automatic (Lepelletier Type) | |||||||||||||||||||
| 6-Speed Automatic from | 2.0 - 2.5 | N/A | 165 | N/A | |||||||||||||||
| 4-Speed Automatic (Non-Lepelletier Type) | |||||||||||||||||||
| 8-Speed Automatic from | 1.5 - 2.0 | 4.6b | 47 - 115 | 47 | |||||||||||||||
| 6-Speed Automatic (Lepelletier Type) | |||||||||||||||||||
aRelative to baseline, except when noted.
bNHTSA estimate is consistent with NRC estimate when HEG1 effectiveness of 2.7% is included.
| Transmission Type | EEA 2007($) | Martec 2008($) | EPA/FEV Teardowns 2010 and 2011($) | OEM Input 2013-2014($) | |||||||||||||||
| 5-Speed AT | 133 | ||||||||||||||||||
| 6-Speed AT | 133 | 215 | –105.53a | 40 to 530 | |||||||||||||||
| 7-Speed AT | 170 | ||||||||||||||||||
| 8-Speed AT | 425 | 61.84a | 50 to 150b | ||||||||||||||||
aThe 6-speed FEV teardown is relative to a 5-speed, and the 8-speed is relative to a 6-speed.
bThe 8-speed OEM costs are relative to a 6-speed.
configuration, which uses a single planetary gear set along with a Ravigneaux gear set. The eight-speed transmission implemented a new gearing system, consisting of four planetary gear sets controlled by an equivalent number of shift elements (consisting of three disc clutches and two brakes), as compared to the ZF six-speed transmission. FEV provided the following caveat regarding this cost analysis, indicating that the analysis was only for the addition of gears and that other efficiency technologies were not included in the analysis:
Note that when the 8-speed transmission was redesigned, several other functional and performance updates not driven
by the added gear ratios were incorporated (e.g., modified hydraulic control strategy, spool valve material, friction discs, as well as a newly-developed torque converter). These modifications were not estimated in the analysis since they are independent of the gear ratio addition and modifications.
The committee reviewed the FEV cost teardown study of the eight-speed automatic transmission, especially in light of FEV’s caveat, and found that numerous enhancements had probably been included to ensure suitable functionality of a transmission with increased number of ratios and increased frequency of shift events. These enhancements were not related to reduced losses for efficiency improvements, which are discussed separately in the next section. Such differences can also result when a specific teardown study that involves one example of the new technology and one example of the outgoing technology may not be representative of the new technology when it is implemented across the entire fleet of new vehicles (see Box 5.2). In addition to the EPA/FEV teardown cost estimate of $61.84, the committee’s analysis of possible incremental costs for an eight-speed transmission is shown in Table 5.10. The analysis shows that the costs could range from $61.84 up to $156 (2010 dollars). Adjusting these costs for learning yielded 2025 MY direct manufacturing costs ranging from $47 to $115, as shown in Table 5.8.
The cost of the components for the efficiency improvements were not included in the cost to upgrade from a six-speed transmission to an eight-speed transmission, which the committee agrees is the correct method of cost analysis, since the cost of the efficiency improvements can be applied to most transmissions as a separate set of technologies. However, those improvements contribute to a significant portion of the ZF eight-speed transmission’s improved efficiency. If typical transmissions are used as references for costs and benefits, such as the upgrade of a six-speed automatic transmission to a production eight-speed automatic transmission like the ZF 8H, then the costs and benefits of the eight-speed transmission upgrade need to be combined with those of the high-efficiency gearbox—level 1 (HEG1), discussed later in this section, to be representative of all of the technologies in the eight-speed transmission. Therefore, the costs and benefits of the eight-speed transmission, as defined above and shown in Table 5.8, must be combined with the technologies included in the HEG1 for 2017 MY and beyond.
BOX 5.2
Teardown Cost Study Issues:
Eight-Speed Automatic Transmission and Dual-Clutch Transmission
Teardown cost studies have been used by the Agencies to significantly improve cost estimates of new technologies that may be applied to meet future CAFE targets. The teardown process involves selecting an example of the new technology that has been implemented in production and an example of the outgoing technology. The selection of these two examples is critically important in arriving at a representative estimate of the incremental cost of the new technology. However, there is a risk that this process may not provide estimates that are fully representative of the technology when it is implemented across the entire fleet of new vehicles. These concerns are particularly relevant to transmissions, which can often have significant variations in architectures, as discussed below.
Additionally, Tier 2 suppliers’ profits may not be accurately reflected in the cost estimates. Patents and royalties may also influence estimated costs. Therefore, in addition to using the FEV teardown cost study, the committee also relied on its expertise, together with input from manufacturers and suppliers, to extend the range of cost estimates.
Eight-Speed Automatic Transmission versus Six-Speed Automatic Transmission
The FEV teardown cost study compared the ZF eight-speed 8HP70 automatic transmission with the ZF six-speed 6HP26 automatic transmission. The study noted that the eight-speed transmission implemented “a revolutionary gearing system.” It further noted that “many of the innovative ideas implemented into the eight-speed automatic could have been incorporated into a new six-speed if it were to be redesigned.” These differences will strongly influence the outcome of the teardown cost study.
Dual-Clutch Automatic Transmission versus Automatic Transmission
The foregoing reasons for variability of cost estimates apply equally to the DCT transmission. DCTs used by different manufacturers may also have different mechatronics for clutch and shift fork actuation. The actuation units can be electromechanical, electrohydraulic, or a mixture of both. The clutch modules also vary significantly among manufacturers, with some including a torsional damper and others relying on a damper in a separate dual mass flywheel. Therefore, one teardown cost estimate may not be representative of the entire fleet.
| 8-Speed versus 6-Speed Automatic Transmission Possible Incremental Cost Compared to EPA/FEV Teardown Cost Estimate of $61.84 for 2012 MY (2010 dollars) |
||
| Technology | DMC ($) | Source of Costs |
| Modified hydraulic control strategy, spool valve, material, friction discs (Defined in EPA/FEV Teardown Study – Components that may have been included in 8-speed AT, but not related to reduced losses for efficiency improvements). | 28 | EPA/FEV estimate of $138.19 for cost of clutches in 6 sp ATa 20% of 6 sp AT cost of clutches estimated for modifications |
| Solenoids with enhanced response times and flow control (For improved shift quality with more frequen shifts of 8 speed AT) | 23 | EPA/FEV estimate of $45.99 for electrical controls of DCTb 1/2 of electrical controls estimated for enhanced solenoids |
| Enhanced speed and pressure sensors (For improved shift quality with more frequent shifts of 8 sp AT) | 11 | EPA/FEV estimate of $45.99 for electrical controls of DCTb 1/4 of electrical controls estimated for enhanced sensors |
| Case modifications (magnesium replacing aluminum) (to prevent weight increase) | 32 | DOE: $4 per pound with magnesium replacing aluminumc Applied to 8 pounds saved. |
| Total incremental costs | 94 | |
| EPA/FEV estimated cost – 8-sp AT versus 6-sp ATd | 62 | |
| Totat direct manufacturing cost: 2012 MY cost in 2010 dollars | 156 | |
| DMC Learning Type 11, 2012 to 2025 Learning Factor = 0.74 | ||
| Total 2025 MY Direct Manufacturing Costs (2010 dollars) | 115 | |
a EPA/FEV (2010).
b EPA/FEV (2013).
c Powell et al. (2010).
d EPA/FEV (2011).
High-Efficiency Gearbox—Level 1 (HEG1), Level 2 (HEG2), and Level 3 (HEG3)
Effectiveness and Cost
Losses in automatic transmissions vary significantly, but the Ricardo (2011) analysis showed that a 2010 MY automatic transmission was approximately 90 percent efficient, so that the energy losses through the transmission were approximately 10 percent of the input energy. Since reducing these losses will be reflected directly in reduced fuel consumption, significant attention is being devoted to doing just that. Moreover, since technologies to reduce losses and improve transmission efficiency are being phased in primarily as new transmissions are being designed, two different levels of high-efficiency gearboxes were established to illustrate how these technologies might be phased in over time. In addition, a third level of a high efficiency gearbox was established as a technology that might be applicable beyond the 2025 MY. The reduction in losses, together with the accompanying reduction in fuel consumption and estimated 2017 costs (2010 dollars), are shown in Table 5.11. Appropriate learning factors were applied to the 2017 costs to derive the 2020 and 2025 costs. All of the technologies listed were discussed earlier in this chapter. The combination of HEG1 and HEG2 is shown to provide a slightly larger reduction in fuel consumption than NHTSA’s estimate for HETRANS, but at a higher cost. The combination of the TSD estimates together with the committee’s estimates resulted in the low and high most likely estimates for effectiveness and costs shown in Table 5.12.
Six- and Eight-Speed Dual-Clutch Transmissions
Effectiveness
The TSD indicates that a six-speed wet-clutch DCT transmission can provide a 3.4 to 3.8 percent reduction in fuel consumption relative to a six-speed conventional automatic transmission, based on the lumped parameter model. The NHTSA RIA indicates that a six-speed wet-clutch DCT can provide up to a 4.1 percent reduction in fuel consumption relative to a six-speed automatic transmission, and this value is used in NHTSA’s decision trees. The range of 3.0 to 4.0 percent reduction in fuel consumption was considered to be the appropriate range for the six-speed wet-clutch DCT relative to a six-speed automatic transmission. The effectiveness of the dry DCT was estimated to provide 0.5 percent further reduction in fuel consumption relative to a wet-clutch DCT due to the reduced parasitic losses incurred by not needing to provide oil flow to the clutches.
The NHTSA RIA implies that the eight-speed DCT transmission provides the same 4.6 percent reduction in fuel consumption relative to a six-speed DCT as an eight-speed
| Estimated Reduction in Losses (%) | Estimated Reduction in FC (%) | 2017 Incremental Direct Manufacturing Costs ($) | |||||||||||||||||
| High Efficiency Gearbox - Level 1 (HEG1) | |||||||||||||||||||
| Oil Supply | |||||||||||||||||||
| Low leakage valves and improved variable force solenoids | 0.3 | 35 | |||||||||||||||||
| Off-axis, chain driven, dual mode/variable displacement pump | 1.0 | 45 | |||||||||||||||||
| Drag Losses | 1.0 | 40 | |||||||||||||||||
| Grooved friction material | |||||||||||||||||||
| Wave spring separation of plates | |||||||||||||||||||
| More efficient seals and bearings | |||||||||||||||||||
| Total | 17 | 2.3 | 120 | ||||||||||||||||
| High Efficiency Gearbox - Level 2 (HEG2) | |||||||||||||||||||
| Oil Supply | |||||||||||||||||||
| Dual pumps | 1.0 | 45 | |||||||||||||||||
| Drag Losses | |||||||||||||||||||
| Rapid warm-up of oil | 0.8 | 54 | |||||||||||||||||
| Low friction synthetic AT fluid (improved cold temp. viscosity) | 0.5 | 50 | |||||||||||||||||
| Gearing Efficiency | |||||||||||||||||||
| Chemically superfinished gear teeth | 0.3 | 45 | |||||||||||||||||
| Total | 20 | 2.6 | 194 | ||||||||||||||||
| Overall (to 2025 MY) | 37 | 4.9 | 314 | ||||||||||||||||
| High-Efficiency Gearbox—Level 3 (HEG3) (after 2025) | |||||||||||||||||||
| Oil Supply | |||||||||||||||||||
| On-demand electric oil pump and electromechanical shifting | 1.6 | 150 | |||||||||||||||||
| Total | 12 | 1.6 | 150 | ||||||||||||||||
| Overall (to 2025 MY) | 49 | 6.5 | |||||||||||||||||
| High-Efficiency Gearbox (HEG) | NRC Estimated Most Likely Fuel Consumption Reduction (%)a | NHTSA Estimated Fuel Consumption Reduction (%)a | NRC Estimated Most Likely 2025 MY DMC Costs (2010$)a | NHTSA Estimated 2025 MY DMC Costs (2010$)a | |||||||||||||||
| HEG1 | 2.3 - 2.7 | 2.7b | 102 | N/A | |||||||||||||||
| HEG2 (HETRANS) | 2.6 - 2.7 | 2.7 | 165 | 163 | |||||||||||||||
| HEG1 + HEG2 | 4.9 - 5.4 | 267 | |||||||||||||||||
| HEG3 | 1.6 | N/A | 128 | N/A | |||||||||||||||
a Relative to baseline.
b Derivation: Subtract revised 1.9% effectiveness of 8AT from NHTSA’s 8AT effectiveness of 4.6%.
automatic transmission provides relative to a six-speed automatic transmission. The Autonomie vehicle simulation results shown in Table 5.13 indicate that the eight-speed DCT provides a 2.1 percent reduction in fuel consumption relative to a six-speed DCT with the same efficiency. A comparison at the same efficiency is appropriate, since the significant improvement in efficiency occurs when making the transition from a conventional automatic transmission to DCT. The committee’s low and high most likely effectiveness estimates are shown in Table 5.14.
| Fuel Consumption (L/100 km) | |||||||||||||||||||
| Conventional - DCT | FTP | HWFET | Combined | ||||||||||||||||
| 6-speed - 92% efficiency | 7.35 | 5.22 | 6.21 | ||||||||||||||||
| 8-speed - 92% efficiency | 7.23 | 5.09 | 6.08 | ||||||||||||||||
| Improvement (%) | 1.63 | 2.51 | 2.1 | ||||||||||||||||
| 8-speed - 92% efficiency | 7.23 | 5.09 | 6.08 | ||||||||||||||||
| 8-speed - 96% efficiency | 7.05 | 4.94 | 5.91 | ||||||||||||||||
| Improvement (%) | 2.49 | 3.04 | 2.78 | ||||||||||||||||
| Dual Clutch Transmissions (DCT) | NRC Estimated Most Likely Fuel Consumption Reduction (%)a | NHTSA Estimated Fuel Consumption Reduction (%)a | NRC Estimated Most Likely 2025 MY DMC Costs (2010 dollars)a | NHTSA Estimated 2025 MY DMC Costs (2010 dollars)a | |||||||||||||||
| 6-sp DCT vs. 6-sp AT | 3.5 - 4.5 | 4.1 | −127 to 26 | −127b | |||||||||||||||
| (dry clutch) | |||||||||||||||||||
| 6-sp DCT vs. 6-sp AT | 3.0 - 4.0 | 3.6 | −75 to 75 | −75c | |||||||||||||||
| (wet clutch) | |||||||||||||||||||
| 8-sp DCT vs. 6-sp DCT | 1.5 - 2.0 | 4.6d | 152 | 152 | |||||||||||||||
| (dry or wet) | |||||||||||||||||||
a Relative to baseline. Baseline 6-sp AT is Lepelletier type.
b NHTSA estimated cost of dry DCT is $61 less than wet DCT in 2017. Adjusting this difference by the learning factor (0.74/0.87) yields −$52. Adding -$52 to wet DCT cost of −$75 yields −$127.
c FEV teardown cost for 6-sp DCT was −$147. Adding correction of $50 yields −$97. Multiplying −$97 by 1.04 GDP factor and 0.74 learning factor yields −$75.
d Beneficial effects of HEG1, which appear to be included in the 4.6%, are not applicable to an 8-sp DCT from a 6-sp DCT.
Cost
The 2017-2025 TSD shows that a six-speed wet dual clutch transmission has an estimated 2007 direct manufacturing cost of −$147 (savings) relative to a six-speed conventional automatic transmission, based on the FEV teardown cost study (EPA/FEV 2011). Subsequent to this study, EPA and FEV issued a correction and adjusted the cost to −$97 (savings) (EPA/FEV 2013). The additional $50 cost was due to gear selecting solenoids and sensors, wiring harness, and communication drivers.
For the reasons cited in Box 5.2, an analysis of the EPA/FEV teardown cost study revealed that higher costs than those derived in the teardown study were possible. The committee’s analysis of possible incremental costs for a six-speed DCT transmission over the EPA/FEV teardown cost estimate of −$97 is shown in Table 5.15. The analysis shows that the costs could range from −$97 up to $101 (2007 dollars). Adjusting these costs to 2010 dollatrs (with the GDP factor of 1.04) and for learning yielded 2025 MY direct manufacturing costs for a six-speed wet clutch DCT ranging from −$75 to $75 (2010 dollars), as shown in Table 5.14.
Cost estimates for a six-speed dry DCT relative to a six-speed automatic transmission are also shown in Table 5.14. The 2007 cost difference of −$61 (savings) for the dry clutch DCT relative to the wet clutch DCT estimated by NHTSA was used to develop the committee’s cost estimates shown in Table 5.14.
The FEV teardown study of an eight-speed DCT from a six-speed DCT provided the cost shown in Table 5.16, which was used as the basis for the committee’s direct manufacturing cost estimate for the eight-speed DCT (EPA/FEV 2011). This cost was adjusted to 2010 dollars from 2007 dollars by applying the GDP multiplier. The appropriate learning factors were applied to derive the 2017, 2020, and 2025 costs, with the 2025 MY costs summarized in Table 5.14. These cost estimates are within the range of estimates contained in feedback the committee received from vehicle manufacturers and suppliers.
The committee found that the currently high costs of DCTs stem from the relatively low sales volumes, compounded by the fact that DCTs used by different vehicle manufacturers have different mechatronics for clutch and shift fork actuation. The actuation units can be electrome-
| 6-Speed DCT versus 6-Speed Automatic Transmission | ||
| Possible Incremental Cost over EPA/F EV Teardown Cost Estimate of −$97 for 2012 MY (2007 dollars) | ||
| Technology | DMC ($) | Source of Costs |
| Clutch modules - enhancements | 39 | Expert estimate - 25% increase over EPA/FEV estimate of $155.11 for clutch modules in 6-sp DCT |
| Synchronizers - cost increase due to complexity | 14 | Expert estimate - increase over EPA/FEV estimate of $14.35 for synchronizer cost in Geartrain Subsystem |
| Mechatronics for clutch and shift actuation - enhancements | 26 | Expert estimate - 25% increase over EPA/FEV estimate of $103.23 for Mechanical Controls Subsystem |
| Differential gears (added for same function as 6-sp AT) | 42 | EPA/FEV estimate of $42.01 for cost of differential gears in 6-sp AT added to 6-sp DCT |
| Torsional vibration damper | 45 | Expert estimate - Up to 50% of EPA/FEV estimate of $90.74 for cost of torque converter |
| Case | 32 | Increased to equal EPA/FEV estimate for 6-sp AT case |
| Total incremental costs | 198 | |
| EPA/FEV estimated cost – 6-sp DT versus 6-sp AT | −97 | |
| Total direct manufacturing cost: 2012 MY cost in 2007$ | 101 | |
| Adjusted to 2010$ | 105 | |
| DMC Learning Type 11, 2012 to 2025 Learning Factor = 0.74 | ||
| Total: 2025 MY Direct Manufacturing Cost (2010$) | 75 | |
| Technology | Direct Manufacturing Cost ($) | Comments |
| 8-sp DCT from 6-sp DCTa | 198 | FEV teardown cost study |
| Adjusted to 2010 dollars | 206 | 1.04 GDP Factor |
| Adjusted for Learning | ||
| 2017 | 179 | LF = 0.87 |
| 2020 | 167 | LF = 0.81 |
| 2025 | 152 | LF = 0.74 |
a 2007 dollars.
chanical, electrohydraulic, or a mixture of both. The clutch modules vary significantly. Although the main difference is between wet and dry clutch configurations, other differences include the use of torsional dampers, while others rely on a damper in the separate dual mass flywheel. Since the hardware components from one DCT to another can vary significantly, a large variation in costs can be expected. This large variation in hardware components is partly responsible for DCTs not achieving significant cost reductions at current production volumes.
A seven-speed DCT would have significantly better cost effectiveness than an eight-speed DCT. In order to upgrade from a six-speed to an eight-speed DCT, in addition to the additional gear pairs, the eight-speed DCT requires an additional synchronizer, shift rail and fork, actuator, and position sensor. However, to upgrade to a seven-speed DCT, the unused side of one of the synchronizers in the six-speed DCT can be used, thereby eliminating the cost of a new synchronizer, shift rail and fork, actuator, and position sensors. The additional costs would consist primarily of the added gear pair, needle bearing, and potentially larger transmission housing. By eliminating a portion of the costs for mechanical controls and reducing the gear system incremental costs by half, a seven-speed DCT may have an incremental cost of approximately $60 over a six-speed DCT.
Dual-Clutch Transmission – High-Efficiency Gearbox
DCTs generally use hydraulic power for actuating the clutches and the transmission actuators, resulting in signifi-
cant hydraulic losses. These losses can be reduced by replacing the hydraulic systems with electric motors for driving the clutches and the transmission shift fork actuators (Wagner et al. 2006). Although losses in a DCT are already significantly lower than a conventional automatic transmission, the electrically actuated DCT is expected to provide approximately 2 percent additional reduction in fuel consumption. The 2017 incremental direct manufacturing cost was estimated to be approximately $150, which becomes a 2025 cost of $127 (2010 dollars). The committee’s estimates of effectiveness and costs for the DCT with a high-efficiency gearbox are shown in Table 5.17.
Dual-Clutch Transmission with Torque Converter
The smooth launch performance provided by a torque converter-equipped planetary automatic transmission is very difficult to duplicate with DCTs. Parking lot maneuvers can be especially difficult without the smooth performance of a torque converter. This lack of smooth launch performance has prompted Honda to announce the development of an eight-speed DCT for the 2015 MY, which features the first use of a torque converter in a DCT in addition to retaining the dual clutches. This should provide the smooth low-speed driving dynamics of a traditional automatic transmission but with a gearbox that is more efficient. As an additional benefit, torque multiplication through the torque converter will improve acceleration from idle. Since DCT clutches have required the use of a more costly dual-mass flywheel, adding the torque converter is believed by Honda to be no more expensive overall since it eliminates the need for the dual mass flywheel. The committee’s low and high most likely estimates of effectiveness and costs for the DCT with a torque converter are shown in Table 5.17.
Torsional Vibration Damping
The torque generated by an internal combustion engine is not smooth over a single revolution of the engine; rather, it peaks at each cylinder firing. As the number of cylinders is reduced, the variation in torque over a revolution of the engine increases, reaching a worst case for three-cylinder engines. The high peak firing pressures of a diesel engine can further increase the variations in torque over a revolution of the engine. Torsional vibrations can lead to seat vibrations or noise at certain speeds, both of which reduce the comfort of the vehicle. Although an open torque converter diminishes the transfer of torque variations to the driveshaft, this capability is eliminated when the torque converter is locked up, which generally occurs during most operating conditions except for the initial launch of the vehicle from idle.
Torsional vibration damping mechanisms are generally applied to the torque converter and can consist of the following technologies:
- Turbine torsional damper: Applied to gasoline engine applications.
- Two-torsional damper system: Applied to four-cylinder gasoline and four- and six-cylinder diesel engines.
- Centrifugal pendulum absorber: Applied to three- and four-cylinder gasoline and three-, four-, and six-cylinder diesel engines.
Turbine torsional dampers are generally included in automatic transmissions with lockup torque converters. However, the cost of a two-torsional damper system could increase the cost of the torque converter by 20 percent, and the centrifugal pendulum absorber could increase the cost of the torque converter by 50 percent. These incremental costs need to be included in the transmission costs as turbocharged, downsized gasoline engines and diesel engines are applied to future vehicles. The unique costs for torsional vibration damping with dual clutch transmissions also need to be included in cost estimates.
Secondary Axle Disconnect
All-wheel-drive (AWD) vehicles continue to be popular, as shown by EPA’s forecast that 31.2 percent of all light-duty vehicles in the United States would have four-wheel-drive in 2014 (EPA 2014). These vehicles incur a fuel consumption penalty due to the losses associated with the additional rotating components. By disconnecting the secondary driven axle and driveshaft, the rotating losses in the bearings and seals can be eliminated. AWD vehicles generally consist of permanently connected front- and rear-drive axles. During normal driving conditions, the rear axle is spinning but contributing no power to the vehicle
| Dual-Clutch Transmission Variants (DCT) | NRC Estimated Most Likely Fuel Consumption Reduction (%)a | NHTSA Estimated Fuel Consumption Reduction (%)a | NRC Estimated Most Likely 2025 MY DMC Costs (2010$)a | NHTSA Estimated 2025 MY DMC Costs (2010$)a | |||||||||||||||
| DCT- HEG | 2.0 | NA | 127 | NA | |||||||||||||||
| DCT - Torque Converter | Same as DCT | NA | Same as DCT | NA | |||||||||||||||
a Relative to baseline.
propulsion. Significant energy is lost due to the friction in these drivelines.
The AWD disconnect clutch comprises a hydraulically-operated synchronizer clutch integrated in the input shaft on the power transfer unit (PTU) and an electrically operated dog clutch on the rear axle. An AWD disconnect clutch system allows the secondary axle and driveline branches to be disconnected from the primary axle. When used in connection with a rear axle disconnect, the secondary axle rotation can be stopped to eliminate the parasitic power losses. Disconnect systems consist of high-torque synchronizers that are energized with an electromagnetic actuator. The AWD disconnect clutch system was estimated by Schaeffler to offer up to 5 percent reduction in fuel consumption, which would provide an AWD vehicle with fuel consumption similar to that of a front wheel drive (FWD) vehicle (Lee 2010).
The NHTSA RIA estimates that a secondary axle disconnect system can provide a 1.4 percent reduction in fuel consumption. MY 2014 EPA certification fuel economy test data indicate that AWD vehicles have 3.8 to 7.2 percent higher fuel consumption than comparable non-AWD vehicles. If secondary axle disconnect systems could reduce the losses of the AWD system by 50 percent, the fuel consumption would be reduced by approximately 3 percent. The committee’s low and high most likely effectiveness estimates are shown in Table 5.18.
The TSD shows the 2017 direct manufacturing cost of a secondary axle disconnect system to be $78. Although details of this cost estimate were not provided, the description in the TSD suggests that the cost did not include the electrically operated dog clutch on the rear axle. Applying the $22 cost estimate for a one-way clutch from the FEV cost teardown study of a six- speed automatic transmission, the 2017 direct manufacturing cost of the secondary disconnect system is estimated to be $100 ($78 from the TSD plus $22 for the one-way clutch). The committee’s most likely direct manufacturing cost estimate is shown in Table 5.18.
FUEL CONSUMPTION REDUCTION TECHNOLOGIES NOT INCLUDED IN THE FINAL CAFE RULE ANALYSIS
Continuously Variable Transmission
NHTSA did not consider continuously variable transmissions (CVTs) in the TSD (2012) for the 2017-2025 rulemaking. However, EPA and NHTSA considered them in the TSD (2010) for the 2012-2016 rulemaking, which has been used together with other input to develop effectiveness and cost estimates. NHTSA estimated that a CVT could reduce fuel consumption by 2.2 to 4.5 percent relative to a four-speed automatic transmission. The committee contracted the University of Michigan to conduct a full system simulation that included replacing a six-speed automatic transmission with a CVT and found that the CVT provided a 1.2 percent reduction in fuel consumption. Combining this with a 2 percent effectiveness for a six-speed automatic transmission over a four-speed transmission indicates that the CVT could provide approximately 3.5 percent reduction in fuel consumption, which is within the range estimated by NHTSA. Some manufacturers’ estimates significantly exceeded NHTSA’s maximum range. This wide range of estimates is believed to reflect wide variations in losses in the CVT. The committee’s low and high most likely estimates of effectiveness for the CVT are shown in Table 5.19.
In the TSD for the 2012-2016 rulemaking, NHTSA also provided an estimated 2012 MY direct manufacturing cost of $200 (2007 dollars) for the CVT relative to a four-speed automatic transmission. This cost was within the ranges provided by manufacturers. By applying the gross domestic product (GDP) multiplier of 1.04 and type 12 learning factor, a 2025 MY direct manufacturing cost estimate of $154 was developed, as shown in Table 5.19.
High-Efficiency Gearbox
As described earlier, CVTs have had higher losses than automatic transmissions. Some estimates have indicated that CVT efficiencies may be approximately 89 percent, whereas an automatic transmission could range from 90 to 96 percent, depending on the extent of the high efficiency gearbox technologies incorporated. Similar to automatic transmissions, CVTs can benefit from a reduction in losses. Major power losses occur with the hydraulic pump and the belt, in approximately equal proportions. Pump losses have already been reduced in CVTs with marginal control of the hydraulic pressure that provides adequate clamping pressure for the pulleys while still having adequate reserve pressure required for rapid downshifts. Further reductions in pumping losses can be achieved with a variable displacement hydraulic pump or a dual cavity pump. Additional reductions can be achieved with an on-demand electric pump, by increasing the coefficient of friction between the pulley and belt, and
| Secondary Axle Disconnect | NRC Estimated Most Likely Fuel Consumption Reduction (%)a | NHTSA Estimated Fuel Consumption Reduction (%)a | NRC Estimated Most Likely 2025 MY DMC Costs (2010$)a | NHTSA Estimated 2025 MY (2010$s) DMC Costs (2010$)a | |||||||||||||||
| SAX | 1.4 - 3.0 | 1.4 | 86 | 66 | |||||||||||||||
a Relative to baseline. Baseline 6-sp AT is Lepelletier type.
by increasing the traction characteristics of the oil to reduce belt slip. Low friction coatings with high wear resistance may assist in reducing belt losses. Many of these areas are under development so effectiveness and costs are not well defined. However, these features have been estimated to reduce losses by approximately 20 to 25 percent, which would provide approximately a 3 percent reduction in fuel consumption. The higher efficiency CVT is estimated to include $50 for a variable displacement pump, an additional $35 for an on-demand electrically driven variable displacement pump and $40 for enhanced lubricants and low friction coatings with high wear resistance for an estimated 2017 direct manufacturing costs of $125, which becomes a 2025 cost of $107. The committee’s low and high most likely estimates of effectiveness and costs for the CVT with a high-efficiency gearbox are shown in Table 5.19.
Nine- and Ten-Speed Automatic Transmissions
As discussed earlier in this chapter, nine-speed transmissions are currently in production and several announcements have been made regarding future production of nine- and ten-speed automatic transmissions. However, increasing the number of ratios in a transmission will have a diminishing beneficial effect on fuel economy and may increase the losses within the transmission. Based on the increase in the number of ratios from eight to ten alone, the committee estimated that a ten-speed automatic transmission may provide approximately a 0.3 percent reduction in fuel consumption with an estimated incremental direct manufacturing cost in 2025 of $75 (2010 dollars).
ZF Friedrichshafen AG recently announced that it would not follow others who have announced ten-speed automatic transmissions (Greimel 2014). ZF announced that its offerings would be limited to nine speeds. The CEO of ZF, Stefan Sommer, said, “We came to a limit where we couldn’t gain any higher ratios. So the increase in fuel efficiency is very limited and almost eaten up by adding some weight and friction and even size of the transmission.”
Effect of Engine Technology on Effectiveness of Increasing Transmission Ratios
In this chapter, the estimates for effectiveness of transmissions with increased ratios are relative to a baseline, naturally aspirated engine with four valves per cylinder, fixed valve timing and lift, port fuel injection, and a four-speed automatic transmission, unless otherwise noted. As technologies are added to spark ignition engines, fuel consumption is not only reduced, but the lower fuel consumption levels cover a broader range of engine speeds and loads. As a result, the effectiveness of increasing the number of ratios in a transmission is diminished. For example, Chapter 8 shows that, using NHTSA’s methodology for synergies, the 5.0 percent effectiveness of a six-speed automatic transmission relative to a four-speed transmission applied a baseline, naturally aspirated engine is diminished to 1.6 percent when applied to an engine with additional fuel consumption technologies that include intake cam phasing, continuously variable valve lift, and turbocharging and downsizing to level 1. Likewise, the effectiveness of an eight-speed automatic transmission was reduced by 15 percent when added to a similar engine with additional fuel reduction technologies. As described in Chapter 8, similar results were found in full system simulations conducted by the University of Michigan. As engines incorporate more new technologies to reduce fuel consumption, the benefits of increasing transmission ratios or switching to a CVT diminishes.
Control systems, models, and simulation techniques are enablers for many of the transmission technologies to reduce fuel consumption discussed in this chapter and previously highlighted in the discussion of spark ignition engine controls in Chapter 2. The function of early electronic controls for transmissions was gear shift scheduling as a function of accelerator pedal or throttle angle and vehicle speed (Kiencke and Nielsen 2000). The added flexibility of electronic scheduling over hydraulic controls provided opportunities to optimize the shift scheduling for multiple requirements, including optimized performance and fuel economy. Shift scheduling controls are also influenced by engine and vehicle conditions
| Continuously Variable Transmission (CVT) | NRC Estimated Most Likely Fuel Consumption Reduction (%)a | NHTSA Estimated Fuel Consumption Reduction (%)a | NRC Estimated Most Likely 2025 MY DMC Costs (2010$)a | NHTSA Estimated 2025 MY DMC Costs (2010$)a | |||||||||||||||
| CVT from 4-sp AT | 3.5 - 4.5 | 2.2 - 4.5b | 154 | 154b | |||||||||||||||
| HEG - CVT | 3.0 | NA | 107 | NA | |||||||||||||||
a Relative to baseline.
b From 2012-2016 TSD.
as well as engine limitations, as shown in Figure 5.30, so that communication links are required between transmission and engine controllers unless the transmission control is integrated within the engine controller, as is the case for some manufacturers (Bai et al. 2013; Guzzella and Sciarretta 2007). The next advancement provided control of some hydraulic pressures to provide smoother engagements of clutches for improved customer satisfaction.
As the number of gears or ratios increased in transmissions, the complexity of the electronic controller, the number of sensor inputs and controller outputs, the software algorithms, the calibration parameters, and memory requirements increased at a faster rate. This nonlinear increase in control requirements as a result of the increase in number of gears or ratios over time is illustrated in Figure 5.31. This graph shows that an eight-speed automatic transmission requires 2 megabytes of read-only memory (ROM) consisting of algorithms, lookup tables, and calibration parameters. Progressing to a nine-speed transmission incurs a nonlinear increase to 3.5 megabytes of ROM.
Migrating from conventional automatic transmissions to dual clutch transmissions has been shown in this chapter
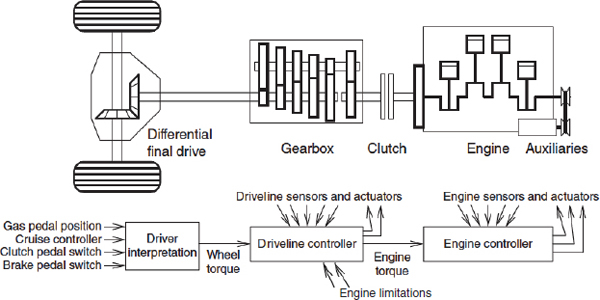
FIGURE 5.30 Schematic of signal flow and coordination between engine controller and driveline controller for gear ratio selection and clutch control.
SOURCE: Modified Figure 3.8 from Eriksson and Nielsen (2014). Reprinted with permission.
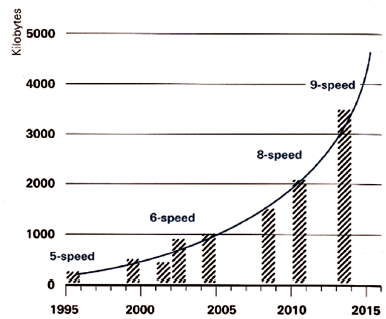
FIGURE 5.31 Increase in ROM requirements in transmission control units as a result of the increase in number of gears or ratios over time.
SOURCE: ZF Friedrichshafen AG (2013).
to provide significant reductions in fuel consumption. One of the enablers for DCT transmissions was the increased capability of the electronic controllers with high-data-rate signal processing. High-data-rate signal processing is used during the engagement and release of the clutches in a DCT transmission. To ensure smooth shift events, clutch pressures are modulated to ensure that the oncoming and offgoing target shaft speeds are achieved through utilization of either an adaptive learning system or a closed-loop control with high-data-rate feedback of shaft speeds. Direct feedback control of clutch pressures has also been found to provide improvements in shift smoothness in conventional automatic transmissions together with possible hardware simplifications; as a result, it is being applied to some conventional transmissions.
As discussed earlier, deficiencies in providing effective, smooth, and reliable clutch control in some early introductions of dual dry clutch transmissions were the underlying reason for drivability and warranty complaints (Vasca et al. 2011). These deficiencies result from the difficulty in developing an accurate and computationally efficient model of the relationship between the pressure applied by the clutch actuator or the actuator position and the torque transmitted through the clutch during the engagement phase (Zoppi et al. 2013; Oh and Choi 2014). This model-based predictive control methodology must accurately account for the slip-speed-dependent friction to ensure precise regulation of the slip acceleration during the lock-up phase in order to satisfy multiple objectives of low friction losses, minimum time for engagement, and driver comfort (Garofalo et al. 2001).
Although transmission control methodologies have been successfully developed and implemented to address quantifiable metrics such as reduction in fuel consumption or undesirable driveline oscillations, drivability metrics that relate to driver comfort and satisfaction are continuing to be developed (Kim et al. 2007). Applying limits to metrics such as vibration dose value (VDV)4 or metrics related to the first derivative (acceleration) and second derivative (jerk) of vehicle velocity have led to significantly improved shift quality (Dorey and Holmes 1999). Limits on the number of shift events per unit time and the time between shift events may be used for real-time fuel economy optimization, but when the driver’s perception does not correlate with the chosen limits, recalibration may be necessary to provide for the driver’s comfort (Bai et al. 2013; Ngo et al. 2013). Other metrics in addition to those related to transmission shift quality may be needed to ensure that discontinuous powertrain functions, which occur with stop-start systems, multimode combustion switches with HCCI, and hybrid electric powertrains, can be provided while continuing to provide for the driver’s comfort. Research by engineers, psychologists, and market analysts is continuing to be directed toward defining relationships that will ensure driver comfort during all modes of driving (Dorey and Holmes 1999; Skippon 2014). As transmission design and controls mature, the drivability and consumer acceptance issues associated with transmission designs having low market penetration are likely to be improved with advancements in computer simulations, modeling, control systems, and hardware designs.
As new transmission and engine technologies are incorporated in future powertrains, control of these powertrains will continue to focus on maximizing the reduction in fuel consumption. The increasing number of variables in the engine control, as discussed in Chapter 2, combined with the increasing number of variables in the transmission control, will require the continued application of optimization techniques to minimize fuel consumption and emissions while providing the performance and comfort expected by the driver.
Finding 5.1 New eight-, nine-, and ten-speed automatic transmissions are being introduced to replace six-speed automatic transmissions, which are currently dominant in light-duty vehicles. As transmissions trend towards higher numbers of gear ratios and ratio spreads, diminishing benefits for fuel consumption reductions are anticipated, which may be in the range of an additional 2 percent reduction. Studies have found that only minimal reductions in fuel consumption can be achieved beyond seven gear ratios. The benefits from parasitic loss reduction technologies, generally applied as new transmissions are introduced, can exceed the benefits from increasing the number of gear ratios and are reflected in the fuel consumption reductions achieved with these new transmissions.
Finding 5.2 Parasitic losses in typical transmissions are approximately 10 percent of the input energy, so that for a 15 percent reduction in these losses, a 2 percent reduction in fuel consumption could be expected. Reducing parasitic losses is focused on the oil supply system, drag torque resulting from clutches, bearings and seals, and gear losses. Fuel consumption reductions of approximately 5 percent, resulting from a 35 to 40 percent reduction in losses, may be possible by 2025. Opportunities may be available for further reductions in losses beyond 2025.
_____________
4 Vibration dose value (VDV), used to assess intermittent vibration, is a cumulative measurement of the vibration level received over a specific period of time, such as a transmission shift event. It is preferred for cases where vibration may vary and be intermittent. The VDV formula uses the RMS acceleration raised to the fourth power and is known as the Root-mean quad method. This technique ensures that VDV is more sensitive to the peaks in the acceleration levels.
![]()
where VDV is the vibration dose value in m/s1.75,
a(t) is the frequency-weighted acceleration in m/s2, and
T is the total measurement period in seconds.
SOURCE: Gracey & Associates (n.d.).
Finding 5.3 As engines incorporate new technologies to improve fuel consumption, including variable valve timing and lift, direct injection, and turbocharging and downsizing, the benefits of increasing transmission ratios or switching to a CVT diminish. As the engine efficiency map improves, the penalty of having larger ratio steps between gears is significantly reduced compared to a naturally aspirated engine. The benefit of an eight-speed transmission over a six-speed transmission is reduced by approximately 15 percent when added to a modestly turbocharged, downsized engine compared to a naturally aspirated engine. However, the full benefits of parasitic loss reduction technologies (HEG) are still available.
Finding 5.4 Although dual-clutch transmissions can provide a 3.5 to 4.5 percent reduction in fuel consumption relative to conventional automatic transmissions, they are not likely to reach the high penetration rates predicted by EPA/NHTSA in the U.S. market. This is primarily due to customer acceptance issues stemming from dry-clutch DCTs with drivability that is different from that of conventional automatic transmissions. With fewer than NHTSA’s anticipated applications of DCTs, other possibly less cost effective technologies will need to be introduced to compensate for the loss of the fuel consumption reduction benefits of widely applied DCTs. DCTs currently incur a modest cost increase over conventional, automatic transmissions, but costs could theoretically be as low as a conventional automatic transmission if high volumes were to be realized. Improved customer acceptance may be possible in the future with either wet clutch DCTs or dry clutch DCTs with a torque converter.
Recommendation 5.1 NHTSA and EPA should update the analyses of technology penetration rates for the midterm review to reflect the anticipated low DCT penetration rate in the U.S. market.
Finding 5.5 As the number of cylinders in the engine is reduced with downsizing and turbocharging, the variation in torque over a revolution of the engine increases, reaching a worst case for three-cylinder engines. These torsional vibrations can lead to seat vibrations or noise at certain speeds, both of which reduce the comfort of the vehicle. A variety of torsional vibration damping mechanisms can be added to the torque converter, but the cost of the torque converter could increase by as much as 50 percent. Additional mechanisms are expected to be required for torsional vibration damping with dual clutch transmissions. The cost of torsional damping systems needs to be included in transmission cost analyses.
Finding 5.6 The penetration of CVTs is increasing in the United States, and EPA estimated that CVT market share would reach 19.3 percent in 2014. The continuous variation in ratios provided by a CVT allows the engine to operate at its most efficient condition for the power level required. Several 2014 MY vehicles with CVTs are among the vehicles with high fuel economy ratings. The disadvantage of CVTs is that they have higher losses than conventional automatic transmissions; however, like conventional automatic transmissions, CVTs can benefit from a reduction in losses with increased costs.
Recommendation 5.2 NHTSA and EPA should add the CVT to the list of technologies applicable for the 2017-2025 CAFE standards.
Finding 5.7 Secondary axle disconnect systems are important since all-wheel-drive vehicles continue to be popular, with an estimated 31.2 percent of all light-duty vehicles in the United States having four wheel drive in 2014. If secondary axle disconnect systems could reduce the losses of the AWD system by 50 percent, fuel consumption reductions of up to 3 percent are expected.
Bai, S., J. Maguire, and H. Peng. 2013. Dynamic Analysis and Control System Design of Automatic Transmissions. SAE International.
Baillie, C., B. Campbell, K. Govindswamy, and D. Tomazic. 2014. Advances in Parasitic Loss Reduction for Various Transmission Architectures. FEV North America, Inc. Presentation prepared for 8th International CTI Symposium, Rochester, MI.
Brain, M. 2000. How Manual Transmissions Work. http://auto.howstuffworks.com/transmission4.htm.
Carney, D. 2014. Honda’s new 8-speed DCT uses a Torque Converter. SAE Automotive Engineering Magazine, August 6.
Daimler. 2013. New Nine-Speed Automatic Transmission debuts in the Mercedes-Benz E350 Blue Tec: Premier of the new 9G-Tronic. Daimler, July 24. http://media.daimler.com/dcmedia/0-921-1553299-1-1618134-1-0-1-0-0-0-0-1549054-0-1-0-0-0-0-0.html.
Dana Holding Corp. 2014. Dana Advances Development of VariGlide™ Continously Variable Planetary Technology. PR Newswire, May 19. http://www.prnewswire.com/news-releases/dana-advances-development-of-variglide-continuously-variable-planetary-technology-259791981.html.
Dick, A., J. Greiner, A. Locher, and F. Jauch. 2013. Optimization Potential for a State of the Art 8-Speed AT. SAE 2013-01-1272.
DOE (Department of Energy). 2014. Where the Energy Goes: Gasoline Vehicles. http://www.fueleconomy.gov/feg/atv.shtml. Accessed November 2, 2014.
Dorey, R., and C.B. Holmes. 1999. Vehicle Driveability – Its Characterisation and Measurement. SAE Technical Paper 1999-01-0949. doi:10.4271/1999-01-0949.
Eckl, B., and D. Lexa. 2012. How Many Gears do the Markets Need? GETRAG. International CTI Symposium, Berlin, Germany, December.
EPA (Environmental Protection Agency). 2014. Light-Duty Automotive Technology, Carbon Dioxide Emissions and Fuel Economy Trends, 1975 through 2014, October. EPA-420-R-14-023.
EPA/FEV. 2010. Light-Duty Technology Cost Analysis, Report on Additional Case Studies. U.S. Environmental Protection Agency, EPA-420-R-10-010, April.
EPA/FEV. 2011. Light-Duty Vehicle Technology Cost Analysis, Advanced 8- Speed Transmissions. U.S. Environmental Protection Agency, EPA-420-R-11-022, October.
EPA/FEV. 2013. Light-Duty Technology Cost Analysis, Report on Additional Case Studies – revised Final Report. U.S. Environmental Protection Agency, EPA-420-R-13-008, April.
EPA/NHTSA. 2010. Joint Technical Support Document: Rulemaking to Establish Light –Duty Vehicles Greenhouse Gas Emission Standards and Corporate Average Fuel Economy Standards, April.
EPA/NHTSA. 2012. Joint Technical Support Document, Final Rulemaking 2017-2025 Light-Duty Greenhouse Gas Emission Standards and Corporate Average Fuel Economy Standards. EPA-420-R-12-901.
Eriksson, L., and L. Nielsen. 2014. Modeling and Control of Engines and Drivelines (Automotive Series). John Wiley & Sons, SAE International, April.
Garofalo, F., L. Glielmo, L. Iannelli, and F. Vasca. 2001. Smooth Engagement for Automotive Dry Clutch. Proceedings of the 40th IEEE Conference on Decision and Control, Orlando, Florida, December: 529-534.
Gartner, L., and M. Ebenhock. 2013. The ZF automatic transmission 9HP48 transmission system, design and mechanical parts. SAE Int. J. Passeng. Cars - Mech. Syst. 6(2): 908-917. doi:10.4271/2013-01-1276.
Govindswamy, K., C. Baillie, and T. D’Anna. 2013. Choosing the Right Transmission Architecture Considering Customer Acceptance. SAE Int. Webinar, September 18.
Gracey & Associates. n.d. Vibration Dose: Definitions, Terms, Units and Parameters. Acoustic Glossary. http://www.acoustic-glossary.co.uk/vibration-dose.htm.
Greimel, H. 2014. ZF CEO: We’re not chasing 10-speeds. Automotive News, November 23.
Guzzella, L., and A. Sciarretta A. 2007. Vehicle Propulsion Systems: Introduction to Modeling and Optimization, Third Edition. Springer.
Healey, J., and C. Woodyard. 2013. GM, Ford to jointly develop 10-speed transmissions. USA Today, April 15.
Kiencke, U., and L. Nielsen. 2000. Automotive Control Systems. Springer, SAE International.
Kim, D., H. Peng, S. Bai, and J.M. Maguire. 2007. Control of integrated powertrain with electronic throttle and automatic transmission. IEEE Transactions on Control Systems Technology 15(3), May.
Lee, B. 2010. All-Wheel Drive Disconnect Clutch System. Schaeffler SYMPOSIUM 2010: 360-64. http://www.schaeffler.com/remotemedien/media/_shared_media/08_media_library/01_publications/schaeffler_2/symposia_1/downloads_11/Schaeffler_Kolloquium_2010_27_en.pdf.
Martin, K. 2012. Transmission Efficiency Developments. SAE Transmission and Driveline Symposium: Competition for the Future, October 17-18. Detroit, Michigan.
Moawad, A., and A. Rousseau. 2012. Impact of Transmission Technologies on Fuel Efficiency – Final Report. DOE HS 811 667, August.
Ngo, V.-D., A. Jose, C. Navarrete, T. Hofman, M. Steinbuch, and A. Serrarens. 2013. Optimal gear shift strategies for fuel economy and driveability. Proc. IMechE Part D, Journal of Automobile Engineering 227(10): 1398-1413, October.
Noles, J. 2013. Development of Transmission Fluids Delivering Improved Fuel Efficiency by Mapping Transmission Response to Viscosity and Additive Changes. Presentation at the SAE Transmission & Driveline Symposium, Troy, Michigan, October 16-17. http://www.sae.org/events/ctf/2013/2013_ctf_guide.pdf.
NSK Europe. 2014. New Low-Friction TM-Seal for Automotive Transmissions. http://www.nskeurope.com/cps/rde/dtr/eu_en/nsk_innovativeproduct_IP-E-2066.pdf.
Oh, J., and S. Choi. 2014. Real-time Estimation of Transmitted Torque on Each Clutch for Ground Vehicles with Dual Clutch Transmissions. IEEE/ASME Transactions on Mechatronics, February.
Powell, B., J. Quinn, W. Miller, J. Allison, J. Hines and R. Beals. Magnesium Replacement of Aluminum Cast Components in a Production V6 Engine to Effect Cost-Effective Mass Reduction. http://energy.gov/sites/prod/files/2014/03/f8/deer10_powell.pdf. Accessed April 13, 2015.
Ricardo, Inc. 2011. Computer Simulation of Light-Duty Vehicle Technologies for Greenhouse Gas Emission Reduction in the 2020-2025 Timeframe. U.S. Environmental Protection Agency, EPA-420-R-11-020.
Sherman, D. 2013. CVT Transmissions. Car and Driver, December. http://www.caranddriver.com/features/how-cvt-transmissions-are-getting-their-groove-back-feature.
Shidore, N. et. al. 2014. Impact of Advanced Technologies on Engine Targets. Project VSS128, DOE Merit Review, June.
Shulver, D. 2013. Reduced Fuel Consumption Enabled by Optimized Transmission Pump Technology. Presentation at the SAE Transmission & Driveline Symposium, Troy, Michigan, October 16-17. http://www.sae.org/events/ctf/2013/2013_ctf_guide.pdf.
Skippon, S.M. 2014. How consumer drivers construe vehicle performance: Implications for electric vehicles. Transportation Research Part F: Traffic Psychology and Behaviour 23: 15-31.
Vasca, F., L. Iannelli, A. Senatore, and G. Reale. 2011. Torque transmissibility assessment for automotive dry clutch engagement. IEEE/ASME Transactions on Mechatronics 16(3): 564-573, June.
Wagner, U., R. Berger, M. Ehrlich, and M. Homm. 2006. Electromotoric Actuators for Double Clutch Transmissions. Proceedings of the 8th LuK Symposium.
ZF. 2013. Motion and Mobility. ZF Corporate Report. Friedrichshafen, Germany.
Zoppi, M., C. Cervone, G. Tiso, and F. Vasca. 2013. Software in the Loop Model and Decoupling Control for Dual Clutch Automotive Transmissions. 3d International Conference on Systems and Control, Algiers, Algeria, October.
| Technologies | Midsize Car I4 DOHC | Large Car V6 DOHC | Large Light Truck V8 OHV | ||||||||||||||||
| Transmission Technologies | Abbreviation | Most Likely | Most Likely | Most Likely | Relative To | ||||||||||||||
| NHTSA Technologies | |||||||||||||||||||
| Improved Auto. Trans. Controls/Externals (ASL-1 & Early TC Lockup) | IATC | 2.5 - 3.0 | 2.5 - 3.0 | 2.5 - 3.0 | 4 sp AT | ||||||||||||||
| 6-speed AT with Improved Internals - Lepelletier (Rel to 4 sp AT) | NUATO-L | 2.0 - 2.5 | 2.0 - 2.5 | 2.0 - 2.5 | IATC | ||||||||||||||
| 6-speed AT with Improved Internals - Non-Lepelletier (Rel to 4 sp AT) | NUATO-NL | 2.0 - 2.5 | 2.0 - 2.5 | 2.0 - 2.5 | IATC | ||||||||||||||
| 6-speed Dry DCT (Rel to 6 sp AT - Lepelletier) | 6DCT-D | 3.5 - 4.5 | 3.5 - 4.5 | N/A | 6 sp AT | ||||||||||||||
| 6-speed Wet DCT (Rel to 6 sp AT - Lepelletier) (0.5% less than Dry Clutch) | 6DCT-W | 3.0 - 4.0 | 3.0 - 4.0 | 3.0 - 4.0 | 6 sp AT | ||||||||||||||
| 8-speed AT (Rel to 6 sp AT - Lepelletier) | 8AT | 1.5 - 2.0 | 1.5 - 2.0 | 1.5 - 2.0 | Previous Tech | ||||||||||||||
| 8-speed DCT (Rel to 6 sp DCT) | 8DCT | 1.5 - 2.0 | 1.5 - 2.0 | 1.5 - 2.0 | Previous Tech | ||||||||||||||
| High-Efficiency Gearbox Level 1 (Auto) (HETRANS) | HEG1 | 2.3 - 2.7 | 2.3 - 2.7 | 2.3 - 2.7 | Previous Tech | ||||||||||||||
| High-Efficiency Gearbox Level 2 (Auto, 2017 and Beyond) | HEG2 | 2.6 - 2.7 | 2.6 - 2.7 | 2.6 - 2.7 | Previous Tech | ||||||||||||||
| Shift Optimizer (ASL-2) | SHFTOPT | 0.5 - 1.0 | 0.5 - 1.0 | 0.5 - 1.0 | Previous Tech | ||||||||||||||
| Secondary Axle Disconnect | SAX | 1.4 - 3.0 | 1.4 - 3.0 | 1.4 - 3.0 | Baseline | ||||||||||||||
| Other Technologies | |||||||||||||||||||
| Continuously Variable Transmission with Improved internals (Rel to 6 sp AT) | CVT | 3.5 - 4.5 | 3.5 - 4.5 | N/A | Previous Tech | ||||||||||||||
| High-Efficiency Gearbox (CVT) | CVT-HEG | 3.0 | 3.0 | N/A | Previous Tech | ||||||||||||||
| High-Efficiency Gearbox (DCT) | DCT-HEG | 2.0 | 2.0 | 2.0 | Previous Tech | ||||||||||||||
| High-Efficiency Gearbox Level 3 (Auto, 2020 and beyond) | HEG3 | 1.6 | 1.6 | 1.6 | Previous Tech | ||||||||||||||
| 9-10 speed Transmission (Auto, Rel to 8 sp AT) | 10SPD | 0.3 | 0.3 | 0.3 | Previous Tech | ||||||||||||||
| Technologies | Midsize Car I4 DOHC | Large Car V6 DOHC | Large Light Truck V8 OHV | ||||||||||||||||
| Transmission Technologies | Abbreviation | Most Likely | Most Likely | Most Likely | Relative To | ||||||||||||||
| NHTSA Technologies | |||||||||||||||||||
| Improved Auto. Trans. Controls/Externals (ASL-1 & Early TC Lockup) | IATC | 50 | 50 | 50 | Baseline 4 sp AT | ||||||||||||||
| 6-speed AT with Improved Internals - Lepelletier (Rel to 4 sp AT) | NUATO-L | -13 | -13 | -13 | IATC | ||||||||||||||
| 6-speed AT with Improved Internals - Non-Lepelletier (Rel to 4 sp AT) | NUATO-NL | 195 | 195 | 195 | IATC | ||||||||||||||
| 6-speed Dry DCT (Rel to 6 sp AT - Lepelletier) | 6DCT-D | -149 to 31 | -149 to 31 | N/A | 6 sp AT | ||||||||||||||
| 6-speed Wet DCT (Rel to 6 sp AT - Lepelletier) | 6DCT-W | -88 to 88 | -88 to 88 | -88 to 88 | 6 sp AT | ||||||||||||||
| 8-speed AT (Rel to 6 sp AT - Lepelletier) | 8AT | 56 - 151 | 56 - 151 | 56 - 151 | Previous Tech | ||||||||||||||
| 8-speed DCT (Rel to 6 sp DCT) | 8DCT | 179 | 179 | 179 | Previous Tech | ||||||||||||||
| High-Efficiency Gearbox Level 1 (Auto) (HETRANS) | HEG1 | 120 | 120 | 120 | Previous Tech | ||||||||||||||
| High-Efficiency Gearbox Level 2 (Auto, 2017 and Beyond) | HEG2 | 194 | 194 | 194 | Previous Tech | ||||||||||||||
| Shift Optimizer (ASL-2) | SHFTOPT | 26 | 26 | 26 | Previous Tech | ||||||||||||||
| Secondary Axle Disconnect | SAX | 100 | 100 | 100 | Baseline | ||||||||||||||
| Other Technologies | |||||||||||||||||||
| Continuously Variable Transmission with Improved internals (Rel to 6 sp AT) | CVT | 179 | 179 | N/A | Baseline | ||||||||||||||
| High-Efficiency Gearbox (CVT) | CVT-HEG | 125 | 125 | N/A | Baseline | ||||||||||||||
| High-Efficiency Gearbox (DCT) | DCT-HEG | 150 | 150 | 150 | Baseline | ||||||||||||||
| High-Efficiency Gearbox Level 3 (Auto, 2020 and Beyond) | HEG3 | 150 | 150 | 150 | Baseline | ||||||||||||||
| 9-10 speed Transmission (Auto, Rel to 8 sp AT) | 10SPD | 75 | 75 | 75 | Baseline | ||||||||||||||
| Technologies | Midsize Car I4 DOHC | Large Car V6 DOHC | Large Light Truck V8 OHV | ||||||||||||||||
| Transmission Technologies | Abbreviation | Most Likely | Most Likely | Most Likely | Relative To | ||||||||||||||
| NHTSA Technologies | |||||||||||||||||||
| Improved Auto. Trans. Controls/Externals (ASL-1 & Early TC Lockup) | IATC | 46 | 46 | 46 | Baseline 4 sp AT | ||||||||||||||
| 6-speed AT with Improved Internals - Lepelletier (Rel to 4 sp AT) | NUATO-L | -12 | -12 | -12 | IATC | ||||||||||||||
| 6-speed AT with Improved Internals - Non-Lepelletier (Rel to 4 sp AT) | NUATO-NL | 181 | 181 | 181 | IATC | ||||||||||||||
| 6-speed Dry DCT (Rel to 6 sp AT - Lepelletier) | 6DCT-D | -138 to 28 | -138 to 28 | N/A | 6 sp AT | ||||||||||||||
| 6-speed Wet DCT (Rel to 6 sp AT - Lepelletier) | 6DCT-W | -82 to 82 | -82 to 82 | -82 to 82 | 6 sp AT | ||||||||||||||
| 8-speed AT (Rel to 6 sp AT - Lepelletier) | 8AT | 52 - 126 | 52 - 126 | 52 - 126 | Previous Tech | ||||||||||||||
| 8-speed DCT (Rel to 6 sp DCT) | 8DCT | 167 | 167 | 167 | Previous Tech | ||||||||||||||
| High-Efficiency Gearbox Level 1 (Auto) (HETRANS) | HEG1 | 113 | 113 | 113 | Previous Tech | ||||||||||||||
| High-Efficiency Gearbox Level 2 (Auto, 2017 and Beyond) | HEG2 | 183 | 183 | 183 | Previous Tech | ||||||||||||||
| Shift Optimizer (ASL-2) | SHFTOPT | 24 | 24 | 24 | Previous Tech | ||||||||||||||
| Secondary Axle Disconnect | SAX | 94 | 94 | 94 | Baseline | ||||||||||||||
| Other Technologies | |||||||||||||||||||
| Continuously Variable Transmission with Improved internals (Rel to 6 sp AT) | CVT | 168 | 168 | NA | Baseline | ||||||||||||||
| High-Efficiency Gearbox (CVT) | CVT-HEG | 117 | 117 | NA | Baseline | ||||||||||||||
| High-Efficiency Gearbox (DCT) | DCT-HEG | 141 | 141 | 141 | Baseline | ||||||||||||||
| High-Efficiency Gearbox Level 3 (Auto, 2020 and beyond) | HEG3 | 141 | 141 | 141 | Baseline | ||||||||||||||
| 9-10 speed Transmission (Auto, Rel to 8 sp AT) | 10SPD | 71 | 71 | 71 | Baseline | ||||||||||||||
| Technologies | Midsize Car I4 DOHC | Large Car V6 DOHC | Large Light Truck V8 OHV | ||||||||||||||||
| Transmission Technologies | Abbreviation | Most Likely | Most Likely | Most Likely | Relative To | ||||||||||||||
| NHTSA Technologies | |||||||||||||||||||
| Improved Auto. Trans. Controls/Externals (ASL-1 & Early TC Lockup) | IATC | 42 | 42 | 42 | Baseline 4 sp AT | ||||||||||||||
| 6-speed AT with Improved Internals - Lepelletier (Rel to 4 sp AT) | NUATO-L | -11 | -11 | -11 | IATC | ||||||||||||||
| 6-speed AT with Improved Internals - Non-Lepelletier (Rel to 4 sp AT) | NUATO-NL | 165 | 165 | 165 | IATC | ||||||||||||||
| 6-speed Dry DCT (Rel to 6 sp AT - Lepelletier) | 6DCT-D | -127 to 26 | -127 to 26 | N/A | 6 sp AT | ||||||||||||||
| 6-speed Wet DCT (Rel to 6 sp AT - Lepelletier) | 6DCT-W | -75 to 75 | -75 to 75 | -75 to 75 | 6 sp AT | ||||||||||||||
| 8-speed AT (Rel to 6 sp AT - Lepelletier) | 8AT | 47 - 115 | 47 - 115 | 47 - 115 | Previous Tech | ||||||||||||||
| 8-speed DCT (Rel to 6 sp DCT) | 8DCT | 152 | 152 | 152 | Previous Tech | ||||||||||||||
| High-Efficiency Gearbox Level 1 (Auto) (HETRANS) | HEG1 | 102 | 102 | 102 | Previous Tech | ||||||||||||||
| High-Efficiency Gearbox Level 2 (Auto, 2017 and Beyond) | HEG2 | 165 | 165 | 165 | Previous Tech | ||||||||||||||
| Shift Optimizer (ASL-2) | SHFTOPT | 22 | 22 | 22 | Previous Tech | ||||||||||||||
| Secondary Axle Disconnect | SAX | 86 | 86 | 86 | Baseline | ||||||||||||||
| Other Technologies | |||||||||||||||||||
| Continuously Variable Transmission with Improved internals (Rel to 6 sp AT) | CVT | 154 | 154 | NA | Baseline | ||||||||||||||
| High-Efficiency Gearbox (CVT) | CVT-HEG | 107 | 107 | NA | Baseline | ||||||||||||||
| High-Efficiency Gearbox (DCT) | DCT-HEG | 127 | 127 | 127 | Baseline | ||||||||||||||
| High-Efficiency Gearbox Level 3 (Auto, 2020 and beyond) | HEG3 | 128 | 128 | 128 | Baseline | ||||||||||||||
| 9-10 speed Transmission (Auto, Rel to 8 sp AT) | 10SPD | 65 | 65 | 65 | Baseline | ||||||||||||||


