
Full System Simulation Modeling of Fuel Consumption Reductions
This appendix provides additional details of the University of Michigan’s Department of Mechanical Engineering (referred to as U of M throughout this section) project using full system simulation modeling to analyze the effects of fuel consumption reduction technologies (Middleton 2015).
VEHICLE SPECIFICATIONS
Vehicle specifications for the modeling are shown in Table X.1. For all configurations the vehicle test weight, rolling resistance, and drag characteristics were held constant at the values noted in the table. These are representative of a midsize car similar to a 2012 Ford Fusion.
COMBINATIONS OF POWERTRAIN TECHNOLOGIES
The specific combinations of powertrain technologies evaluated are shown in Table X.2.
FULL SYSTEM SIMULATION MODEL CALIBRATION
Calibration and setup of the model were the first tasks undertaken. In Task 1 the model parameters for flame speed, knock limits, and breathing were determined based on detailed dynamometer data for a 2.0L boosted GDI engine (GM- LNF). These parameters were held constant for all subsequent simulations. Engine friction values were determined by fitting the standard Chen-Flynn model to the data and adding a constant auxiliary power requirement for the fuel injection system. Validation of the baseline engine/vehicle model was accomplished in Task 3. For this, the Task 1 engine geometry was modified to simulate the baseline engine, a naturally aspirated (NA) 2.5L engine with PFI and dual cam phasing (DCP). After optimizing the cam phasing strategy, the resulting engine map was then exercised in the base vehicle over the prescribed drive cycles with appropriate transmission and rear axle ratio. With minimal parameter adjustments the results compared favorably to the EPA certification test data for a 2012 MY Ford Fusion
TABLE X.1 Vehicle Specifications
| Vehicle Attribute | Value |
| Test Weight | 3,625 lb (1648 kg) |
| Road Load Force (F = A + BV + CV2) | A = 29.0 lbf (129.0 N) |
| B = 0.24 lbf/mph (2.388 N/(m/s)) | |
| C = 0.0180 lbf/mph2 (0.4006 N/(m/s)2) | |
| Tire Radius | 328.4 mm |
The remaining Tasks 3-10 include the baseline followed by successive changes in technology as noted in the table. The order chosen reflects a plausible sequence of technology adoption for decreasing fuel consumption; however, it is worth noting that the incremental gains of a given technology may not be independent of that order. The first sequence of changes are related to friction and breathing. These were evaluated in Tasks 3-5 on the naturally aspirated 2.5L engine. Task 6 added direct injection (GDI) while Task 7 introduced a turbocharger on a 33 percent downsized 1.68L engine. The boost level was chosen to maintain approximately constant peak engine power. Further downsizing by 50 percent to 1.25L was carried out in Task 8 with the addition of cooled EGR and higher boost level, again maintaining equivalent engine power. The bore and stroke sizes for both downsized engines were selected with NRC guidance to achieve a square ratio. To preclude high heat losses with exceptionally small cylinder sizes, the 50 percent downsized engines had three cylinders instead of four cylinders for the 1.68L and larger engines. Task 9 kept the same engine configuration but replaced the six-speed automatic transmission (6 AT) with an eight-speed (8 AT). Because the latest eight-speed transmissions have reduced friction losses relative to the current six-speed versions (Scherer et al. 2009), several levels of friction reduction up to 60 percent were considered in Tasks 9B through 9E. Task 10-A and 10-B both employed a CVT transmission; the former used losses representative of current
TABLE X.2 Engine and Powertrain Configurations
| Engine | Transmission | |||||||||||||
| Task | Disp (L) | Air | Fuel | CR | No. Cyl. | Bore (mm) | Stroke (mm) | Friction | Cams | EGR | Design | Max Ratio | Min Ratio | Final Drive |
| 1 | 2.0 | TC | GDI | 9.2 | 4 | 86 | 86 | Chen-Flynn | DCP | — | — | — | — | |
| 2 Ref | 2.5 | NA | PFI | 9.7 | 4 | 89 | 100 | Chen-Flynn | Fixed | 6 AT | 4.584 | 0.745 | 3.06 | |
| 3 Base | 2.5 | NA | PFI | 9.7 | 4 | 89 | 100 | Chen-Flynn | DCP | 6 AT | 4.584 | 0.745 | 3.06 | |
| 4 | 2.5 | NA | PFI | 9.7 | 4 | 89 | 100 | Red. 26% | DCP | 6 AT | 4.584 | 0.745 | 3.06 | |
| 5 | 2.5 | NA | PFI | 9.7 | 4 | 89 | 100 | Red. 26% | DCP + DVVL | 6 AT | 4.584 | 0.745 | 3.06 | |
| 6 | 2.5 | NA | GDI | 9.7 | 4 | 89 | 100 | Red. 26% | DCP + DVVL | 6 AT | 4.584 | 0.745 | 3.06 | |
| 7 | 1.68 | TC | GDI | 9.7 | 4 | 81 | 81.51 | Red. 26% | DCP + DVVL | 6 AT | 4.584 | 0.745 | 3.06 | |
| 8 | 1.25 | TC | GDI | 9.7 | 3 | 81 | 80.86 | Red. 26% | DCP + DVVL | 6 AT | 4.584 | 0.745 | 3.06 | |
| 9-A | 1.25 | TC | GDI | 9.7 | 3 | 81 | 80.86 | Red. 26% | DCP + DVVL | 8 AT | 4.6 | 0.52 | 3.06 | |
| 9-Ba | 1.25 | TC | GDI | 9.7 | 3 | 81 | 80.86 | Red. 26% | DCP + DVVL | 8 AT - 15% | 4.6 | 0.52 | 3.06 | |
| 9-Ca | 1.25 | TC | GDI | 9.7 | 3 | 81 | 80.86 | Red. 26% | DCP + DVVL | 8 AT - 30% | 4.6 | 0.52 | 3.06 | |
| 9-Da | 1.25 | TC | GDI | 9.7 | 3 | 81 | 80.86 | Red. 26% | DCP + DVVL | 8 AT - 45% | 4.6 | 0.52 | 3.06 | |
| 9-Ea | 1.25 | TC | GDI | 9.7 | 3 | 81 | 80.86 | Red. 26% | DCP + DVVL | 8 AT - 60% | 4.6 | 0.52 | 3.06 | |
| 10-A | 1.25 | TC | GDI | 9.7 | 3 | 81 | 80.86 | Red. 26% | DCP + DVVL | CVT-1 | 2.6 | 0.40 | 5.00 | |
| 10-Bb | 1.25 | TC | GDI | 9.7 | 3 | 81 | 80.86 | Red. 26% | DCP + DVVL | CVT-2 | 2.6 | 0.40 | 5.00 | |
a Cases 9-B – 9-E have reduced transmission torque losses relative to 6 AT as indicated in the table.
b Case 10-B is the same as case 10-A except that CVT-2 uses the more efficient loss map of the 6 AT automatic transmissions.
CVT production (CVT-1), while the latter (CVT-2) used a hypothetical CVT loss map equivalent to the more efficient map of the six-speed transmission.
FULL SYSTEM SIMULATION MODEL RESULTS
Figure X.1 graphically shows the predicted combined cycle fuel consumption results.
KNOCK MODEL RESULTS
The U of M full systems simulation uses a knock model, based on Hoepke et. al. (2012), to predict the onset of knock. The fractions of drive cycle time which required retarded spark timing to avoid knock for each of the technologies evaluated are shown in Table X.3. For the first level of turbocharging and downsizing and beyond, a significant fraction of the drive cycle time required spark retard to avoid knock. A vehicle manufacturer is likely to establish a spark timing calibration that provides significant margin to avoid knock so that complete reliance on the knock control system is not required. Such a calibration is likely to result in less than the modeled reduction in fuel consumption for the turbocharging and downsizing technologies.
FRICTION OF TURBOCHARGED DOWNSIZED ENGINES
Friction of the 2.5L naturally aspirated engine is compared with the friction of the 33 percent downsized, 1.68L turbocharged engine and the 50 percent downsized, 1.25L turbocharged engine in this section.
The Chen-Flynn friction equation used in the U of M engine simulation is shown below:
FMEP = FMEPconst + APCyl,max + Bcmps + Cc2mps +
Lacc D/Vdcrpm
Where: FMEPconst = 0.0
A = 0.004 bar/bar
B = 0.08 bar/m/s
C = 0.0
Lacc = 0.0 (electrical loads)
Applying this equation to the 2.5L naturally aspirated engine and the 1.68L and 1.25L turbocharged engines at a typical FTP cycle engine speed of 1,500 rpm and a torque of 50 Nm yields the results shown in Table X.4. Due to the reduced stroke of the 1.68L turbocharged engine relative to the 2.5L engine, the mean piston speed decreased, which
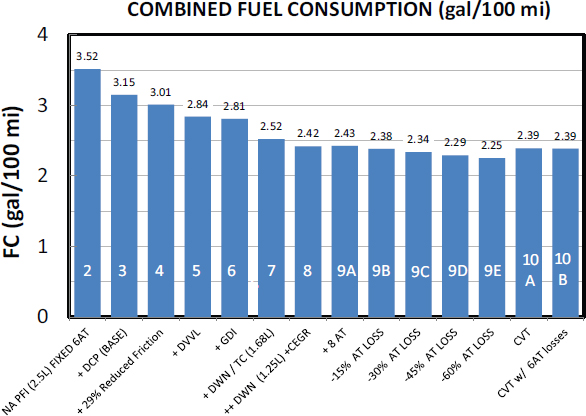
FIGURE X.1 Predicted fuel consumption (combined cycle) for various technologies. Task numbers superimposed on bars.
SOURCE: Middleton et al. (2015).
TABLE X.3 Fraction of Cycle Time with Retarded Spark Timing to Avoid Knock
| Engine | FTP | HWY |
| Fixed Cams | 0.00 | 0.00 |
| DCP | 0.00 | 0.00 |
| EFR | 0.00 | 0.00 |
| DVVL | 0.00 | 0.00 |
| GDI 9.7:1 | 0.01 | 0.01 |
| GDI 10.0:1 | 0.02 | 0.04 |
| 1.68L TC 6-AT | 0.10 | 0.23 |
| 1.25L TC 6-AT | 0.24 | 0.53 |
| 1.25L TC 8-AT | 0.26 | 0.059 |
resulted in a 3 percent decrease in FMEP. However, the 1.25L turbocharged engine with nearly the same stroke as the 1.68L engine has a 7 percent increase in FMEP, due to the higher peak cylinder pressure. Even with this small increase in FMEP, the actual friction torque of the 1.25L engine will be considerably lower than the 2.5L naturally aspirated engine due to the engine downsizing.
REFERENCES
Hoepke, B., S. Jannsen, E. Kasseris, and W. Cheng. 2012. EGR effects on boosted SI engine operation and knock integral correlation. SAE Int. J. Engines 5(2):547-559. doi:10.4271/2012-01-0707.
Middleton, R., O. Gupta, H-Y. Chang, G. Lavoie, and J. Martz. 2015. Fuel Economy Estimates for Future Light-Duty Vehicles, University of Michigan Report.
Scherer, H., M. Bek, and S. Kilian. 2009. ZF new 8-speed automatic transmission 8HP70 - Basic design and hybridization. SAE Int. J. Engines 2(1): 314-326. doi:10.4271/2009-01-0510.
| Engine Config. | Task | Torque (Nm) | BMEP (bar) | PCyl, max (bar) | Cmps (m/s) | FMEPPP (kPa) | FEMPmps (kPa) | FEMPacc (kPa) | FMEPtot (kPa) |
| GDI 2.5L NA | 6 | 50 | 2.5 | 16.5 | 5.00 | 4.7 | 28.4 | 5.8 | 38.8 |
| 1.68 L TC | 7 | 50 | 3.7 | 21.2 | 4.08 | 6.0 | 23.2 | 8.6 | 37.7 |
| 1.25 L TC | 8 | 50 | 5.0 | 24.4 | 4.04 | 6.9 | 23.0 | 11.5 | 41.4 |
Where: PCyl, max is the peak cylinder pressure in bar, Cmps is the mean piston speed in m/s.
SOURCE: Derived from Middleton (2015).


