
This chapter focuses on reducing fuel consumption with non-powertrain technologies. These technologies affect engine performance either directly or indirectly to reduce fuel consumption. The committee considers car body design (aerodynamics and mass), vehicle interior materials (mass), tires, and vehicle accessories (power steering and heating, ventilation, and air conditioning [HVAC] systems) as areas of significant opportunities for achieving near-term, cost-effective reductions in fuel consumption. These will be considered in some detail below.
The forces impeding vehicle motion on a level grade can be written as follows:
F = ma + Ra + Rrr
where ma is the inertial force, Ra is the aerodynamic resistance, and Rrr is the rolling resistance.
The total energy required for propulsion over the cycle is equal to the time integral of the positive product of force and velocity. The energy used to overcome inertial forces dominates in the FTP cycle, while the energy used to overcome aerodynamic resistance dominates in the highway cycle.
Collections of relatively low-cost vehicle technologies can have a positive impact on reducing fuel consumption. Low-rolling-resistance tires, improved vehicle aerodynamics, and electric power steering can reduce fuel consumption by about 10 percent with only moderate cost additions. Higher-efficiency air conditioning systems are available that better match cooling with occupant comfort while improving fuel economy. Electric and electric/hydraulic power steering also reduce the load on the engine by demanding power only when the operator turns the wheel, whereas older systems relied on hydraulic power supplied by the engine all the time.
This chapter is organized to discuss the major non-powertrain systems and their impact on fuel consumption and costs. It describes some of the issues that must be addressed prior to 2025 for the following technologies:
- Improvements in vehicle aerodynamics,
- Vehicle mass reduction,
- Improvements in tire rolling resistance,
- Improved vehicle accessories and HVAC, and
- Autonomous components and implementation.
Energy required to overcome drag does not depend on vehicle mass. It does depend on the size of the vehicle as represented by the frontal area.1 For low-speed driving, about one-fourth of the energy delivered by the drivetrain goes to overcoming drag; for high-speed driving, one-half of the energy goes to overcoming drag. Vehicle drag coefficients (Cd) vary considerably, from 0.195 for the General Motors EV1 to 0.57 for the Hummer 2, with more typical values in the range of 0.25 to 0.38 for production vehicles. Vehicle drag can be reduced through both passive and active design changes. The drag coefficient can be lowered by more aerodynamic vehicle shapes with smaller influences from other factors, such as external mirrors, rear spoilers, frontal inlet areas, wheel well covers, and the vehicle underside.
Vehicles with higher Cd values (greater than 0.30) may be able to reduce the Cd by up to 10 percent at low cost without affecting the vehicle’s interior volume. In the NRC Phase 1 report, Assessment of Fuel Economy Technologies for Light Duty Vehicles (NRC 2011), the committee’s judgment was that a Cd of less than 0.25 would require significant changes that could include the elimination of outside rearview mirrors, total enclosure of the car underbody, and other costly modifications.
_____________
1 The force required to overcome drag is represented by the product of the drag coefficient, Cd, the frontal area, A, and the square of speed, V. The formula is F= ½ Cd AV2.
Fuel Consumption
Argonne National Laboratory estimated that, without engine modifications, a 10 percent reduction in aerodynamic drag would result in about a 0.25 percent reduction in fuel consumption for the urban cycle and a 2.15 percent reduction for the highway cycle. Under average driving conditions, a 10 percent reduction in drag resistance would reduce total fuel consumption about 2 percent (NRC 2011). If lower acceleration can be tolerated and the engine operates at the same efficiency, the improvement with a 10 percent reduction of aerodynamic drag could result in fuel consumption reduction as high as 3 percent.
The recent NRC report Transitions to Alternative Vehicles and Fuels, referred to as the 2050 Transitions Report in the remainder of this report, estimated aerodynamic improvements possible for the 2030 time frame (NRC 2013). That study’s scenarios estimated a reduction in new-vehicle-fleet aerodynamic drag resistance for the midrange (high probability of attainment) case to average about 21 percent (4 percent reduction in fuel consumption) in 2030. For the optimistic case, the aerodynamic drag reductions are estimated to average about 28 percent in 2030.
The recent Technical Support Document (TSD) for the National Highway Traffic Safety Administration/Environmental Protection Agency (NHTSA/EPA) final rulemaking (EPA/NHTSA 2012b) considered an aerodynamic reduction in the 10-20 percent range. For the final rule, the Agencies considered two levels of improvements. The first level is that discussed in the 2017-2025 final rule and the 2012 TSD; it includes such body features as air dams, tire spats,2 and perhaps one underbody panel. The second level of aero improvements includes such body features as active grille shutters, larger underbody panels, or low-profile roof racks. The 2012-2016 final rule estimated that a fleet average of 10-20 percent total aerodynamic drag reduction is attainable, which equates to incremental reductions in fuel consumption and CO2 emissions of 2-3 percent (average 2.5 percent) for both cars and trucks. Several original equipment manufacturers (OEMs) have already aimed to achieve low drag coefficients of between 0.2 and 0.3 in their product lines, although these tend to be vehicles that have higher costs or are performance based. There are at least a half dozen mid-priced 2013 passenger cars advertising active grille shutters. In general, the additional data on improving vehicle aerodynamics provided to this committee by OEMs and Tier 1 suppliers have not challenged or contradicted the methodology and conclusions described in the NHTSA/EPA TSD.
Timing
Reductions of drag coefficient Cd by approximately 5 percent (up to 10 percent) have been taking place and will continue. Several OEMs expressed concern that reducing the drag coefficient too aggressively could have a negative impact on consumer acceptance. Additionally, several OEMs have already achieved Cd in the range 0.20 to 0.24. In the 2020-2025 time frame, 10-20 percent reductions in aerodynamic drag are plausible.
Costs
The Phase One report (NRC 2011) estimated that a 5 percent reduction in drag could be achieved with minimal cost through vehicle design. Slightly more aggressive reductions could be achieved by sealing the undercarriage and installing covers/shields (e.g., in the wheel well areas and on the underbody) costing between $10 and $100. A 10 percent reduction in aerodynamic drag would be an aggressive strategy calling for wind deflectors (spoilers) and possibly the elimination of sideview mirrors. The 2050 Transitions Report (NRC 2013) did not provide cost estimates related to aerodynamic improvements, although there would be significant cost increases associated with these technologies.
The Agencies’ current estimates for direct manufacturing costs (DMC) for improvements in aerodynamic drag to a baseline vehicle in 2017 are $39 for Level 1 and $117 for Level 2 (Table 6.1). These estimates follow the same trend from the 2012-2016 rule, when NHTSA and EPA estimated the aero-level 1 (10%) total cost at $41 (2010 dollars) applicable in MY 2015. The second level of aero (20%) included such body features as active grille shutters, rear visors, larger underbody panels, or low-profile roof racks, with a DMC cost of $123 (2010 dollars). The committee concurred with the Agencies’ cost estimates. Additionally, the committee assessed many of the other current studies on aerodynamic drag reductions in Table 6.2.
Barriers
Vehicles that exist today with Cd below or equal to 0.25 are usually specialty vehicles (e.g., sports cars and high-mileage vehicles like the Prius). While higher Cd vehicles (e.g., trucks, vans, and boxlike vehicles such as the Scion and the Flex) can reduce Cd, vehicle functionality could be diminished. If vehicle functionality (including “curbside appeal”) is compromised, then the vehicle’s appeal to the consumer would be reduced.
Elimination of sideview mirrors will require changes in safety regulations and improvement in vision systems, but studies believe that by removing sideview mirrors, drag reductions of 2-7 percent are possible (Hucho 2005). Tesla and the Alliance for Automobile Manufacturers have petitioned NHTSA on the topic of side mirror removal.
_____________
2 Tire spats, or wheel fairings, are devices that cover the wheel well of a vehicle for the purpose of reducing aerodynamic drag.
| Cost type | Aero | Incremental to | 2017 | 2018 | 2019 | 2020 | 2021 | 2022 | 2023 | 2024 | 2025 | ||||||||
| DMC | Level 1 | Baseline | 39 | 38 | 37 | 37 | 36 | 35 | 35 | 34 | 33 | ||||||||
| DMC | Level 2 | Aero-level 1 | 117 | 115 | 112 | 110 | 108 | 106 | 104 | 102 | 100 | ||||||||
SOURCE: EPA/NHTSA (2012b).
| Study | Year Published | Direct Manufacturing Cost ($) | Cd Reduction | FC Reduction | Comments | ||||||||||||||
| NRC Phase 1 Study | 2011 | $40 to $50 | 5-10% | 1% to 2% | Wheel wells, underbody covers, body shape, mirrors | ||||||||||||||
| NRC 2050 Transitions Report | 2011 | N/A | 21-28% | 4-6% | Passive and active | ||||||||||||||
| EPA/NHTSA TSD | 2012 | $49 to $164 | 10-20% | 2-3% | Passive and active | ||||||||||||||
| Current Study | 2015 | $49 to $165 | 10-20% | 2-3% | Passive and active | ||||||||||||||
MASS REDUCTION OPPORTUNITIES FROM VEHICLE BODY AND INTERIORS
The material trends in the automobile have been well established for more than 20 years, with an incremental, material substitution used to slowly introduce new materials that, in most cases, reduce mass. Figure 6.1 shows the decline in iron casting and an increase in high-strength steel, plastics/composites, and aluminum. Some vehicle subsystems have already made the lightweighting transition, such as the use of aluminum for powertrains and wheels. The change in vehicle composition is almost entirely due to the lightweighting impact of the new materials and, in some cases, to their potential to improve safety and crashworthiness.
Many expect these material trends to continue and even accelerate due to current fuel economy regulations. Mass reduction will be realized primarily through the use of more advanced high-strength steel for body structures, aluminum closure panels, and, in some cases, aluminum bodies.
At the edge of development, some structures may utilize advanced composite structures for the body (e.g., BMW i3), where carbon fiber systems allow for extremely lightweight and strong structures. But advanced composite structures will not be used in high sales volume vehicles for at least 10 years. Lightweighting technology deployment will vary depending on vehicle size and sales volume.
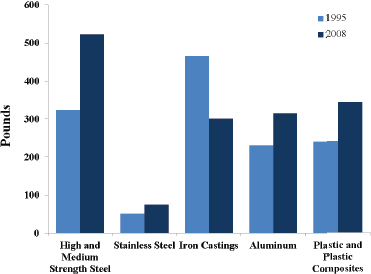
FIGURE 6.1 Selected material content per light-duty vehicle, 1995 and 2008.
SOURCE: DOE (2010).
Steel
High-strength steel has the advantage that it can be downgauged (made thinner) in many applications while still performing the same function as thicker, mild steel.3 High-strength steels are traditionally viewed as those steels that have a tensile strength greater than 270 megapascals (MPa). A number of steel alloys in the 480-980 MPa range are routinely used for various structural components in the car, such as the front engine rails and some of the door beams and side pillars. Even stronger steels (1,000-1,500 MPa and higher) have been introduced for critical crash zones.
Plastics, Rubbers, and Composites
Plastics and composites offer significant long-term potential for reducing mass, but many challenges currently exist in broadening their application. The use of plastics, rubbers, and composites in automobiles is increasing with advances in chemistries and fabricating technologies. Many components inside and outside the vehicle now have fascias, lids, air foils, knobs, and other components made from composites because of advancements in colors, feel (soft skin feel), resistance to ultraviolet rays, and proper management of thermal expansion properties. Although composite materials are used throughout the car, not many applications are currently designed for structural crash management.
While many advances in these materials will occur to improve their performance, the use of fiber-reinforced materials (glass fiber or carbon fiber) for structural components is not expected to have significant penetration in the next 10 years (Figure 6.2). The growth in composites is largely constrained by cost and technical requirements (ability to join, thermal expansion differences, and a less-developed supply and recyclability chain).
Adhesives
Coatings, adhesives, and sealants are provided by the chemical industry. While all three product classes are important, adhesives pose the greatest challenge to OEMs and repair shops. Adhesives are a preferred joining method due to their superior joint bonding capabilities and ability to improve stiffness of the joining components. They can be sophisticated one-part or two-part and with or without a mechanical fastener or spot weld through the joint. Adhesives provide a mass reduction enabling technology because they can bond dissimilar materials, provide insulation if necessary, and tend to make a stronger bond than a localized joint (such as resistance spot welds or rivets), which can lead to further downgauging of material.
Aluminum
Aluminum is already a dominant material in powertrain components, heat exchangers, and road wheels and is an emerging material for all vehicle closures (e.g., 34 percent of MY 2012 vehicle hoods were aluminum and 48 percent are expected to be by MY 2015) (Ducker Worldwide 2014). In Europe and in the United States, the average car contains about 8 percent aluminum. This number is expected to double to 16 percent by 2025, driven primarily by the continued conversion from steel to aluminum.
One of the greatest challenges in manufacturing aluminum is joining. Traditional aluminum joining methods require a combination of welding, adhesive, and rivets, which limit joint configurations, present challenges at end-of-life recycling, and add cost to the process. In addition, aluminum is susceptible to galvanic corrosion when joined with dissimilar metals. Isolation of aluminum from other material through the use of adhesive or a material coating is typical to prevent galvanic corrosion. It is also pretreated to minimize corrosion and ensure paintability. In contrast to steel, aluminum does have the advantage in that it does not rust.
Aluminum generally takes three forms in the car: sheet, extrusion, and casting (a fourth form, forgings, can also be used). With the use of aluminum in cars forecast to grow (343 lb in 2012, growing to 550 lb in 2025), all three forms will increase in the average vehicle every year (Ducker Worldwide 2011). Extruded and welded aluminum bars are effective for front and rear rails (designed for crash management). The largest growth by far, however, is expected to be aluminum panels (see Table 6.3) for parts throughout the body. Aluminum sheet is cheaper than the other forms, and it is expected that the learning curve to develop sheet applications for high-volume vehicles will plateau as the industry learns by adding more applications every year.
Magnesium
Magnesium has the capability of providing 40 to 65 percent mass reduction in comparison to steel. Magnesium can be formed from sheet (like stamped steel), but is better used as thin-wall castings to maximize its weight reduction capabilities. Like aluminum, magnesium has galvanic corrosion concerns and must be isolated from other materials. Magnesium has a very limited infrastructure and knowledge base compared to aluminum and steel, but applications are appearing in production vehicles today (e.g., the liftgate inner on the Ford MKT). Other applications include steering column attachment, HVAC openings, pedal attachments, instrument panel structure attachments, door hinge attachments, spare tire modules, and A-pillar mounting attachments.
_____________
3 Even as steel strength continues to increase, downgauging has limitations because other properties, such as stiffness, are important to the structure.
TABLE 6.3 Distribution of Automotive Aluminum Utilization by Type
| Automotive Aluminum Form | 2012 (343 lb/vehicle) (%) | 2025 (550 lb/vehicle) (%) |
| Casting | 81 | 61 |
| Sheet (rolled) | 10 | 28 |
| Extrusion | 8 | 9 |
| Forgings | 1 | 2 |
SOURCE: Data adapted from Ducker Worldwide (2011).
Mixed-Material Car
The high-volume, mixed-material car is recognized as the longer-term, optimal approach to mass reduction, and most auto companies are headed in this direction. The mixed-material vehicle can be thought of as a vehicle that uses the most suitable material in each specific location to provide optimal performance and minimize weight at an appropriate cost. There are some cars on the market today that exemplify this goal; the McLaren P1 and the Audi TT are examples of vehicles that embody the mixed-material approach. The appeal of the mixed-material car is that it can enable weight reductions beyond what aluminum or high-strength steel alone can provide, and at lower cost.
Tooling and material costs for fabrication and joining are major decision factors in material selection. While the “optimized” vehicle will perhaps have a different mix of materials used for parts to optimize structure and mass, the corresponding costs for tooling and fabrication have to be considered. Parts made of different materials might mean more tooling costs.
Vehicle Design Challenges with Advanced Materials
The use of lightweight composites is an emerging trend in vehicles, and many of the barriers have been identified and are being studied. Some of the known barriers to use of lightweight composites include
- No ability to model time-, temperature-, and environment-dependent polymer composite properties,
- No integration of accurate composite models into engineering design tools,
- High-cost processing infrastructure,
- Long production times for structural composite parts, and
- Difficulties in identifying and repairing damaged composites.
These dynamic characteristics are one of the complications along with others such as the lack of long-term durability predictions and resultant overreliance on the build-and-test method for testing composite property behavior.
Modeling vehicle performance in the design stages is an intrinsic part of current vehicle development. More sophisticated models will need to be developed to support mixed-material vehicles.
Mass Reduction and Repairability
The use of new materials for automotive applications presents a challenge to the repair industry. For the greater part of a century, the automotive body structure and closures have been dominated by the use of mild and medium-strength steel. As a result, the repair industry is very good at assessing damage and repairing or replacing traditional steel parts when required. However, new materials do not
follow the same assessment and repair rules as mild steel. In fact, the safe repair of damaged parts made of aluminum, composites, and even advanced high-strength steels requires specific methods and equipment. Ford has addressed some of these concerns with the introduction of the aluminum-intensive F-150 in MY 2015 by offering training courses on the properties of aluminum versus steel and offering advice and comments on retooling shops and equipment to both dealers and independent repair shops (Wernle 2014). With composites, parts that appear undamaged under visual inspection can still fail. The aerospace industry makes extensive use of ultrasonic testing to examine parts for flaws. Automakers are aware of these issues and are therefore reluctant to implement composites without first developing proper inspection techniques.
The automotive, insurance, and certification communities are responding to these safety issues. Companies such as Audi, Mercedes, Chrysler, and Honda either require specific certification or have created an approved network of collision repair shops. Such certification or network branding ensures some level of training to keep up with new repair standards for advanced lightweight materials. Insurers also require standards for the repair process and certification levels. The certification group, Inter-Industry Conference on Auto Collision Repair (I-CAR), is highly involved in the processes for repair of new materials and certification of repair shops.
Estimates of Mass Reduction Potential
The impetus behind lightweighting (mass reduction) of passenger cars and light-duty trucks is better performance and improved fuel economy. Lighter vehicles should handle better (e.g., responsiveness) and have improved stopping performance. The government’s fuel economy standards are footprint-based and, by themselves, provide no incentive for downsizing vehicles.
Potential effects on safety, fuel economy, and vehicle costs have been analyzed where mass reduction is accomplished entirely through material substitution and smart design, which can reduce mass without changing a vehicle’s functionality or safety performance and maintain structural strength. Three important aspects of lightweighting are these:
- The fuel savings benefit of mass reduction is consistent among many mainstream vehicles. An industry estimate is that a 10 percent reduction in vehicle mass will produce approximately 6 to 7 percent reduction in fuel consumption for passenger cars and 4 to 5 percent reduction for light-duty trucks. A literature review of various studies relating mass reduction to fuel consumption reduction showed a range of 1.9 to 8.2 percent, with an average among the studies of 4.9 percent for every 10 percent in mass reduction (Cheah 2010).
- The cost for mass reduction alternatives varies from negative (a cost savings) to several dollars per pound. It is generally acknowledged that the cost to reduce mass increases for each additional unit of mass eliminated on a vehicle.
- The concept of mass decompounding4 recognizes that, as vehicle mass is reduced, there are new opportunities to reduce additional mass and that these often minimize the overall cost increase. The most current studies cite opportunities for mass decompounding that range from 15 to 56 percent of the primary mass saved. Combining the information from these studies with the committee’s expertise, the committee finds it likely that a reduced-mass vehicle would allow an additional 40 percent of the primary mass removed for cars and an additional 25 percent of the primary mass removed for trucks if decompounding strategies are implemented, assuming that the whole vehicle can be reoptimized for the new mass level. According to a recent study, primary mass reduction in the body provides the greatest potential for mass decompounding among subsystems, with engine and transmission subsystems providing the largest secondary mass reduction (Alonso et al. 2012). Subsystems that may offer potential mass decompounding will vary by vehicle design, but the most common opportunities for decompounding are those listed below (Bjelkengren, 2006):
- Tires,
- Wheels,
- Powertrain,
- Suspension system,
- Braking system,
- Bumpers,
- Fuel and exhaust systems,
- Steering system, and
- Electrical systems and wiring.
In this committee’s analysis, the decompounding can be defined as:
Decompounding = secondary mass reduction/primary mass reduction.
For a 10 percent mass reduction in midsized and large cars, 7.14 percent of the mass reduction is considered to be primary mass reduction and 2.86 percent of the mass removed from decompounding. For a 10 percent removal from light-duty trucks, 8 percent of the total mass removed would come from primary and 2 percent would come from mass decompounding, or secondary mass reduction (Table 6.4).
The committee reviewed the targets in the TSD for the 2017-2025 rule, shown in Table 6.5. It concluded that these are conservative targets because OEMs are likely to imple-
_____________
4 Mass decompounding is the opportunity for additional, or secondary, mass reduction in a vehicle’s design based on the new specifications of the newly designed vehicle following the initial, or primary, implemented mass reductions.
| Mass Reduction (%) | ||
| Cars | Trucks | |
| Primary | 7.14 | 8 |
| Secondary | 2.86 | 2 |
| Total | 10 | 10 |
TABLE 6.5 NHTSA-Estimated Maximum Mass Reduction for a Safety-Neutral Environment
| Vehicle Type | Maximum Mass Reduction (%) |
| Subcompact | 0 |
| Midsize car | 3.5 |
| Large car | 10 |
| Minivan | 20 |
| Light truck | 20 |
SOURCE: EPA/NHTSA (2012a).
ment more aggressive levels of mass reduction. Although OEMs tend to implement fuel consumption reduction technologies ranked in the order from highest to lowest cost effectiveness, there are technologies where other design considerations might dictate a different strategy. The committee feels that lightweighting is an example of a technology that might be implemented before technologies with a better cost effectiveness in terms of fuel consumption reduction because it offers other benefits.
Implementation of mass reduction techniques can provide several benefits that might be attractive to an OEM. Reducing vehicle mass can be even more attractive to consumers, and OEMs may perceive mass reduction techniques to be less risky than advanced engine or propulsion technologies. For light trucks, mass reductions can also increase towing and load capacities without any modifications to the powertrain. For hybrid and electric vehicles, a reduction in mass can allow the OEM to either increase the range or reduce the battery capacity to reduce cost while maintaining range. From a design perspective, lightweighting techniques can offer a proven method for reducing fuel consumption that, while complex, is not limited by the same functional requirements to the extent that powertrain or transmission technologies are.
The Department of Energy (DOE), with input from 135 participants, including representatives of 36 domestic and international automobile manufacturers, has identified five major vehicle component groups for lightweighting that can lead to an overall 20 percent mass reduction, a common industry target for 2020 (Schutte and Joost 2012) (see Table 6.6). The industry and a number of studies (two of which are summarized in Box 6.1) concur that the vehicle body offers the greatest opportunity for lightweighting relative to other parts of the car. The powertrain system, although already significantly lightened (for example, by using aluminum heads and blocks), receives additional benefit from the downsizing enabled by lightweighting other areas of the vehicle and by boosting the engine through turbocharging or supercharging. The chassis and suspension, like the body, have many parts and therefore significant lightweighting potential. The vehicle interior is already plastic intensive and is expected to stay so, though some opportunity exists to reduce the weight of plastic panels by further reducing the density of the plastics. Other places to reduce interior weight include seating and components behind the instrument panel. Overall, the greatest change in design and materials can be expected in the body and chassis/suspension due to aggressive mass reduction in those subsystems.
The long-term goal of the US Drive program sponsored by DOE is a 50 percent reduction in weight. The Partnership for a New Generation of Vehicles research effort from 1994 to 2002 was an early effort to conceptualize and build highly fuel-efficient vehicles. The mass reduction goal was 40 percent. Actual vehicles achieved a mass reduction of 20 to 30 percent.
From an aluminum/magnesium-intensive design, Lotus Engineering projected a 2020 potential for about a 20 percent weight reduction at zero cost and a 40 percent weight reduction at a cost of about 3 percent of total vehicle cost (Lotus Engineering 2010).
The Aluminum Association and Ducker Worldwide conducted a study that found all auto manufacturers are working on mass reduction as a critical technology to reduce fuel consumption (Ducker Worldwide 2011). Ducker found that “no single vehicle technology strategy can effectively achieve a 50+ mpg fuel economy target without significant weight reduction.” Based on Ducker’s estimation, the average weight
| Light-Duty Vehicle Subsystem | Distribution of Vehicle Weight by Vehicle Group (Current Vehicles) (%) | Targets for Weight Reduction for Light-Duty Vehicles Through 2020 (%) |
| Body | 23-28 | 35 |
| Powertrain | 25-28 | 10 |
| Chassis and suspension | 22-27 | 25 |
| Interior | 10-15 | 5 |
| Closures and other | 15-16 | — |
| Complete vehicle total | 100 | 20 |
SOURCE: DOE (2013).
BOX 6.1
Committee Summary of Two Studies on Reducing Vehicle Mass
“Mass Reduction for Light-Duty Vehicles for Model Years 2017-2025”
Principal Investigators: Electricore EDAG and GWU
In 2012, the DOT contracted with Electricore, EDAG, and George Washington University to design a midsized vehicle using lightweighted materials. The goal was to achieve maximum mass reduction within several performance and technological boundaries. Parameters for the design of the vehicle included maintaining vehicle footprint, retail price (with a 10 percent margin), performance, and safety. Production parameters stated that the material technology and engineering processes must be realistically achievable during the 2017-2025 time frame and should consider a vehicle volume of 200,000 vehicles. Additionally, only standard gasoline powertrains were to be considered – excluding hybrids, plug-in hybrids, and other electrified powertrains.
The resulting vehicle design claimed a 22.4 percent reduction in the overall mass of the vehicle. The estimated incremental cost of this design was $319 ($.96 per kg). In addition to the use of lightweighted materials, the powertrain was reduced from a displacement of 2.4 L (177 hp) to 1.8 L, with an accompanying reduction of 37 hp.
An Analysis of Impact Performance with Cost Considerations for a Low Mass Multi-Material Body Structure
Principal Investigators: Lotus Engineering
In 2009, the Energy Foundation contracted with Lotus Engineering to perform a study on mass reduction using a 2009 Toyota Venza as the baseline vehicle. Two scenarios were developed for this study with one vehicle being a high-production-volume vehicle with a standard spark ignition engine and one low-production vehicle with a hybrid powertrain developed by EPA. Unlike the study performed by EDAG and GWU, this study was aimed at removing 40 percent of the total mass from the vehicle while maintaining vehicle safety and footprint. Lotus approached this task with a full vehicle design approach and heavily utilized computer aided design. All materials available were considered and as much recycled material as possible was incorporated.
The resulting Lotus vehicle design was able to remove 241kg (or 37 percent) from the body-in-white Toyota Venza. The redesigned Venza met all current safety and performance standards while reaching a cost of only 3% more than the baseline vehicle (Lotus Engineering 2010).
of vehicles in 2025 will be reduced by 408 lb compared to the average 2008 vehicle. More advanced powertrains (e.g., battery electric vehicles and fuel cell vehicles) place greater value on vehicle mass reduction because of the cost premium associated with the powertrain.
The 2050 Transitions Report estimated a mid-range mass reduction potential in 2030 of 20 percent for passenger cars and 15 percent for light trucks and an optimistic reduction potential of 25 percent for passenger cars and 20 percent for light trucks (NRC 2013). The difference between mid-range and optimistic was primarily due to the ongoing trend toward comfort and convenience features, which add weight. The difference between passenger cars and light trucks was primarily that light trucks had an allowance for functionalities such as towing capacity, which might be constrained by fuel economy designs.
Factors That Constrain Future Mass Reduction and Fuel Consumption Improvements
Vehicle weight decreased rapidly in the late 1970s and early 1980s because of high fuel prices and implementation of the initial CAFE standards. Weight then increased significantly from the mid-1980s to the mid-2000s, when fuel prices fell and fuel economy standards were kept constant. Thus, based on history, projecting weight trends into the future is very uncertain. Technologies optimizing safety, comfort/convenience, and low emissions have contributed to an overall increase in vehicle mass over the past 30 years.
- Safety. Weight associated with increased safety measures is likely to be lower than in the past. The preliminary regulatory impact analysis for the proposed 2025 CAFE standards looked at weight increases for a variety of safety regulations, including proposed rules that would affect vehicles through 2025, and estimated a potential weight increase of 100-120 pounds (NHTSA 2012). That is about a 3 percent mass increase.
- Comfort and convenience. There has been an increase in the weight of vehicles due to increased luxury and comfort accessories. Continued weight increases are inconsistent with a future accompanied by strong CAFE standards. Manufacturers will have a strong incentive to reduce weight.
- Towing capacity. A performance constraint that might affect mass reduction for some light trucks relates to towing capacity. Towing limits are dominated by factors such as engine power, frame stiffness, axle and tire load ratings, and transmission load capacity. The overall weight of a vehicle is not the primary design restraint, but the mass associated with a stiff platform and axle/tire/powertrain design strongly influences the overall weight of a vehicle.
Timing
Model Years 2015-2020
Steel is the dominant materials strategy today and will be slow to phase out because of the extensive infrastructure developed over several decades. The infrastructure includes metallurgical knowledge, modeling software, forming processes (especially stamping presses and die making), assembly, welding, and painting. The repair and recycling industries are also steel-focused. Since the late 1980s, high-strength steels have been used to help with safety and mass reduction. Every year, the industry advances the steel strength and forming technology to compete with other materials. Today’s high-volume, steel-intensive vehicles have aluminum in key locations, including hoods (about 30 percent of today’s U.S. cars have aluminum hoods) and deck lids but not generally in structural areas. Future growth in aluminum parts will continue (closures, body structure, and bumpers) using a material substitution approach (i.e., the designs may not be optimized for aluminum but can still realize a positive benefit from the conversion). Based on input from the tool and die industry, there has been a significant upswing in the demand for aluminum parts. The expectation is that several aluminum closures will be introduced by MY 2015 and more structural applications for aluminum are also expected soon. This evolutionary step will be toward a high-volume, mixed-material vehicle made principally of the two materials, with a manageable level of complexity that continues to use much of the same steel infrastructure. Occasional use of magnesium is commonplace for small parts (brackets, instrument panel crossbars, seating brackets, etc.), and the use of plastics and composites will continue to increase in nonstructural areas.
Although aluminum bodies have been around for many years (semimonocoque or unibody), they have been directed at niche, high-end vehicles; Europe has been a leader (Audi and Jaguar). The trend toward the aluminum unibody is a more recent development for use in mainstream vehicles (over 50,000 per year), and the U.S. auto companies are evaluating this approach. Unibody is important because it is the dominant architecture used for mainstream vehicles today. Whether or not aluminum unibody vehicles migrate to higher volume vehicles will depend on how aggressive OEMs need to be to reduce mass (i.e., depending on fuel economy legislation and the availability of other fuel-saving technologies) and if aluminum processing costs come down.
Model Years 2020 to 2025
The production of optimized mixed-material vehicles using greater quantities of aluminum, magnesium, and composites is expected to become more widespread. Incremental steps will continue to be made each year with these materials on a case-by-case basis, using a material substitution approach (one part at a time) and leading eventually to the more complex optimized vehicle design beyond the next 10 years. There will still be significant opportunities to improve the vehicle structure beyond this time frame with additional mixed-material optimization.
Costs for Mass Reduction
Auto manufacturers recognize the need to reduce vehicle mass to improve performance and efficiency. Technologies that reduce mass without compromising crashworthiness are available. Thus, cost becomes the main constraint, although there remain other barriers, including supply chain challenges, integration into existing vehicle architectures, technology risk, and so on. It is generally recognized that mass increases in automobiles in recent years have resulted from improving personal comfort features, crashworthiness, performance attributes such as ride quality (noise, vibration, and harshness) and acceleration (bigger and heavier powertrains), and meeting regulatory requirements for safety (crashworthiness) and emissions. The use of advanced materials and design techniques has mitigated additional increases in mass from these consumer-oriented trends. An expected outcome of today’s regulations for fuel economy and emissions is greater focus on net mass reduction. The shift in priority from merely mitigating mass increases to achieving net mass decreases across the fleet is expected to realize 15 percent less weight by 2025. There will be a cost to achieve this result, but evolving industry transformations will help to contain it. Automakers will also have to respond to future regulations that will necessitate additional mass (e.g., NHTSA estimates an additional 100 to 120 lb. to the vehicle through 2025), but the net weight reduction is still anticipated to be 15 percent.
Mass Reduction Pathways and Challenges
The pathways to lightweight vehicles are not substantially different across manufacturers for similar, competing car models. With exceptions for performance-oriented vehicle designs, the costs and complexity generally progress as follows:
- Mild steel to high-strength steel (for structural parts and components such as seats) and composites/plastics
-
for nonstructural or semistructural parts (trim, oil pan, wheel well, brackets);
- Steel to aluminum hang-on panels (hoods and deck lids) and limited use of small amounts of magnesium for brackets;
- Steel doors to aluminum doors, and additional aluminum in chassis components; and
- More aggressive use of high-strength steel, aluminum, magnesium, and composites for other structural components and, potentially, an aluminum-intensive body and chassis.
The Electricore/EDAG/GWU study of the 2011 Honda Accord developed design and cost analysis for four scenarios that reflect this progressive lightweighting strategy (Singh 2012). There are a number of reasons automotive manufacturers usually prefer smaller, incremental implementations of mass reduction techniques in vehicle designs as opposed to approaches that might require a complete vehicle redesign and an aggressive substitution of lightweight materials. A few are mentioned here:
- Limited or Constrained Resources: to launch new technologies, a company’s access to resources such as staffing and materials can be a limiting factor.
- Risk Aversion: implementation of a new technology always carries new risks, and the tolerance for risk is limited. Lightweighting risks are related to crashworthiness, corrosion, noise, and vibration;
- Engineering Constraints and Design Considerations: sharing of components across multiple car platforms constrains flexibility in re-designs, including powertrain components and body and chassis parts. Standardized product design and processing methods that have been globally implemented require revision, with cascading effects on other products and processes; and
- New Material Supply Chain: the development of a reliable and robust supply chain can be obstacle to including lightweight materials in a vehicle design. A design requiring the use of a new material versus the development of a supply chain for a new material has always been a “chicken-and-egg” challenge that can impede innovation. For example, during the writing of this report, the aluminum supply chain is at capacity for at least 30 months due to the volume that will be consumed by the new aluminum-intensive 2015 Ford F-150 truck design.
The launch of the 2015 Ford F-150 is clearly seen as transformational and not incremental. The decision to produce a truck with an all-aluminum body is seen as a bold move. Though aluminum bodies have been produced before, they have not been used in a high-volume truck. The success of this product will be of interest to many people in both the aluminum supply chain and the automobile industry. If significant problems arise, they will hinder future aggressive lightweighting efforts; if successful, the trend toward high-volume, aluminum-intensive vehicles will accelerate.
The progression of lightweighting materials includes a progression to more diverse and, in some cases, complex processes. Automakers are in general agreement that a closer-to-optimal vehicle design is coming, and it will include a more diverse mix of materials (especially mild steel, high-strength steel, aluminum, magnesium, and composites). This is referred to as the mixed-material car, and the trend today is along this pathway. The mixed-material car will not be less crashworthy, and it will be better engineered for mass and performance. This diversity offers more potential to eliminate mass even while reducing costs. However, the transformation to a more complicated vehicle will take time. The modeling software (CAE) must be developed, and the supply chain steps for materials, tooling, fabricating, and joining will all become more diverse, perhaps in some cases reducing economies of scale (for example, it may prohibit the sharing of parts for a single set of tools across vehicles). An example of the complexity that comes with the mixed-material car is joining. In addition to spot welding (today’s dominant joining technology for sheet metal), there will be continued growth in laser welding, friction stir welding, multiple grades of weld-bond adhesive, crimping, fastening, etc. Modeling software will be needed for the joining methods required for different materials, increasing the engineering investment. The industry is on this pathway, but it will take decades before coming close to realizing its full potential.
Mass Reduction Cost Considerations
Projecting the future cost to reduce mass is very difficult. Modest lightweighting opportunities arise regularly that may be very low cost (or even negative cost) because of technological advances in materials or related technologies, and these can be implemented on new vehicle models on a material substitution basis. While several idealized studies expect total vehicle lightweighting costs to be low, auto manufacturers generally see many factors that result in higher costs. The Honda Accord and Toyota Venza studies on mass reduction have yet to be proven feasible from the manufacturing, consumer acceptance, or engineering perspectives. When auto manufacturers develop physical prototypes of vehicles, they invariably add mass to achieve a variety of performance requirements. As mentioned earlier, when lightweighting, automotive manufacturers have many variables and performance constraints or objectives to consider that affect cost—for example, crashworthiness, stiffness, noise transmission, commonly shared parts, different product life cycles and system integration.
There are continual improvements in modeling software that have reduced the lead time and development costs for introducing new designs. These modeling tools are being developed in academia, industry, and government and non-
government organizations. As the new materials and joining have evolved to improve the structure, the software has also evolved to simulate crashworthiness. With better modeling analysis, the development speed improves, and the need to add inefficiently designed reinforcements late in the program is significantly reduced. However, to remain useful, the modeling software must stay current with new materials and new joining techniques, which can be a challenge.
It is broadly accepted that the cost of reducing mass increases with the percent of mass reduction. The four scenarios from the NHTSA/Honda Accord study below demonstrate this. Honda has issued its report on the results under Scenario 2 and suggested that the actual weight savings under this scenario is only 53 percent of the anticipated study results: 175 kg instead of 332 kg. Honda did not directly address cost, but much of the weight difference would result in additional cost as material is added back to resolve the design problems. The committee recognizes that customer acceptance and vehicle safety are major concerns when developing any vehicle design that aims to implement significant mass-reducing techniques. It is also reasonable that these concerns would apply constraints to the vehicle design that limit the extent to which lightweighting techniques can be applied. However, the committee feels it would be an ineffective approach for an OEM to design and produce a lightweighted vehicle design that does not factor in these constraints early in the design phase and then revisit the design in order to meet safety requirements and customer acceptance issues. Thus the committee is not able to judge what the net effect would be of addressing Honda’s concerns through clean sheet design.
The automotive industry today is generally operating under Scenario 1 from the EDAG Study (AHSS dominant), with movement toward Scenario 2 expected over the next few years (Table 6.7). Scenario 3, with aluminum body-in-white, could generally occur (across multiple models) in the 2020 to 2025 timeframe, but likely only for a few models of vehicles, and that may be held back if supply chain problems occur or costs are significantly higher than shown below. Again, this emphasizes the importance of the F-150 launch.
A brief compilation of several sources for estimating the cost of weight reduction are summarized in Table 6.8 along with comments regarding the studies.
Derivation of Cost per Pound of Mass Reduction from EDAG Study
The results of the NHTSA-sponsored study to evaluate mass reduction opportunities on the 2011 Honda Accord provide insight into opportunities for reducing vehicle weight. The chart below, taken from the study, illustrates the exponentially increasing cost as more weight is removed. There is general acceptance of the exponentially increasing cost curve for reducing mass, with the initial cost for lower levels of mass reduction starting at or below zero (i.e., cost savings). Progressing up the curve to reduce more weight incurs higher costs as different mass reduction strategies are employed (Figure 6.3).
A similar analysis has also been performed on the 2014 Silverado pickup truck, demonstrating an exponentially increasing cost curve as more mass is removed. The Silverado study is currently under peer review; however, as expected, the cost estimates to remove mass are greater than for the Honda vehicle. This is due, at least in part, to truck performance requirements for towing and cargo capacity that limit weight reduction, especially secondary mass decompounding with engine and transmission downsizing.
Automaker responses to independent mass reduction studies have been mixed. The studies offer creative insight into new design concepts, often using near-term-future technologies. However, they are also developed without many of the business constraints a manufacturer has to manage. For this reason, the mass reduction and cost estimates from independent studies are recognized as obtainable under ideal
TABLE 6.7 Summary of Results from Electricore/EDAG/GWU Study Sponsored by NHTSA
| Scenario (increasing aggressiveness): | |||||||||||||||||||
| 1 | 2 | 3 | 4 | ||||||||||||||||
| BIW | AHSS | AHSS | Aluminum | Composite | |||||||||||||||
| Closures | AHSS | Aluminum | Aluminum | Aluminum/magnesium | |||||||||||||||
| Chassis | AHSS | Aluminum | Aluminum | Aluminum | |||||||||||||||
| Seats | AHSS | Magnesium | Magnesium | Magnesium | |||||||||||||||
| Mass savings (kg) | 284 | 332 | 372 | 421 | |||||||||||||||
| Total ($) | 111 | 319 | 927 | 2,719 | |||||||||||||||
| $/lb | 0.18 | 0.44 | 1.13 | 2.94 | |||||||||||||||
| Mass reduction(with powertrain) (%) | 19.2 | 22.4 | 25.1 | 28.5 | |||||||||||||||
NOTE: BIW, body in white; AHSS, advanced high-strength steel.
SOURCE: Summary results from Electricore/EDAG/GWU study sponsored by NHTSA (2012).
TABLE 6.8 Analysis of Mass Reduction Studies and Results
| Description of Study/Source | General Results | Comments | |||||||||||||||||
| Toyota Venza Phase 2 Funded by EPA (+ International Council on Clean Transportation & Environment Canada) FEV, EDAG, and Munro Consultants Expand initial Lotus mass-reduction study and propose alternatives Target: 20% vehicle weight loss at minimum cost Use 2010 MY (2007 launch/3,772 lb.) Use current manufacturing technologies; cost effective for 2017-2020 production |
• Strong emphasis on CAE optimization methodology. • Requires a comprehensive product development process. Consultants believe the optimization approach can be implemented. • High-strength steel, aluminum, component downsizing, thin glass, magnesium parts, lighter shocks, smaller wheels, downsize engine. • Vehicle: 689 lb reduced, 18% of vehicle. • Cost saved is $134/vehicle, $0.20 per lb saved (includes cost of tooling). |
• Analysis is based on 2007 vehicle 10 years into future; doesn’t consider added mass for crash, emissions, or driver comfort. • Some gauges and grades not commercially available. • Proposed magnesium, “too expensive” (except premium cars). • Thinner glazing and wheels transmit noise and vibrations. |
|||||||||||||||||
| 2011 Honda Accord Funded by NHTSA Baseline vehicle: 27 mpg combined Electricore, EDAG, GWU Consultants Not to exceed 10% cost premium Technology/cost estimates for 2017-2025 |
• Simulated crashworthiness and overall vehicle performance. • Body mostly HSS with all-aluminum closure panels, some magnesium. • Recognized that magnesium doors were not practical. • 22.4% total vehicle weight savings (intermediate scenario) = 730 lb, resulting in $0.44/lb cost premium (slightly different results for different scenarios). |
• Good study and identification of technologies are consistent with industry direction. • Overall performance of lightweighted vehicle is compromised. • Performance critique: handling, ride/comfort, noise, and safety (crashworthiness). • Business constraints: platform commonality. • OEM accepts 53% of downsizing/LW opportunity. |
|||||||||||||||||
| NRC, 2011, Assessment of Fuel Economy Technologies for Light-Duty Vehicles, “Non-Engine Technologies,” Table 7.8 |
• 1%, $1.41/lb • 5%, $1.65/lb • 10%, $1.98/lb |
• Estimates for other reductions: |
|||||||||||||||||
| (%) | Low ($) | High ($) | |||||||||||||||||
| 1.5 | 1.28 | 1.53 | |||||||||||||||||
| 5.0 | 1.50 | 1.80 | |||||||||||||||||
| 7.5 | 1.65 | 1.98 | |||||||||||||||||
| 10.0 | 1.80 | 2.16 | |||||||||||||||||
| 15.0 | 2.01 | 2.19 | |||||||||||||||||
| 20.0 | 2.22 | — | |||||||||||||||||
| EPA/NHTSA, TSD, 2012 |
• Based on weighted average of various lightweighting studies. • Total cost = $4.36 × percent of mass reduction level (e.g., 10% mass reduction = $0.436/lb). • Maximum feasible mass reduction varies by vehicle size to meet safety neutrality requirement (0% for sub-compact and compact, 3.5% for midsize passenger car, 10% for large passenger car, 20% for minivan and light-duty truck). • NHTSA and EPA weighted scores independently. • Average of the two weighted scores used to reach a consensus value. • EPA estimate was $2.17 (e.g., 10% mass reduction = $0.217/lb). • NHTSA estimate was $6.49 (e.g., 10% mass reduction = $0.649/lb). |
• Estimates are significantly less than industry estimates. • Data based on an incomplete set of studies. |
|||||||||||||||||
| Description of Study/Source | General Results | Comments | |||||||||||||||||
| Auto manufacturer sentiment |
• Pathways to 2025 will focus primarily on more high-strength steel and aluminum. • Magnesium and composites will have minimal impact. • 10% to 15% achievable by 2025. • DMC net costs for 3 companies: (1) $1.80, (2) $2.50 for about 12%-15% mass reduction, (3) $2.22 for 7%). |
• Auto manufacturers consistently much higher than mass reduction studies by independent consultants. • Mostly conversion to aluminum-intensive body components. • Higher number ($2.50) not “optimized” vehicle with de-compounding (may be $1.92/lb) assuming 30% compounding. • Estimate range: $1.80 to $1.92/lb. |
|||||||||||||||||
| EPA, NHTSA, CARB |
• The relationship in the U.S. EPA/NHTSA 2012-2016 rulemaking assumed a constant $1.32/lb for vehicle mass reduction up to 10%. • The 2010 joint TAR (EPA, NHTSA, & CARB) modified the cost using a curve resulting in $0.43/lb for 10% mass reduction. • ARB weighted studies according to a formula that has multiple subcategories for each factor: Wstudy = Wdesign × Wcost ×Wpeer review (LEV III GHG TSD, December 7, 2011). |
• Change in cost estimation from $1.32/lb to $0.43/lb from the rulemaking to the joint TAR. • The heuristic weighting scheme and regression method for studies not well documented or validated. • Final scoring minimizing auto manufacturer input. Highest weight for 25 studies assigned to debated Lotus, 2010/Low Development Study. |
|||||||||||||||||
NOTE: GHG, greenhouse gas; CARB, California Air Resources Board; TAR, technical assessment report; LEV, low emission vehicle.
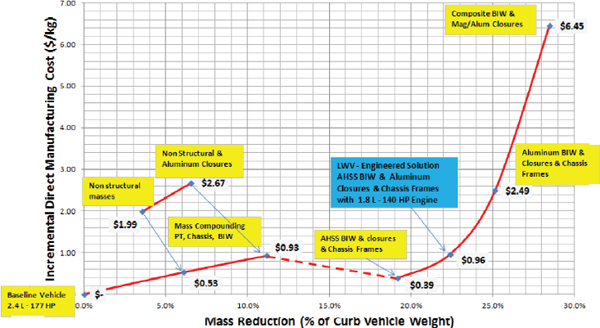
FIGURE 6.3 Cost per percent mass reduction from EDAG study of 2011 Honda Accord.
SOURCE: Singh (2012).
conditions and represent maximum mass reduction potential at the lowest potential cost. Several manufacturers have been consulted about lightweighting, and all have indicated that the cost to remove weight is much higher than the idealized studies indicate, generally starting at around $2.00/lb and increasing up to $4.00/lb or more (at levels of mass reduction from a few percent to 5-10 percent). In some cases, manufacturers support modest opportunities for “free” lightweighting (e.g., 1-2 percent). While there are opportunities to remove weight at low cost, concerns arise with the complexity of introducing new materials (e.g., magnesium and composite parts), their reliability over the life of the vehicle, and vehicle performance (vibration, structural performance such as stiffness, paint-ability, etc.).
Factors affecting mass reduction and cost that were raised by manufacturers include the following:
- Independent consultants are unaware of or unable to analyze complex interactions between vehicle subsubsystems affecting crashworthiness and other performance issues such as noise and vibration. The independent studies may provide generally good results, but they are incomplete. Many issues are only found when prototype vehicles are made and evaluated, generally resulting in countermeasures that add cost and weight.
- Given the competitive importance of ride and handling performance, automakers are very sensitive to technologies that affect this metric. Substituting advanced materials may be structurally sufficient but may adversely affect ride and handling, thus requiring various countermeasures to mitigate this unintended impact.
- Auto companies use many parts across multiple models or vehicle platforms and cannot, for practical reasons, optimize every part on every model of vehicle to maximize mass reduction. The sharing of parts is done for many reasons, including cost, quality, risk mitigation, and resource management. Similarly, some new materials/parts cannot be integrated easily into existing manufacturing facilities. Engines and transmissions are examples of systems used for multiple vehicles. In the Honda study, over 60 percent of the secondary mass savings was from downsizing the engine and transmission (see the section “Growing Impact of Global Platforms on Vehicle Design Optimization” in Chapter 7).
Committee’s Mass Reduction Approach
The committee follows the approach taken in many of the studies described earlier, by estimating costs for various materials-based approaches to reducing vehicle mass. In the following section, increasingly aggressive percentages of removing mass from a vehicle model design are described in Scenarios 1 through 6. These scenarios are the committee’s effort to generalize the selection of materials, engineering approaches, and common practices that OEMs will consider to achieve different percentages of mass reductions. It follows a progression where the lowest reductions are based on optimization and materials substitution; higher levels are achieved with replacing mild with high-strength steel and aluminum; and the highest levels are achieved through greater use of composites, including carbon fiber and other lighter metals such as magnesium. The scenarios do not include any weight additions that may be needed to meet future safety requirements. The two sets of values reported for these costs are based on two perspectives of how much mass reduction could be obtained for zero cost, a critical element for estimating the costs of mass reduction. The justification for applying these two different cost assumptions is based on two fundamental ideas. The committee considered both 0 percent and 6.25 percent to be plausible assumptions regarding the availability of zero-cost mass reduction. At the Society of Automotive Engineers (SAE) 2015 World Congress, a presentation from EPA highlighted possible subsystems that may offer zero net cost opportunities for mass reduction, with strategies such as implementing new component designs, material substitution and consolidation, and new material processing techniques (EPA/SAE 2015). These strategies entailed using new materials and designs in connecting rods and roller bearing and new materials, weather seals, and consolidating components in airbags. This approach is consistent with cost estimates for other technologies, where the committee’s most likely estimates include two values that are meant to represent not the full uncertainty range but rather the different possible most likely values based on expert views represented by the committee.
In order to be consistent with other estimates of cost and fuel consumption benefits in this report, the committee considered these improvements relative to a 2008/2010-era null vehicle. This is a challenge as there is less certainty in terms of materials and design for such a vehicle than there is regarding other technologies. Based on the committee’s expertise, such a vehicle is mainly steel, less than 10 percent aluminum, and a mix of other materials, with the steel being a mix of mild and high-strength steel, but with a higher fraction of mild steel. This is relevant for the use of vehicle-specific lightweighting studies by the Agencies. As described earlier, there have been several teardown/CAE studies to help assess the opportunity and cost for reducing mass in vehicles. These studies are difficult to generalize and apply to other vehicles because there is such wide variation across all vehicle models.
The committee’s cost estimates also consider mass reductions due to decompounding. The mass reduction studies have shown that powertrain downsizing can have the greatest secondary mass reduction benefit. However, because of the long life cycles of powertrains (vis-à-vis car models) and the fact that individual powertrains are shared across multiple vehicle platforms, the cost analysis (below) assumes
that powertrain downsizing occurs only when mass reduction is 10 percent or greater. Mass decompounding potential in trucks is less than in cars because of truck performance requirements, which significantly reduce the potential to downsize systems such as engine, transmission, wheels, tires, shocks, and brakes. For the purpose of this cost analysis, the committee assumes the mass decompounding potential in cars is 40 percent and in trucks, 25 percent. The effect of this difference on the cost estimates for trucks results in a 12 percent greater primary mass reduction cost per pound than in cars due to the 12 percent increase in primary mass removal required for the same total mass reduction (see Table 6-4). This assumption is applied by the committee throughout this analysis for all levels of mass reduction.
Scenario 1 – 2.5 Percent Mass Reduction
New materials and components are regularly developed over time that can reduce mass at negative to little or no cost, and there are often opportunities to introduce advancements to an existing vehicle. This occurs, for example, with advances in materials and design optimization. This scenario is one of the most debated because no vehicle is fully “optimized,” and introducing many small incremental lightweighting changes may not be cost effective. Additionally, what may be considered an “optimized” vehicle design today will continue to evolve as design techniques and industry’s increased experience with material substitution continue to improve over time. Manufacturers are also cautious about implementing some of these technologies because of concerns over customer satisfaction and possible compromises to vehicle performance. In the committee’s cost analysis, no decompounding is applied for this level of mass reduction. As described in the committee’s approach to mass reduction, the committee’s estimates of costs for a 2.5 percent mass reduction are based on two perspectives on how much mass reduction could be obtained for zero cost. One value is based on the perspective that an OEM will be able to achieve a 2.5 percent mass reduction in a vehicle design at no additional cost. The second value is based on the perspective that any mass removed from a vehicle design would come at a cost, and the committee estimates that a 2.5 percent mass reduction will likely cost $0.25/lb.
Scenario 2 – 5 Percent Mass Reduction
Nonstructural mass reduction was achieved without secondary mass reduction at a cost that ranged from $1.99/kg to $2.67/kg for approximately 5 percent mass reduction (EDAG 2012). There are material substitution opportunities with some items, such as wiring harness (aluminum), plastic trim, instrument panel parts, battery, tires, and lighting. Many of the opportunities and concerns outlined in Scenario 1 will continue to hold true for Scenario 2. As with Scenario 1, no decompounding is applied in the committee’s cost analysis for Scenario 2. Again, the committee recognizes that there will be circumstances where an OEM will be able to achieve a 5 percent mass reduction in a vehicle design at no additional cost. For circumstances that do not allow for any free mass reductions, the committee estimates that the cost of a 5 percent mass reduction to a vehicle design will likely be $0.50/lb.
Scenario 3 – 10 Percent Mass Reduction
The EDAG study resulted in a cost of $0.96/kg ($0.44/lb) for a 22.4 percent reduction in mass primarily using high-strength steel and aluminum closure panels. Necessary “countermeasures” (identified by Honda) to accommodate the mass reduction technologies and their additional mass requirements are listed below:
- Subframe safety, 0 lb (0 kg)
- Dashboard crashworthiness, 55.11 lb (25 kg)
- Side impact safety, 22.04 lb (10 kg)
- Rear crash safety, 33.07 lb (15 kg)
- Ride comfort; NVH; handling, 39.68 lb (18 kg)
- Other (miscellaneous), 15.43 lb (7 kg)
- Business conditions (platform parts), 88.18 lb (40 kg)
- Add-back for decompounding, 92.59 lb (42 kg)
Total, 346.13 lb (157 kg)
(346.13 lbs. reinstated by Honda to the EDAG study’s initial 730 lbs.)
Decreasing the initial mass reduction by 157 kg and adding cost for the material used by the countermeasures (157 kg × $1.20/kg = $188) results in $2.90/kg5 ($1.32/lb) for a net mass reduction of 11.8 percent. A 10 percent discount (estimated) to adjust for the added countermeasures and the higher cost for 11.8 percent mass reduction (versus 10 percent) reduces the cost to about $1.18/lb. In the committee’s cost analysis, a 40 percent decompounding is assumed for cars and a 25 percent decompounding is assumed for trucks. Allowing for 6.25 percent of the weight reduction at zero cost, the committee estimates a cost of $0.44/lb for 10% mass reduction. For situations where no mass is removed at zero cost, the committee estimates the likely cost for 10% mass reduction will be $1.18/lb.
Scenario 4 – 15 Percent Mass Reduction
This scenario analyzes a conversion to an aluminum car body for a 3,800 lb vehicle using data from the EDAG study with other estimates (Table 6.9). The steel body weighs approximately 863 lb, and the aluminum equivalent body is estimated to be 40 percent lighter than the steel body. The closure panels (hood, deck lid, and four doors) can also be
_____________
| Steel | Aluminum | Difference | Comments | ||||||||||||||||
| Vehicle Weight | 3800 | Curb weight | |||||||||||||||||
| Final Body Weight (BIW) (lbs) | 863 | 518 | 345.3 | 40% | From EDAG study (BIW) | ||||||||||||||
| Al BIW 40% lighter than steel | |||||||||||||||||||
| Offal | 1.4 | 1.4 | 40% industry average for scrap | ||||||||||||||||
| Total Required Material (lbs) | 12009 | 725 | -483.4 | Pounds | |||||||||||||||
| Average Cost ($/lb) | $0.50 | $2.00 | Various Steel/Aluminum grades | ||||||||||||||||
| Total Material Cost | $605 | $1,450 | |||||||||||||||||
| Offal (lbs) | 345 | 207 | -138.1 | ||||||||||||||||
| Offal Value | $0.10 | $1.10 | Scrap value per pound | ||||||||||||||||
| Offal Recycled (lbs) | 311 | 186 | 0.9 | Pounds recycled per BIW | |||||||||||||||
| Reclamation Value | -$31.08 | -$205.12 | -$174 | Material less recycled scrap | |||||||||||||||
| Net Total Mtl. Cost | $573.61 | $1,245.22 | $671.61 | Estimate: weld/adhesive/fasteners | |||||||||||||||
| Joining Cost | $250 | $500 | $250 | Steel: $0.05 – 4000 spot welds BIW Cost | |||||||||||||||
| Total Material Assembly | $824 | $1,745 | $922 | ||||||||||||||||
| Mass Reduction Analysis | |||||||||||||||||||
| Body (lbs) | 863 | 518 | 345.3 | ||||||||||||||||
| Closures (lbs) | 367 | 277 | 89.9 | From EDAG Study (doors, hood, lid) | |||||||||||||||
| Decompounding (lbs) | 0 | -174 | 174 | 40% of total mass reduction | |||||||||||||||
| Total | 1230 | 621 | 608.9 | ||||||||||||||||
| Total | 16% | ||||||||||||||||||
| Cost Analysis | |||||||||||||||||||
| Body | $824 | $1,745 | $921 | ||||||||||||||||
| Closures | $141 | Costs from EDAG Study | |||||||||||||||||
| Decompounding | -$174 | $1.00 | Assume $ value per pound saved | ||||||||||||||||
| Total | $888 | ||||||||||||||||||
| Cost per Pound Mass Reduction | $1.46 | ||||||||||||||||||
made from aluminum. Recognizing increases in the average material cost (about $2.00/lb for aluminum versus $0.50/lb for steel), recycling of waste material (recycling value of $1.10/lb for aluminum and $0.10/lb for steel), and the additional costs for joining (aluminum joining estimated to cost twice as much as steel), a $921 cost increase was estimated for the aluminum body-in-white (BIW). The cost increase for aluminum closures (hood, deck lid and four doors), modified from values in the EDAG study (not shown in the EDAG chart above, but available in the study), was $141.10 for a 89.9 lb weight reduction. Mass decompounding is estimated at 40 percent of the weight savings and returned the value of $1.00/lb saved (see EDAG Cost Study–2011 Honda Accord; aluminum closure cost estimation in Singh 2012).
In the analysis below, the conversion from steel to aluminum for the BIW and the closures is estimated to cost $888 to save 609 pounds, or $1.46/lb. Hence the committee estimates the cost of 15 percent mass reduction at $1.46/lb, assuming no mass reduction is available at zero cost. Alternatively, if 6.25 percent weight reduction is available at zero cost and the next 8.75 percent costs $1.46/lb, the cost estimate for 15 percent lightweighting is $0.86/lb.
Scenario 5 – 20 Percent Mass Reduction
This scenario approaches the most aggressive scenarios on the EDAG chart (similar to Option 3). In addition to an aluminum-intensive body and 40 percent mass decompounding, the aggressive use of magnesium components and composites is needed. The hood and roof will be composite, and the doors may be a combination of high-strength steel, composite, aluminum, and magnesium. Cost estimates (per pound) increase over the 15 percent scenario above, but by how much is difficult to estimate. While possible to imple-
ment, high-volume manufacturers struggle more with plastic/composite body panels because of quality (dimensional stability and surface finish) and paintability of nonmetals. The EDAG report adequately points out a number of these risks and manufacturing trade-offs. Twenty percent mass reduction (rather than 25 percent) may be more achievable for volume manufacturers through 2025 as they compromise on some of the options outlined in the EDAG report. Assuming all mass removal will have a cost, 20 percent total mass reduction is estimated at $2.03/lb. Allowing instead for 6.25 percent of the mass to be removed at zero cost, the committee estimates that a 20 percent reduction is achievable at $1.40/lb.
Scenario 6 – 25 Percent Mass Reduction
This is the most aggressive scenario, with composite body panels (carbon fiber) and aggressive use of aluminum and magnesium, along with aggressive decompounding. Expect both cost and mass reduction opportunities to be somewhat less than the EDAG chart due to risks and trade-offs. Limitations arise from quality (dimensional stability), joining complexity (extensive use of adhesives with greater complexity), production cycle times (composites process much slower than metal), long-term reliability, and recycling. Although this mixed-material pathway is the most promising, it also needs the greatest amount of development and supply chain advancement. Significant progress will be made with this technology by 2030 and beyond. For scenarios that do not allow any percentage of free mass removal, the cost is likely to be $3.28/lb. Assuming that 6.25 percent of the vehicle mass is removed at no cost, removing 25 percent of the mass from a vehicle design is likely to cost $2.46/lb.
Learning
Each of the six scenarios above is progressively more complex in terms of the design, development, and manufacturing of the vehicle. The amount of learning, and associated cost reduction, should be considered. For the most part, Scenarios 1 – 3 will have minimal learning associated with them. The major technology changes for Scenarios 1 – 3 rely mainly on material substitution: high-strength steel for mild steel and aluminum for steel. One of the positive attributes of these lightweighting pathways is that the metals are similar in many ways and use much of the existing steel infrastructure (predictive design, fabrication, and assembly). Furthermore, all auto manufacturers have experience with these materials and have been working with them for several years. The learning curve for aluminum is largely confined to the development phase for launching a new plant (which takes months, not years). The cost estimates for Scenarios 1 – 4 are essentially mature and are not expected to achieve any significant cost reductions.
Scenarios 5 and 6, however, have significant opportunity for learning and cost reduction. Most manufacturers have limited experience with mixed-material vehicles, especially those involving composites in high-volume production (over 100,000 units/year). Composites are the least standardized material relative to the metals used in automotive applications. More reinforced composites (glass and carbon), such as those proposed in Scenario 6, are often referred to as “engineered solutions” because their chemistries are uniquely developed for a specific application. Scenario 5 entails broader use of plastic and composites, along with adhesives and fasteners, which all have learning opportunity at mass production. Scenario 6 is similar, but with even greater complexity due to the more sophisticated engineered materials. Estimates for the learning potential for the six scenarios are listed in Table 6.10.
Fuel Consumption
Ricardo conducted a modeling study for fuel economy effectiveness; the results are summarized in Table 6.11. The fuel economy improvement is converted to fuel consumption improvement using the following formula:
![]()
This formula was used to convert the fuel economy improvement estimates in Table 6.11 to fuel consumption reduction estimates in Table 6.12 by using a value of 10 percent mass reduction as a midpoint for the range of mass reduction levels considered in this study.
TABLE 6.10 Learning Factors for Levels of Mass Reduction
| Mass Reduction (%) | Scenario | 2012 | 2017 | 2020 | 2025 | ||||||||||||||
| 2.5 | 1 | 1.00 | 1.00 | 1.00 | 1.00 | ||||||||||||||
| 5 | 2 | 1.00 | 0.994 | 0.991 | 0.985 | ||||||||||||||
| 10 | 3 | 1.00 | 0.985 | 0.975 | 0.960 | ||||||||||||||
| 15 | 4 | 1.00 | 0.969 | 0.951 | 0.920 | ||||||||||||||
| 20 | 5 | 1.00 | 0.962 | 0.938 | 0.900 | ||||||||||||||
| 25 | 6 | 1.00 | 0.942 | 0.908 | 0.850 | ||||||||||||||
| Passenger Vehicle | Truck | ||||||||||||||||||
| Base Engine | Downsized Engine | Base Engine | Downsized Engine | ||||||||||||||||
| Gasoline | 0.33% | 0.65% | 0.35% | 0.47% | |||||||||||||||
| Diesel | 0.39% | 0.63% | 0.36% | 0.46% | |||||||||||||||
TABLE 6.12 Reduction in Fuel Consumption per Percent Mass Reduction (percent)
| % Improvement in Fuel Economy per % Weight Reduction, EPA Combined Drive Cycle (Fuel Consumption Equivalent in Brackets) | |||||||||||||||||||
| Passenger Vehicle | Truck | ||||||||||||||||||
| Base Engine | Downsized Engine | Base Engine | Downsized Engine | ||||||||||||||||
| Gasoline | 0.33% (0.32%) | 0.65% (0.61%) | 0.35% (0.338) | 0.47% (0.449) | |||||||||||||||
| Diesel | 0.39% (0.375%) | 0.63% (0.592%) | 0.36% (0.348) | 0.46% (0.440) | |||||||||||||||
Mass Reduction Effectiveness
A measure of technology effectiveness (TE) is to divide the technology cost by the fuel consumption benefit. The smaller the TE, the more appealing the technology is for its cost effectiveness in reducing fuel consumption. A cost-effective pathway to reduce fuel consumption can use TE to prioritize the most cost-effective technologies to achieve a fuel consumption target. There are reasons, however, why companies might not always follow the TE ranking.
In addition to TE, two factors that affect the relative appeal of technology selection are availability and performance. A technology may be unavailable or have risk associated with it (e.g., supply chain or technology risk) that a manufacturer wishes to avoid. In lightweighting, for example, there is a potential for a material shortage if there is a major change in the market affecting supply or demand, as may be the case for aluminum today. In the case of performance, most technologies impact the driver in ways other than fuel consumption. Manufacturers vigorously compete across car models, focusing on vehicle performance experienced by the driver, for example, in these ways:
- Safety (crashworthiness),
- Steering feel,
- Driving responsiveness,
- Ride comfort,
- Noise from wind or the road,
- Vibrations, and
- Acceleration and stopping.
Noise and vibration concerns have been raised by the manufacturers in connection with the lightweighting studies, and they have indicated that countermeasures for these attributes are necessary. Crashworthiness is maintained or improved with all lightweighting designs (or the designs are modified to be safe). The other attributes (steering feel, driving responsiveness, acceleration, and stopping) can all be improved with lighter vehicles. As discussed earlier in this chapter, these attributes are important competitive differentiators that might favor lightweighting, even with a less competitive fuel economy cost effectiveness than other technologies that might degrade one or more performance attributes.
Table 6.13 summarizes the committee’s estimates for the costs and effectiveness of mass reduction. As with its other cost estimates, committee members held a range of views on the best estimates of cost and effectiveness, and Table 6.13 reports the range of most likely values based on expert views of the committee. It is also important to repeat that these values are not meant to represent the full range of possible values for technology cost and effectiveness. This is especially true for mass reduction. The committee concluded that the uncertainty surrounding the cost of mass reduction is particularly large due to the wide array of approaches for reducing mass and the observation that each particular vehicle model is at a different starting point in terms of mass reduction opportunities. This is in contrast to SI technologies, where the step from naturally aspirated engines to turbocharged-downsized engines is a fairly distinctive step and much more common across OEMs.
Safety
When determining the maximum potential CAFE standards, NHTSA must assess whether a new technology or change in vehicle design to save fuel will have implications
| Midsized and Large Cars (3,500 lbs and 4,500 lbs) | |||||||||||||||||||
| Mass Reduction (%) | Cost Estimates Include Decompound | Percent Reduction in Fuel Consumption (%) | Most Likely Cost Estimates ($ per lb) | TSD Estimates for 2017 | |||||||||||||||
| 2017 | 2020 | 2025 | |||||||||||||||||
| 2.5 | No | 0.80 | 0.00 - 0.25 | 0.00 - 0.25 | 0.00 - 0.25 | $0.11 | |||||||||||||
| 5 | No | 1.60 | 0.00 - 0.50 | 0.00 - 0.50 | 0.00 - 0.50 | $0.22 | |||||||||||||
| 10 | Yes | 6.10 | 0.44 - 1.18 | 0.43 - 1.17 | 0.43 - 1.15 | $0.44 | |||||||||||||
| 15 | Yes | 9.15 | 0.86 - 1.46 | 0.84 - 1.43 | 0.82 - 1.39 | $0.65 | |||||||||||||
| 20 | Yes | 12.21 | 1.40 - 2.03 | 1.37 - 1.98 | 1.31 - 1.90 | $0.87 | |||||||||||||
| 25 | Yes | 15.26 | 2.46 - 3.28 | 2.37 - 3.16 | 2.22 - 2.96 | $1.09 | |||||||||||||
| Light-Duty Trucks (5,500 lb) | |||||||||||||||||||
| Mass Reduction (%) | Cost Estimates Include Decompound | Percent Reduction in Fuel Consumption (%) | Most Likely Cost Estimates ($ per lb) | TSD Estimates for 2017 | |||||||||||||||
| 2017 | 2020 | 2025 | |||||||||||||||||
| 2.5 | No | 0.85 | 0.00 - 0.28 | 0.00 - 0.28 | 0.00 - 0.28 | $0.11 | |||||||||||||
| 5 | No | 1.69 | 0.00 - 0.56 | 0.00 - 0.56 | 0.00 - 0.55 | $0.22 | |||||||||||||
| 10 | Yes | 4.49 | 0.49 - 1.32 | 0.49 - 1.31 | 0.48 - 1.29 | $0.44 | |||||||||||||
| 15 | Yes | 6.73 | 0.96 - 1.64 | 0.94 - 1.60 | 0.91 - 1.55 | $0.65 | |||||||||||||
| 20 | Yes | 8.98 | 1.56 - 2.27 | 1.53 - 2.22 | 1.47 - 2.13 | $0.87 | |||||||||||||
| 25 | Yes | 11.22 | 2.76 - 3.67 | 2.65 - 3.54 | 2.49 - 3.31 | $1.09 | |||||||||||||
for the safety of the vehicle’s passengers. It is the Agency’s goal to draft rules that encourage manufacturers to develop solutions that maintain, or increase, safety while improving fleet fuel economy.
In order to discourage OEMs from improving fuel economy by simply making vehicle models smaller and lighter, NHTSA fuel economy regulations are based on vehicle models’ length and width (or “footprint”) rather than their weight or mass (this approach was recommended in the NRC [2011] Phase One report). In this section, the committee assesses recent evidence about the effects of reducing vehicle mass while maintaining footprint. At the time this report is being written, however, even the most comprehensive analyses and studies are challenged to isolate the effects of design from the multiple causes of crashes and their severity. Over the past 10-15 years, the understanding of the relationship between mass and safety has been enhanced by consideration of the role of vehicle footprint (as opposed to the role of mass) in occupant protection. However, even these analyses are confounded by driver and environmental influences on safety outcomes, as described below.
The biggest contributors to a fatal collision are commonly viewed as: (1) the driver, (2) the environment, and (3) the vehicle(s). For the purposes of this report, the committee focuses on the vehicle’s role in providing occupant protection in the event of a crash and, more briefly, vehicle characteristics that may assist in avoiding crashes. However, the committee acknowledges the importance of the driver and the environment to safety and touches on both to give perspective on the safety implications of reducing mass in vehicles.
Driver behavior has long been recognized as the single biggest factor in the cause, or avoidance, of a fatal collision (Evans 1991). However, driver behavior in crashes (risky driving, distraction) and driver judgment and skills are extremely difficult to measure. Instead, researchers attempting to estimate the roles of mass and footprint on vehicle safety in statistical analysis rely on proxy measures of driver behavior associated with crashes, such as gender and age. Available proxy measures of driver characteristics, however, are crude and therefore imperfect for separating driver from vehicle characteristics in isolating the effects of mass reduction on vehicle occupant protection. A NHTSA study (Singh 2012) demonstrated that drivers under 30 or over 70 are more likely to be at fault in a two-vehicle crash than drivers between 30 and 70. An Insurance Institute for Highway Safety (IIHS) study (McCartt and Teoh 2014) for the years 2008 to 2012 stated that 28.5 percent of fatalities of drivers between the ages of 15 and 17 years old occurred in small vehicles. Midsized and large cars accounted for 23.4 percent and 11.7 percent of fatalities, respectively. While lighter-weight vehicles are capable of being more nimble and therefore may be better able to avoid crashes, younger male drivers also tend to drive vehicles at higher speeds, resulting in higher crash rates and, presumably, higher impact speeds (Wenzel
2012b). The speed at impact in crashes, however, is not measured, which further illustrates the difficulty and complexity of any analyses attempting to isolate the role of mass reduction and vehicle size from other causal factors (Singh 2012).
Environmental factors, such as highway design and traffic patterns, are understood to be the second biggest determinants of whether a crash will be fatal (Evans 1991). Although designed for higher speeds than other roads, rural interstates have the lowest fatal crash rates per mile driven of all highway classes; design minimizes opportunities for vehicles to conflict by eliminating crossing intersections and reduces the severity of crashes by having wide medians, shoulders and crash barriers that reduce opportunities for vehicle impacts and reduce the severity of the impacts that occur (GAO 2004). Rural two-lane roads, in contrast, often post high speeds relative to design, offer opportunities for vehicles to conflict at driveways and intersections, and provide less protection to avoid vehicles striking fixed objects off the roadway. Characterizing the specific environmental conditions under which each accident occurred is difficult, however, because minimal details are provided about roadway design and operating conditions in the police crash reports that researchers rely on in statistical analyses of vehicle safety. Crash reports provide basic information about time of day, visibility, and type of roadway, but not about the specific traffic characteristics that existed at the time of a crash or local design features that may have contributed to the cause and severity of the crash.
Vehicle Size, Vehicle Mass, and Crash Physics
One of the most common generalizations about mass and safety, often referred to as “the simple physics argument,” is that all else being equal, the passenger in the lighter vehicle is at more risk than the passenger in the heavier vehicle. Other vehicle attributes, driver characteristics, and crash circumstances have a much greater effect on fatality risk than a reduction in vehicle mass or footprint (Wenzel 2012a). Even so, occupants of smaller vehicles are at greater risk of fatality in crashes, particularly in a crash with a vehicle of greater mass. When discussing the vehicle itself, the most comprehensive statistical analyses to date suggest that vehicle footprint has a greater influence on fatality risk than vehicle mass (Wenzel 2012a). The 2012 NHTSA study (Singh 2012) and the Dynamic Research, Inc. (DRI) analysis (Kebschull and Sekiguchi 2008) are in agreement that, in cars, reducing vehicle mass and footprint is associated with a higher risk of fatality than if mass is reduced while holding footprint constant. By reducing footprint, a vehicle is more likely to have less crush distance6 to absorb crash forces, and this may increase the propensity for a vehicle with a high center of gravity to roll over. The DRI studies estimated the effect of mass reduction while holding footprint constant and identified the effects of the separate components of footprint, track width, and wheelbase on fatality risk. One of the major findings from the DRI study is that holding mass constant and increasing vehicle footprint improved societal safety. Second, holding vehicle size constant while increasing mass increased societal risk.7 A reduction in crush distance resulted in a passenger’s body absorbing more of the kinetic (impact) energy over a shorter period of time. Unlike if mass is increased, if size is increased while also improving safety design, safety will improve by reducing rollovers by providing a wider track width, or lowering the vehicle’s center of gravity, and/or adding crush distance and improved design of the occupant compartment to better absorb impact forces. Additionally, the most recent analyses done by NHTSA, Lawrence Berkeley National Laboratory (LBNL), and DRI all seem to suggest that fatalities per vehicle miles traveled (VMT) will increase if footprint were reduced, holding mass constant. However, these studies are in agreement that if mass is reduced from the heaviest light trucks, societal fatality risk will decrease slightly (Wenzel 2012a; Kahane 2012). According to these studies, there appears to be a greater increase in risk when 100 lb is removed from lighter-than-average cars (< 3,106 lb) than when 100 lb is removed from heavier cars. In addition, based on the results of these studies, removing a greater percentage of mass from heavier vehicles and a smaller percentage of mass, if any, from lighter vehicles appears to maintain societal safety while improving fuel economy, which is in agreement with the TSD (EPA/NHTSA 2012b).
The DRI studies also separated the two components of fatality risk per VMT—crash probability (crashes per VMT) and crash outcome (fatalities per crash)—and found that, for lighter-than-average cars, mass reduction is associated with a large increase in crashes per VMT but a small decrease in fatalities per crash, leading to a net increase in fatalities per VMT. This is important because there is no obvious explanation for this result except that it might be a spurious correlation between mass and driver behavior (DRI and NHTSA seem to agree on this). It is possible that male or younger drivers are more robust than female or older drivers and therefore more likely to survive a crash. Another possible explanation is that the time of day at which the crash occurred was not taken into account in the analysis. Additionally, since heavier or larger vehicles may suffer less damage, these crashes may not be reported as regularly as crashes involving smaller or lighter vehicles. The DRI studies addressed other considerations left out, such as NHTSA’s use of a single exposure measure (choice of exposure measure from among reasonable alternatives changes the significance and signs of
_____________
6 Crush distance is the distance over which forces are absorbed during a crash.
7 In this report, societal risk is used to describe the statistical probability of a fatality occurring for the occupants of the subject vehicle, the occupants of any involved vehicle(s), and any pedestrians or cyclists involved in a given crash. Personal risk, or occupant risk, is the statistical probability of a fatality occurring for only the occupants of the subject vehicle.
some key coefficients, indicating that results are not robust). NHTSA concludes that the DRI two-stage regression model does not cleanly separate the effects of crash avoidance and crashworthiness (Kahane 2012, Section 4.6). However, NHTSA concludes that this problem does not affect the baseline model of fatality risk per VMT since it combines the effects of mass reduction on both crash frequency and fatality risk per crash.
Identifying the effects of vehicle attributes on vehicle safety is challenging because driver behavior is many times as important as vehicle attributes in determining crash probability and severity, and vehicle crashes have complex causal factors that are often difficult to observe and measure. As a consequence, even small correlations between relevant driver behaviors and vehicle attributes, given that behavior is less than perfectly represented in a model, will result in spurious correlations that can easily dominate the results. Therefore, it may not be surprising to find that statistical analyses of the effects of vehicle mass and size on safety do not produce robust inferences for every vehicle class and size. However, in nearly every case that mass was removed from lighter-than-average cars, there was a slight statistically significant increase in fatality risk. Under such circumstances, willingness to explore alternative hypotheses and to test the robustness of results is critically important. DRI and LBNL suggested and conducted 19 sensitivity analyses to test the robustness of the baseline NHTSA regression model. For the most part, the effects estimated by the NHTSA baseline regression model are in the middle of the effects estimated by the 19 alternative regression models, and the effects of the alternative models are within the level of uncertainty of the baseline NHTSA regression model. In the NHTSA baseline model, the (positive) mass reduction coefficient is statistically significant for lighter-than-average cars only; the estimated mass reduction coefficient is positive for 18 and is statistically significant for 17 of the 19 alternative regressions. While the magnitude of the effect of mass reduction on fatality risk in lighter-than-average cars varies substantially depending on the choice of the measure of exposure and the data and control variables used, in virtually every case mass reduction is associated with a small increase in fatality risk in lighter-than-average cars.
Specifically, the DRI studies have made three crucially important contributions to understanding the relationship between vehicle size and weight and safety (Van Auken and Zellner 2013a, 2013b, 2013c):
- In its 2003 study, DRI separated the effects of footprint and weight on fatality risk. In a 2010 study, NHTSA updated its 2003 results, including both mass and footprint in the same regression model. In the 2012 studies, NHTSA, DRI, and LBNL used analysis of variance inflation factors to demonstrate that including both footprint and weight in the same regression model would not produce inaccurate results. The 2012 studies indicate that mass reduction while holding footprint constant is associated with a small increase in risk for lighter-than-average cars only; the estimated effect on other vehicle types is not statistically significant.
DRI analyses separated the effects of size and weight on crash probability as distinct from crash outcome using a two-stage regression model.
- The DRI analysis’ separation of the effects of size and weight on crash probability resulted in the inference that mass does not operate to reduce fatalities and injuries given a crash but rather appears to reduce the probability of a crash in certain cases. There is the possibility that the empirical relationship between mass and crash outcome might be a spurious correlation rather than a genuine causal relationship. One of the things that supports this view is the way that the relationship changes depending on the exposure measure used. However, another explanation suggests that the many years of new safety regulations and crash testing have resulted in vehicle designs that mitigate the theoretical safety penalty in crash outcomes in lighter vehicles.
- DRI also showed that the exposure measure chosen to normalize fatalities or crashes has an important effect on the inferences one might draw from the analysis. Exposure measures are in fact explanatory variables whose mathematical relationship to the dependent variable (e.g., fatalities, serious injuries) and coefficient are constrained by assumption. An exposure measure is by definition the factor or variable that the analyst asserts would have a unitary relationship to the dependent variable except for the effects of the other explanatory variables and a random error term. If this is not true, then coefficient estimates will be biased if either the erroneous portion of the exposure measure is correlated with the explanatory variables or there are omitted variables that are correlated with the explanatory variables. The fact that alternative exposure measures lead to quite different coefficient estimates suggests that one or both of these phenomena are present.
The crash outcome regression coefficients were not strongly affected by the change in exposure measure. Those coefficients tend to show consistent patterns across model formulations and data sets. In contrast, the crash probability regressions exhibit greater variability across data sets and model formulations in the relationships among mass, size, and crash probability, particularly for mass reduction in lighter cars showing a change from a 1.96 percent increase to a 1.45 percent increase in crash probability; a footprint reduction in lighter cars showing a change from a 1.36 percent increase to a 1.82 percent increase in crash probability; and a footprint reduction in heavier cars yielding a change from a 1.32 percent increase to a 1.82 percent increase in crash probability. Both the NHTSA 2012 safety study (Kahane 2012) and DRI’s analysis reasonably surmise that the cause
is deficiencies in the model, particularly imprecise or omitted explanatory variables. The implication is that the coefficients may be biased. While both studies make rigorous attempts to account for the effects of multicollinearity on the variance of coefficient estimates, there is no attempt to account for potential bias. This should be a priority in future research. In the future, studies in this area may benefit from including information on crash severity. This could potentially be performed by using currently available information, such as whether or not a vehicle was towed from the crash scene.
The regression models described above are being used to draw general conclusions about the effect of vehicle mass reduction on societal risk. However, it should be noted that they are estimating the recent historical relationship between mass and risk, after accounting as carefully as possible for differences in vehicles, drivers, crash times, and locations. There are likely to be other factors that have not been accounted for in reducing mass from any one vehicle, and conditions, vehicles, and technologies are likely to be different in the future.
Mitigating Mass Reductions Through Design
In the context of mass reduction, safety is primarily a design issue. Advanced designs that disperse crash forces and optimize crush space and energy management can allow weight reduction while maintaining or even improving safety. In a crash, occupant protection is provided by designing the vehicle structure to absorb energy and prevent intrusion into the occupant compartment. For instance, in single-vehicle collisions, the NHTSA 2012 study concludes that removing mass from a single vehicle while maintaining footprint would allow for less energy to be absorbed over a fixed distance, which should reduce the risk to passengers (Singh 2012). This would require that the structural strength of the vehicle be maintained or improved. The report recommended that the most effective methods of reducing mass and maintaining footprint are (1) substitution of lighter weight materials; (2) substitution of stronger materials while using less of them; (3) downsizing the engine and powertrain; (4) use of lightweighted features; and (5) reduction of body overhang outside the wheel dimensions.
Advanced materials such as high-strength steel, aluminum, and polymer-matrix composites (PMC) have significant advantages in terms of strength versus weight. For example, pound for pound, aluminum absorbs two times the energy in a crash compared to steel and can be up to two and a half times stronger. The high strength-to-weight ratio of advanced materials allows a vehicle to maintain, or even increase, the size and strength of critical front and back crumple zones without increasing vehicle weight and to maintain a manageable deceleration profile. And, given that all light-duty vehicles likely will be downweighted, vehicle-to-vehicle crashes should also be mitigated due to the reductions in kinetic energy of the vehicles. Lastly, assuming mass reduction without size reduction, vehicle handling (exacerbated by smaller wheelbases, for instance) is not an issue.
Fleet Mix and Transition
During the transition period, when masses of heavier vehicles are being reduced, there are concerns that there might be a negative impact on safety due to variance in the distribution of vehicle masses across the vehicle fleet. Simulation work has been done for four fleetwide mass reduction scenarios (Kahane 2012):
- 100-lb reduction in all vehicles;
- proportionate (2.6%) mass reduction in all vehicles;
- mass reduction of 5.2% in heavier light trucks, 2.6% in all other vehicle types except lighter cars, whose mass is kept constant; and
- a safety-neutral scenario, where mass is reduced 0.5% in lighter cars, 2.1% in heavier cars, 3.1% in CUVs/minivans, 2.6% in lighter light trucks, and 4.6% in heavier light trucks.
The most aggressive of these scenarios (reducing mass 5.2% in heavier light trucks and 2.6% in all other vehicles types except lighter cars) is estimated to result in a small reduction in societal risk.
Pedestrian Safety
In addition to occupant protection, vehicle design and material selection can influence the safety of pedestrians in the event of a collision. The primary focus of NHTSA has been to prevent a vehicle-to-pedestrian collision in the first place (e.g., Safe Routes to School). However, NHTSA is taking into consideration Global Technical Regulation No. 9 (GTR 9), which would affect the hood and bumper design of vehicles. For example, the 2013 Ford Fusion utilizes an aluminum hood in the United States (as a mass reduction measure) while the same vehicle in Europe requires a steel hood design due to the pedestrian injury laws in Europe (Ramesh et al. 2012). NHTSA is continuing to evaluate the potential of more stringent requirements (GTR 9) but had some concerns about whether the regulations would be relevant to the mix of vehicles in the United States (i.e., SUVs and trucks).
In addition to aerodynamic drag and inertial force due to vehicle mass, tire rolling resistance is one of many forces that must be overcome in order for a vehicle to move.
F = Crr N
where F is the force of the rolling resistance, N is the normal force, and Crr is the rolling resistant coefficient.
Tires
When rolling, a tire is continuously deformed by the load exerted on it from the vehicle’s weight. The repeated deformation during rotation causes energy loss known as rolling resistance. Rolling resistance is affected by tire design: materials, shape and tread design, and inflation. Underinflated tires increase rolling resistance. The opportunity to improve fuel economy by reducing rolling resistance is already used by OEMs to deliver lower fuel consumption.
There are performance trade-offs involving tires that tire manufacturers consider during design and manufacturing. These trade-off variables include, for example, tread compound, tread design, bead/sidewall, belts, casing, and tire mass. Important tire performance criteria affected by design and manufacturing include rolling resistance, tire wear, stopping distance with respect to road surface conditions, and cornering grip. Wear and grip are closely correlated to tread pattern, softer-gripping tread compounds, and footprint shape. A typical low-rolling-resistance tire’s attributes could include increased specified tire inflation pressure, material changes, tire construction with less hysteresis, geometry changes (e.g., reduced aspect ratios), and reduction in sidewall and tread deflection. These changes would generally be accompanied by additional changes to vehicle suspension tuning and/or suspension design.
The impact of emphasizing one performance objective, such as low rolling resistance, over other performance criteria is inconclusive. While tires with low rolling resistance do not appear to compromise traction, they may wear out tread faster than conventional tires. A 2008 study by Consumer Reports summarized by Automotive News (Snyder 2008) concludes that there may be a reduction in traction of low-rolling-resistance tires that could increase the vehicle’s stopping distance. However, the study was not rigorously controlled, and other influences may have confounded the results. The response by one tire manufacturer, Michelin (Barrand and Bokar 2008) argued that low-rolling-resistance tires can be achieved without sacrificing performance factors by balancing the design and manufacturing process variables. Tire makers continue to research how to get optimal performance (including fuel economy) without sacrificing other criteria such as safety or wear. Goodyear points out that performance trade-offs between rolling resistance, traction, and tread wear can be made based on materials and process adjustments, which also affect cost (Goodyear Tire and Rubber Company 2009).
Rolling resistance can also be affected by brakes. Low drag brakes reduce the sliding friction of disc brake pads on rotors when the brakes are not engaged because the brake pads are pulled away from the rotating rotor. The benefit compared to conventional brakes may be about a 1 percent reduction in fuel consumption.
Rolling resistance is also affected by tire inflation, so any technology that affects inflation levels can also affect fuel economy. Reducing tire inflation levels increases rolling resistance, which in turn increases fuel consumption. A tire pressure monitoring system (TPMS), required by federal regulation for all light-duty vehicles, can be set to different pressure thresholds, and the TPMS must alert the operator when “one or more of the vehicle’s tires is 25 percent or more below the manufacturer’s recommended inflation pressure” (NHTSA 2005). Goodyear has been developing a tire inflation monitoring system capable of self-pumping a tire when it falls below the recommended pressure. This technology is currently being deployed on a small scale, specifically in heavy-duty vehicles, but it is possible the trend will extend in to the light-duty vehicle industry.
Fuel Consumption
Reducing tractive energy does not translate into a directly proportional reduction of fuel consumption because of (1) the accessory load and (2) the possibility that the powertrain may then operate at worse efficiency points. Ensuring powertrain efficiency requires downsizing the engine and/or changing transmission shift points at the same time because powertrain efficiency is reduced with a lighter load, especially with SI engines that will then operate with more throttling. An OEM designing a vehicle with low-resistance tires can fully take advantage of rolling resistance changes by optimizing the powertrain.
A report on tires and fuel economy estimates that a 10 percent reduction in rolling resistance will reduce fuel consumption by 1 to 2 percent (NRC 2006). This reduction, however, is without changes in the powertrain. If the powertrain could be adjusted to give the same performance, then the benefit of a 10 percent reduction might be as much as 3 percent. Goodyear and Michelin supported these estimates in dialogue with this committee.
In 2005, measured rolling-resistance coefficients, Crr, ranged from 0.00615 to 0.01328, with a mean of 0.0102. The best is 40 percent lower than the mean, equivalent to a fuel consumption reduction of 4-8 percent. Some tire companies have reduced their rolling-resistance coefficient by about 2 percent per year for at least 30 years. OEMs have an incentive to provide their cars with low-rolling-resistance tires to maximize fuel economy during certification.
In the 2050 Transitions report (NRC 2013), scenario projections of reductions in light-duty new-vehicle fleet rolling resistance by 2030 for the midrange case was 26 percent for passenger cars to 15 percent for light trucks. The optimistic-case rolling-resistance reductions were projected to be 40 percent for passenger cars to 30 percent for light trucks. Estimates of up to 40 percent were provided by certain tire manufacturers, but were put in the context of a high-end (cost premium, unquantified) tire targeted at low-rolling-resistance performance.
The TSD considered two levels of rolling resistance, one targeting a 10 percent reduction and the other target-
ing a 20 percent reduction in rolling resistance. The first level, LRR1 was defined as a 10 percent reduction in rolling resistance from a base tire, which was estimated to show a 1 to 2 percent effectiveness improvement in the Agencies’ final rule for MYs 2017-2025. The 2011 Ricardo study used by the Agencies used a 1.9 percent fuel consumption reduction for LRR1 for all vehicle classes. LRR1 tires are widely available today and appear to constitute a larger and larger portion of tire manufacturers’ product lines as the technology continues to improve and mature. The second level, LRR2 is defined as a 20 percent reduction in rolling resistance from a base tire, yielding an estimated 3.9 percent fuel consumption reduction for all vehicle classes. In the Agencies’ CAFE model, this resulted in a 2.0 percent incremental effectiveness increase from LRR1. Tire industry input endorsed these numbers.
Future improvements in tire-pressure-monitoring technology and other innovative strategies include tire pressure self-pumping designs within the tire to maintain correct tire pressure in real-time; taller and narrower tires with higher inflation pressures; and other sophisticated tire-pressure-monitoring systems.
Timing
Low-rolling-resistance tires are already used by OEMs. Vehicle manufacturers have an incentive to provide their cars with low-rolling-resistance tires to maximize fuel economy during certification. In fact, some OEMs have been recommending one specific tire for each vehicle and urging vehicle owners not to use different tires. The 2050 Transitions report estimated about a 2 percent reduction in rolling resistance per year (NRC 2013). All vehicles today are being offered with low-tire-pressure monitors to warn the driver of underinflated tires for safety and fuel economy.
The discussion in the NHTSA/EPA rulemaking support documents concluded that tire technologies that enable improvements of 10 and 20 percent have been in existence for many years. Achieving improvements up to 20 percent involves optimizing and integrating multiple technologies, with a primary contributor being the adoption of a silica tread technology. This approach was based on the use of new silica along with a specific polymer and coupling agent combination. Tire suppliers have indicated there are one or more innovations that they expect to occur in order to move the industry to the next quantum reduction of rolling resistance.
Costs
The Phase 1 Report estimated the incremental cost for low-rolling-resistance tires to be $2 to $5 per tire (NRC 2011). One tire manufacturer suggested that tires that do not compromise stopping distance or tread wear could cost 10 to 20 percent more than conventional tires. (Note: The uncertainty surrounding low-rolling-resistance tires with respect to increased tread wear and stopping distance is the reason for increasing the estimated cost beyond the $1.00 per tire cost cited in NRC 2006). The NRC (2006) study recognized that an acceptable increase in tread wear and stopping distance might occur. An additional cost can be expected to minimize this increase in tread wear.
The 2050 Transitions report estimated that average future improvements by 2030 are estimated to provide 20-28 percent reduction in rolling resistance relative to 2010, for a fuel consumption reduction of 5-8 percent at a cost of $6.25 per tire (NRC 2013).
The TSD shows 2017 DMC estimates for LRR1 as $5 relative to baseline tires and LRR2 as $63 relative to the baseline tires (Table 6.14). This agrees with the 2012-2016 light-duty vehicle rule, since NHTSA/EPA estimated the incremental DMC at an increase of $5 (2007 dollars) per vehicle for the LRR1 10 percent reduction in rolling resistance. This included the costs associated with five tires. The Agencies used MY 2017 as the starting point for market entry for LRR2 and took into account the advances in industry knowledge and an assumed increase in demand for improvements in this technology, arriving at an interpolated DMC for LRR2 of $63 (2010 dollars) per vehicle relative to the baseline tire. The Agencies did not include a cost for the spare tire because they believed manufacturers would not include a LRR2 as a spare given the $63 DMC. At this time, data are not available to differentiate LRR2 costs for different size vehicles. Tire manufacturers endorsed the numbers used by the Agencies in their rulemaking support documents. However, they said that the manufacturing costs did not appear to take into account R&D costs, which are about 3 percent of total sales. The committee’s summary of current studies on low-rolling-resistance tires can be found in Table 6.15.
| Cost Type | Lower Rolling- Resistance Tire Technology | Incremental to | 2017 | 2018 | 2019 | 2020 | 2021 | 2022 | 2023 | 2024 | 2025 | ||||||||
| DMC | Level 1 | Baseline | 5 | 5 | 5 | 5 | 5 | 5 | 5 | 5 | 5 | ||||||||
| DMC | Level 2 | Baseline | 63 | 63 | 51 | 51 | 40 | 39 | 38 | 37 | 36 | ||||||||
SOURCE: EPA/NHTSA (2012b).
| Study | Year Published | DMC ($) | Rolling Resistance Reduction (%) | FC Reduc-tion (%) | Comments | ||||||||||||||
| NRC 2011 Report | 2008 | 30-40 | 5-10 | 1-2 | Stop distance and durability rely on quality of materials which cost more. Needs regulation. | ||||||||||||||
| 2050 Transitions Report | 2011 | 25 | 21-28 | 4-6 | No degradation. | ||||||||||||||
| EPA/NHTSA TSD | 2012a and 2012b | LRR1: 5 | LRR1: 10 | 1.9 | No degradation. | ||||||||||||||
| LRR2: 63 | LRR2: 20 | 3.9 | Incremental to baseline. | ||||||||||||||||
| Committee Estimates | 2015 | LRR1: 5 | LRR1: 10 | 1.9 | No degradation. | ||||||||||||||
| LRR2: 63 | LRR2: 20 | 3.9 | Incremental to baseline. | ||||||||||||||||
Barriers
If performance trade-offs such as stopping distance, durability, or NVH are associated with lowering the rolling resistance of tires, then there would be significant barriers to its marketplace acceptance. The TSD indicated that the use of improved polymers, coupling agent, and silica was known to reduce tire rolling resistance at the expense of tread wear, but new approaches using novel silica reduced the tread wear trade-off. Recent research has indicated that reductions in rolling resistance can occur without adversely affecting wear and traction (Pike Research and ICCT 2011).
Low Drag Brakes
Low drag brakes reduce the sliding friction of disc brake pads on rotors when brakes are not engaged because the brake pads are pulled away from the rotating disc either by mechanical or electric methods.
Fuel Consumption
NHTSA and EPA estimated the fuel consumption reduction to be 0.8 percent based on the 2011 Ricardo study. The committee believes this is a reasonable estimate.
Costs
NHTSA/EPA estimated the DMC cost at $59 (2010 dollars). This estimate appears reasonable to the committee.
As discussed in the Phase 1 Report, automakers are beginning to introduce electric devices (such as motors and actuators) that can reduce the mechanical load on the engine, reduce weight, and optimize performance, resulting in reduced fuel consumption. The most advantageous opportunities for converting mechanical devices to electrical are devices that operate only intermittently, such as power steering and air conditioning (AC) compressor. With the new EPA test procedures, some of the benefits from accessory electrification will be reflected in the fuel economy labels, and improvements in these areas will be pursued by auto manufacturers.
Power Steering
In the past, most power steering systems used a hydraulic system to steer the vehicle’s wheels. The hydraulic pressure typically comes from a gerotor (sometimes referred to as a rotary vane pump) driven by the vehicle’s engine. A double-acting hydraulic cylinder applies a force to the steering gear, which in turn steers the road wheels. Sensors detect the position and torque of the steering column, and a computer module signals a motor that provides assisting torque via the motor, which connects to either the steering gear or steering column. This allows varying amounts of assistance to be applied depending on driving conditions. The steering-gear response can be tailored to variable-rate and variable-damping suspension systems, optimizing ride, handling, and steering for each vehicle.
Electric power steering (EPS) gives more assistance as the vehicle slows down and less at faster speeds. EPS eliminates a belt-driven engine accessory and several high-pressure hydraulic hoses between the hydraulic pump, mounted on the engine, and the steering gear, mounted on the chassis. This greatly simplifies manufacturing and maintenance. By incorporating electronic stability control, electric power steering systems can instantly vary torque assist levels to aid the driver in corrective maneuvers.
Fuel Consumption
EPS and electrohydraulic power steering (EHPS) provide a potential reduction in CO2 emissions and fuel consumption over hydraulic power steering because of reduced overall accessory loads. The systems eliminate the parasitic losses associated with belt-driven power steering pumps that consistently draw load from the engine to pump hydraulic fluid through the steering actuation systems even when the wheels
are not being turned. The Phase 1 Report stated that Ricardo found that EPS reduced combined fuel consumption by about 3 percent based on full system simulation calculations. From this and the estimates provided in recent regulatory activities by NHTSA and EPA, the committee estimated that EPS reduces combined fuel consumption by about 1 to 3 percent on the FTP. However, the committee recognized that the fuel consumption reduction could be as high as 5 percent under in-use driving conditions. The 2050 Transitions Report estimated that EPS consumes 2-3 percent less fuel (NRC 2013). Some weight reduction is realized, and costs are similar to hydraulic systems.
EPA and NHTSA estimated a 1.5/1.3/1.1 percent reduction in fuel consumption for small/compact/full-sized passenger cars and a 1.2/1.0/0.8 percent reduction for light trucks of varying size (EPA/NHTSA 2012b). The 2010 Ricardo study confirmed this estimate. For large pickup trucks the Agencies used EHPS due to the utility requirement of these vehicles. The effectiveness of EHPS is estimated to be 0.8 percent.
Timing
EPS is an enabler for all vehicle hybridization technologies since it provides power steering when the engine is off. EPS also may be implemented on most vehicles with a standard 12 V system. Some heavier vehicles may require a higher voltage system or EHPS, which may add cost and complexity. At least one OEM said that electric power steering would be on all vehicles by 2014 MY.
Costs
The DMC for EPS was estimated to be $87 for the 2017 MY (Table 6.15). The Agencies use the same DMC for EPS as for EHPS. The Agencies consider EPS/EHPS technology to be on the flat portion of the learning curve and have applied a low complexity in their indirect cost multiplier (ICM) analysis. The committee agrees with their estimates for the DMCs for EPS (Table 6.16).
High-Efficiency Alternator
Alternators charge the battery and power the electrical systems when the engine is running. Typical alternator efficiency is 65 percent. Typical losses include electrical, magnetic, and mechanical losses. Clearly as the alternator becomes more efficient in the process of converting mechanical energy into electrical power, less fuel is consumed. Another issue is that the efficiency of an alternator varies with load; therefore, at certification loads, the efficiency is low.
Fuel Consumption
The NHTSA/EPA final rule considered two levels of improved accessories. For level one, IACC1, NHTSA incorporated a high-efficiency (70 percent) alternator, an electric water pump, and electric cooling fans. The second level of improved accessories, IACC2, added the higher efficiency alternator and incorporated a mild regenerative alternator strategy, as well as improved cooling. NHTSA estimated of 1.2/1.0 percent reduction in fuel consumption for small/large cars and 1.01 to 1.61% reduction for small/large light-duty trucks for IACC1 and an incremental effectiveness for IACC2 relative to IACC1 ranging from 1.85 to 2.55 percent reduction in fuel consumption for small/large cars and 1.74/2.15 percent reduction for small/large light trucks.
Costs
In the TSD, the Agencies estimated the DMC of IACC1 at $71 (2007 dollars) for the 2012-2016 rule. Converting to 2010 dollars and applying the appropriate learning factor, the DMC becomes $71 for this analysis, applicable in MY 2017 and consistent with the heavy-duty rule. The Agencies consider IACC1 technology to be on the flat portion of the learning curve and have applied a low complexity ICM of 1.24 through 2018 then a long-term ICM of 1.19 thereafter. The assumed cost is higher for IACC2 due to the inclusion of a higher efficiency alternator and a mild level of regeneration. The Agencies estimate the DMC of the higher efficiency alternator and the regeneration strategy at $43 (2010 dollars) incremental to IACC1, applicable in MY 2017. Including the costs for IACC1 results in a DMC for IACC2 of $114 (2010 dollars) relative to the baseline case and applicable in MY 2017. The Agencies consider the IACC2 technology to be on the flat portion of the learning curve. They have applied a low complexity ICM of through 2018, then a long-term ICM of 1.19.
Heating, Ventilating, and Air-Conditioning
Air-conditioning (AC) is standard equipment in nearly all new cars and trucks. According to the Agencies’ TSD, over
TABLE 6.16 Direct Manufacturing Costs of Electric/Electrohydraulic Power Steering (2010 dollars)
| Cost type | 2017 | 2018 | 2019 | 2020 | 2021 | 2022 | 2023 | 2024 | 2025 | ||||||||||
| DMC | 87 | 86 | 84 | 82 | 80 | 79 | 77 | 76 | 74 | ||||||||||
SOURCE: EPA/NHTSA (2012b).
95 percent of the new cars and light trucks in the United States are equipped with mobile air conditioning systems. Three recent studies have estimated the impact of AC use on the fuel consumption of motor vehicles in the United States. Based on a combination of the results from these studies, EPA and NHTSA estimated that AC use accounts for 3.9 percent of the car and light truck fuel consumption in the United States (EPA/NHTSA 2012b).
There are two mechanisms by which vehicle AC systems contribute to increased fuel consumption and emission of greenhouse gases (GHGs). The first is direct leakage of the refrigerant into the air. The hydrofluorocarbon refrigerant compound currently used in all recent model year vehicles is R-134a. The second mechanism by which AC systems contribute to GHG emissions is the consumption of additional fuel required to provide power to the AC system and from carrying the weight of the additional fuel. This section will focus on the second mechanism related to fuel consumption by the AC system.
The fuel economy values obtained on the two-cycle (i.e., city and highway) fuel economy test do not reflect potential improvements in air-conditioning system efficiency, refrigerant leakage, or refrigerant global warming potential (GWP), termed off-cycle benefits. NHTSA and EPA allow auto manufacturers to count such decreases in fuel consumption and GHG emissions from HVAC improvements through credits. Credits can be earned for other technologies as noted in this chapter and Chapter 10, and are also earned for general compliance with the standards, as noted in the credit trading section in Chapter 10. Since EPA and NHTSA recognized that cost-effective air-conditioning system improvements will be available in the 2017-2025 time frame, the Agencies increased the stringency of the target curves based on their assessment of the ability of manufacturers to implement these changes. For the CAFE standards, an offset was included based on air-conditioning system efficiency improvements. For the GHG standards, a stringency increase was included based on air-conditioning system efficiency, leakage, and refrigerant improvements
For MYs 2017-2019, the new AC17 test will provide the means for manufacturers to demonstrate eligibility for AC efficiency credits. The AC17 test is replacing the previously required AC Idle test which did not capture the majority of the driving or ambient conditions when the AC is in operation. Results from the AC17 test allow manufacturers access to the credits from a menu based on the design of their AC systems. In MYs 2020 and thereafter, the AC17 test will be used not only to demonstrate eligibility for efficiency credits, but also to partially quantify the amount of the credit. AC17 test results with AC on and off (“A” to “B” comparison) equal to or greater than the menu value will allow manufacturers to claim the full menu value for the credit. A test result less than the menu value will limit the amount of credit to that demonstrated on the AC17 test.
Fuel Consumption
Air conditioning contributes significantly to the on-road efficiency gap between CAFE
certification values and real-world fuel consumption. The air conditioner is turned off during the CAFE tests consisting of the FTP and the highway fuel economy test (HFET) drive cycles, but in the real world, drivers tend to use air conditioning in warm, humid conditions and in cooler conditions for defrost operations. In the 2012-2016 MY rulemaking, the Agencies estimated the average impact of an air conditioning system at approximately 14.3 g CO2 over an SCO3 test for an average vehicle without any of the improved air conditioning technologies discussed in that rulemaking.8 For a 27 mpg (330 g CO2/mi) vehicle, this is approximately 20 percent of the total estimated on-road gap.
Most of the excess load from AC systems on the engine is due to the compressor, which pumps the refrigerant around the system loop. Additional loads on the engine come from electrical or hydraulic fans used to facilitate the exchange of heat across the condenser and radiator. The technologies that manufacturers are expected to use to generate credits for improved AC efficiency and to improve fuel efficiency are discussed below. These technologies focus on the compressor, electric motor controls, and system controls, which reduce the overall load on the AC system. The Agencies’ goal is to improve efficiency of the AC system without sacrificing passenger comfort.
- Reduced reheat using an externally-controlled, variable-displacement compressor.
“External control” of a variable-displacement compressor is defined as control of the displacement of the compressor based on the temperature set point or cooling demand of the AC system inside the passenger compartment. In contrast, conventional internal controls adjust the displacement of the compressor based on conditions within the AC system, such as head pressure, suction pressure, or evaporator outlet temperature. With external control, the compressor load is matched to the cooling demand of the cabin. With internal controls, the amount of cooling delivered by the system may be greater than desired, at which point the cooled cabin air is “reheated” to achieve the desired cabin comfort. This reheating of the air reduces the efficiency of the AC system. The SAE Improved Mobile Air Conditioning Cooperative Research Program (IMAC) program determined that by reducing reheat through external control of the compressor, an efficiency improvement of 24.1 percent was possible with this technology alone. The Agencies estimated that additional improvements to this technology are
_____________
8 SC03 refers to the EPA Supplemental Federal Test Procedure (SFTP) with Air Conditioning. The test runs for approximately 10 minutes with an average speed of 21.55 mph, resulting in approximately 3.5 miles covered.
-
possible and that reducing reheat can provide a 30 percent reduction in fuel consumption of the AC system.
- Reduced reheat using an externally-controlled, fixed-displacement or pneumatic variable-displacement compressor.
When using a fixed-displacement or pneumatic variable-displacement compressor (which controls the stroke, or displacement, of the compressor based on system suction pressure), reduced reheat can be realized by disengaging the compressor clutch momentarily to achieve the desired evaporator air temperature. This disengaging, or cycling, of the compressor clutch must be externally-controlled in a manner similar to that described above. The Agencies believe that a reduced reheat strategy for fixed-displacement and pneumatic variable-displacement compressors can result in an efficiency improvement of 20 percent. This lower efficiency improvement estimate (compared to an externally-controlled variable displacement compressor) is due to the thermal and kinetic energy losses resulting from cycling a compressor clutch off-and-on repeatedly. - Defaulting to recirculated cabin air.
In ambient conditions where air temperature outside the vehicle is much higher than the air inside the passenger compartment, most AC systems draw air from outside the vehicle and cool it to the desired comfort level inside the vehicle. This approach wastes energy because the system is continuously cooling the hotter outside air instead of having the AC system draw its supply air from the cooler air inside the vehicle (also known as recirculated air, or “recirc”). By cooling only this inside air (i.e., air that has been previously cooled by the AC system), less energy is required, and AC idle Tests conducted by EPA indicate that an efficiency improvement of 35 to 40 percent is possible under idle conditions. Ongoing testing on the new AC17 test, described below, is expected to provide data on the overall effectiveness of this technology during other driving conditions. To maintain freshness and humidity inside the cabin, EPA believes some manufacturers will control the air supply in a “closed-loop” manner, equipping their AC systems with humidity sensors or fog sensors (which detect condensation on the inside glass), allowing them to adjust the blend of fresh-to-recirculated air and optimize the controls for maximum efficiency. Vehicles with closed-loop control of the air supply (i.e., sensor feedback used to control the interior air quality) will provide a 30 percent reduction in fuel consumption of the AC system. Vehicles with open-loop control (where sensor feedback is not used to control interior air quality) will provide a 20 percent reduction in fuel consumption of the AC system. - Improved blower and fan motor controls.
To control the speed of the direct current (dc) electric motors in an air conditioning system, resistive elements are often used to reduce the voltage supplied to the motor. However, these resistive elements produce heat, which is typically dissipated into the air ducts of the AC system. Not only does this consume electrical energy, but it also contributes to the heat load on the AC system. Controlling dc voltage with a pulsewidth modulated controller on the motor can reduce the amount of energy wasted. EPA and NHTSA believe that when more efficient speed controls are applied to either the blower or fan motors, an overall improvement in AC system efficiency of 15 percent is possible. - Internal heat exchanger.
An internal heat exchanger (IHX), which is a suction line heat exchanger, transfers heat from the high-pressure liquid entering the evaporator to the gas exiting the evaporator. An IHX will reduce compressor power consumption and improve the efficiency of the AC system. In the MY 2012-2016 rule, the Agencies indicated that, with the changeover to an alternative refrigerant such as HFO-1234yf, the different expansion characteristics of that refrigerant (compared to R-134a) would necessitate an IHX. The Agencies believed that a 20 percent improvement in efficiency relative to the baseline configuration can be realized with an IHX. - Improved-efficiency evaporators and condensers.
The evaporators and condensers in an AC system are designed to transfer heat to and from the refrigerant. The evaporator absorbs heat from the passenger compartment air and transfers it to the refrigerant, while the condenser transfers heat from the refrigerant to the outside ambient air. The efficiency, or effectiveness, of this heat transfer process directly effects the efficiency of the overall system, as more work is required if the process is inefficient. A method for measuring the heat transfer effectiveness of these components is to determine the Coefficient of Performance (COP) for the system using the method described in SAE standard J2765 – Procedure for Measuring SystemCOP of a Mobile Air Conditioning System on a Test Bench. The COP is the ratio of the cooling at the evaporator to the work supplied to the compressor. The manufacturer must submit bench-test-based engineering analysis at the time of certification. The Agencies will consider the baseline component to be the version that a manufacturer most recently had in production on the same vehicle or a vehicle in a similar EPA vehicle classification. The design characteristics of the baseline component will be documented in an engineering analysis and compared to the improved components, along with data demonstrating the COP improvement.
-
If these components can demonstrate a 10 percent improvement in COP versus the baseline components, EPA and NHTSA estimate that a 20 percent improvement in overall system efficiency is possible.
- Oil separator.
In a typical AC system, oil circulates throughout the system for the purpose of lubricating the compressor. Because the oil is in contact with inner surfaces of the evaporator and condenser, and the coating of oil reduces the heat transfer effectiveness of these devices, the overall system efficiency is reduced. Inefficiency also results from “pushing around and cooling” an extraneous fluid that results in a dilution of the thermodynamic properties of the refrigerant. By containing the oil within the part of the compressor where it is needed, the heat transfer effectiveness of the evaporator and condenser will improve. The overall COP will also improve due to a reduction in the flow of diluent. The SAE IMAC program estimated that overall system COP could be improved by 8 percent if an oil separator was used. EPA and NHTSA believe that if oil is prevented from circulating throughout the AC system, an overall system efficiency improvement of 10 percent can be realized. Manufacturers will need to submit an engineering analysis to demonstrate the effectiveness of their oil separation technology.
The Phase 1 Report estimated that fuel consumption (in gallons per 100 miles driven) could be reduced by about 3 to 4 percent with a variable-stroke HVAC compressor and better control of the amount of cooling and heating used to reduce humidity. Other technologies that can yield incremental reductions in fuel consumption are UV filtering glazing and cool/reflecting paints, but these technologies are not currently pursued very aggressively because they are not taken account of in the official CAFE certification tests
The 2050 Transitions Report estimated that improved HVAC design would reduce air conditioning related fuel consumption by 40 percent by 2030. Better cabin thermal energy management through use of solar-reflective paints, solar-reflective glazing, and parked car ventilation was projected to reduce air conditioner related fuel consumption by 26 percent (Rugh et al. 2007). This study estimates that 2030 fuel consumption reduction for improved air conditioning of 50 percent would yield a 2 percent reduction in fuel consumption overall.
The cooperative industry and government SAE IMAC program demonstrated that average AC efficiency can be improved by 36.4 percent (compared to an average MY 2008 baseline AC system) when utilizing “best-of-best” technologies (EPA/NHTSA 2012b). EPA and NHTSA consider a baseline AC system to contain the following components and technologies: internally-controlled fixed-displacement compressor (in which the compressor clutch is controlled based on internal system parameters, such as head pressure, suction pressure, and/or evaporator outlet temperature); blower and fan motor controls that create waste heat (energy) when running at lower speeds; thermostatic expansion valves; standard efficiency evaporators and condensers; and systems that circulate compressor oil throughout the AC system. These baseline systems are inefficient in their energy consumption because they add heat to the cooled air out of the evaporator in order to control the temperature inside the passenger compartment. In addition, many systems default to a fresh air setting, which brings hot outside air into the cabin rather than recirculating the already-cooled air within the cabin.
A summary of the efficiency-improving AC technologies and the associated credits are listed in Table 6.17. As indicated earlier, for MYs 2020 and thereafter, the AC17 test will be used to qualify the amount of the credit. AC17 test results (“A” to “B” comparison) must be equal or greater than the credits shown in Table 6.17 to qualify for the full credit listed.
Based on vehicle simulation research by EPA, the impact of AC usage on average CO2 emissions and fuel consumption is 11.9 g/mi (0.001339 gal/mi) for cars and 17.2 g/mi (0.001935 gal/mi) for trucks, as shown in Table 6.18. The final CAFE rule will encourage the reduction of CO2 emissions from AC usage from cars and trucks by up to 42 percent from current baseline levels. Applying the 42 percent reduction to the average CO2 emissions yields the maximum AC CO2 credit opportunity of 5 g/mi (0.000563 gal/mi) for cars and 7.2 g/mi (0.000810 gal/mi) for trucks, as shown in Table 6.18.
Timing
EPA and NHTSA believe that the efficiency-improving technologies discussed in the previous sections are available to manufacturers today, and their feasibility and effectiveness have been demonstrated by the SAE IMAC program and various industry sources. The Agencies also believe that when these individual components and technologies are fully designed, developed, and integrated into AC system designs, manufacturers will be able to achieve the estimated reductions in CO2 emissions and to generate appropriate AC efficiency credits, which are discussed in the following section. The NRC committee did not receive any comments from vehicle manufacturers that were contrary to this assessment by EPA and NHTSA.
Mercedes noted an electric air conditioner compressor and water pump would be viable with a 48 V electric system. Variable stroke compressors and reduction of subcooling are been developed and should appear in vehicles in the next 3 to 5 years.
Costs
The direct manufacturing costs for AC efficiency improvements are shown in Table 6.19. These costs are for
| Technology Description | AC CO2 Emission and Fuel Consumption Reduction | Car AC Credit and Adjustment (g/mi CO2/gal/mi) | Truck AC Credit and Improvement (g/mi CO2/gal/mi) | ||||||||||||||||
| Reduced reheat, with externally-controlled, variable-displacement compressor | 30% | 1.5 (30% of 5.0 g/mi impact) / 0.000169 | 2.2 (30% of 7.2 g/mi impact) / 0.000248 | ||||||||||||||||
| Reduced reheat, with externally-controlled, fixed-displacement or pneumatic variable displacement compressor | 20% | 1.0 / 0.000113 | 1.4 / 0.000158 | ||||||||||||||||
| Default to recirculated air with closed-loop control of the air supply (sensor feedback to control interior air quality) whenever the outside ambient temperature is 75°F or higher (although deviations from this temperature are allowed if accompanied by an engineering analysis) | 30% | 1.5 / 0.000169 | 2.2 / 0.000248 | ||||||||||||||||
| Default to recirculated air with open-loop control of the air supply (no sensor feedback) whenever the outside ambient temperature is 75°F or higher (although deviations from this temperature are allowed if accompanied by an engineering analysis) | 20% | 1.0 / 0.000113 | 1.4 / 0.000158 | ||||||||||||||||
| Blower motor control which limit wasted electrical energy (e.g. pulsewidth modulated power controller) | 15% | 0.8 / 0.000090 | 1.1 / 0.000124 | ||||||||||||||||
| Internal heat exchanger (or suction line heat exchanger) | 20% | 1.0 / 0.000113 | 1.4 / 0.000158 | ||||||||||||||||
| Improved evaporators and condensers (with engineering analysis on each component indicating a COP improvement greater than 10%, when compared to previous design) | 20% | 1.0 / 0.000113 | 1.4 / 0.000158 | ||||||||||||||||
| Oil Separator (internal or external to compressor) | 10% | 0.5 / 0.000056 | 0.7 / 0.000079 | ||||||||||||||||
SOURCE: EPA/NHTSA (2012b).
TABLE 6.18 Derivation of Maximum CO2 Credits for Air Conditioning Efficiency Improvements
| Cars | Trucks | ||||||||||||||||||
| CO2 Emissions for AC Usage on SC03 Cycle | 11.9 g CO2/mi | 17.2 g CO2/mi | |||||||||||||||||
| Based on EPA Simulation, assuming: - U.S. typical AC on-times: 23.9% manual AC, 35% automatic AC - Market Penetration: 62% manual, 38% automatic - Average AC compressor loads based on environmental conditions in the U.S. (from NREL) |
(0.001339 gal/mi) | (0.001935 gal/mi) | |||||||||||||||||
| Maximum AC CO2 Credit - Equal to a 42% reduction encouraged by the final CAFE rule |
5 g CO2/mi (0.000563 gal/mi) | 7.2 g CO2/mi (0.000810 gal/mi) | |||||||||||||||||
NOTE: Factor to convert from CO2 to gal/mi is 8,887 g CO2/gal.
TABLE 6.19 Costs for Air Conditioning Efficiency Improvements
| Technology | Estimated Direct Manufacturing Costs ($) | ||||||||||||||||||
| 2017 | 2020 | 2025 | |||||||||||||||||
| Car | 2012 - 2016 Efficiency Improvements | 46 | 43 | 39 | |||||||||||||||
| 2017 - 2025 Efficiency Improvements | 1 | 1 | 1 | ||||||||||||||||
| Total | 47 | 44 | 40 | ||||||||||||||||
| Truck | 2012 - 2016 Efficiency Improvements | 32 | 30 | 27 | |||||||||||||||
| 2017 - 2025 Efficiency Improvements | 1 | 15 | 13 | ||||||||||||||||
| Total | 33 | 45 | 40 | ||||||||||||||||
SOURCE: EPA/NHTSA (2012b).
improved compressors, expansion valves, heat exchangers, and the control of these components for the purposes of reducing tailpipe CO2 emissions and fuel consumption as a result of AC use. The 2012-2016 rule technologies represent the reference case in terms of controls and costs. However, additional costs are included for indirect efficiency improvements as the 2012-2016 MY vintage systems penetrate to the entire fleet. The Agencies expect the AC efficiency costs to be incurred consistent with their estimated ramp up of manufacturers’ use of AC credits (as shown in Table 5-13 of the TSD). The ramp up of credits is factored in the costs shown in Table 6.19. The Agencies received no public comments on these AC costs. Likewise, no vehicle manufacturer provided comments on these AC costs to the NRC committee. The Agencies consider technologies for most of the AC system improvements to be on the flat portion of the learning curve.
As indicated earlier, for MYs 2020 and thereafter, the AC17 test will be used to qualify the amount of the credit. AC17 test results (“A” to “B” comparison) must be equal to or greater than the credits shown in Table 6.18 to qualify for the full credit listed.
Direct manufacturing costs estimated by EPA and NHTSA for the AC efficiency improvements listed in Table 6.17 are shown in Table 6.19. EPA and NHTSA imply that the costs shown in the table would be associated with obtaining the maximum AC CO2 credits shown in Table 6.18.
In addition to the foregoing discussion of indirect CO2 and fuel consumption reduction credits for AC efficiency improvements, the final GHG/CAFE rule expands provisions for manufacturers to generate credits for reduced AC leakage and alternative low GWP9 refrigerants. However, unlike the AC efficiency improvements, reductions in AC leakage and alternative low GWP refrigerants do not count toward the CAFE calculations since these improvements do not improve fuel economy. The reduced AC leakage hardware includes improved hoses, connectors, and seals. The low GWP refrigerants require additional refrigerant hardware. The CO2 credits and costs for reduced AC leakage and GWP refrigerants are described in the TSD (EPA/NHTSA 2012b). EPA estimated that there would be significant penetration of AC technologies for leakage reduction and efficiency improvements to gain credits, and this was reflected in the stringency of the standards.
Crediting Off-Cycle Efficiency Technologies
The combined city/highway, or “two-cycle,” certification test for fuel economy is known to produce results substantially higher than the average fuel economy in real-world driving. Furthermore, certain technologies deliver real-world fuel savings that are not reflected, or are not fully reflected, in two-cycle fuel economy test values. These include, for instance, air conditioner efficiency improvements, which do not provide fuel savings on the test cycle because the air conditioner remains off throughout the two-cycle test. In order to incentivize the development and deployment of such technologies, the Agencies have defined “off-cycle” credits that manufacturers apply toward the fuel economy and CO2 emissions averages for their vehicles. The 2017-2025 rule was the first use of off-cycle credits in the CAFE program.
Due to the anticipated difficulty of having manufacturers’ demonstrate the off-cycle savings for individual technologies, the Agencies estimated fuel economy credit values for several technologies that they judged could be reasonably quantified in a generic fashion. Default fuel savings values, separate for cars and for trucks, for these “preapproved” technologies appear in two menus of off-cycle credits in the rule and are shown in the final rule (EPA/NHTSA 2012a, Tables II-21 and II-22). Aside from air conditioning efficiency improvements, manufacturers may claim these credits simply by providing the specifications of their equipment and stating the number of their cars and trucks on which the technology appears. However, there is a cap of 10 g/mi CO2 (about 0.001 gal/mi), in total and on average over cars and trucks, on non-AC credits obtained through this menu approach (EPA/NHTSA 2012a, 62727).10 Manufacturers can also obtain off-cycle credits by directly demonstrating the fuel savings of the technology, and credits so obtained are not subject to the 10 g/mi cap.
For air conditioning efficiency improvement and two other off-cycle technologies that they believed would be widely used, the Agencies incorporated the expected benefits into the stringency of the standards. The two others are stop-start systems and active aerodynamic improvements (EPA/NHTSA 2012a, 62720). Stop-start systems provide fuel savings over the certification cycle but are eligible for off-cycle credits based on the notion that the real-world idle fraction on average is significantly larger than the idle fraction in the two-cycle test. Active aerodynamics refers to aerodynamic technologies that are activated only at certain speeds, including active grille shutters and active ride height control.
In modeling compliance with the 2017-2025 standards, the Agencies assumed that these three categories of technologies would be used by manufacturers to achieve the standards and were thus incorporated into the stringency of the standards. The committee’s assessment of the effectiveness of AC improvements can be found in Table 6.20.
_____________
9 Global warming potential (GWP) is a relative measure of heat trapped in the atmosphere by a greenhouse gas. GWP is calculated over a certain time period and is expressed as a factor of carbon dioxide (whose GWP is standardized to 1).
10 These credit amounts are significant from a compliance perspective. For example, for a 45 mpg vehicle, a fuel savings credit equivalent to 10 g/mi would increase nominal fuel economy by 2.4 mpg.
| Potential Reduction of Fuel Consumption with the Use of Vehicle Accessories | Reduction in Fuel Consumption (%) | Comments |
| NRC Phase 1 Study (NRC 2011) | ||
| Variable stroke HVAC compressor | 3 - 4 | Improved cooling, heating, and humidity control. |
| Low transmissivity glazing, “cool” paint, and parked vehicle ventilation | ~ 1 | Lower heat buildup in vehicle decreases AC load. |
| Electrohydraulic power steering | 4 | Combined electric and hydraulic power for midsize to larger vehicles. Reduces continuous load on engine. |
| Electric power steering | 1 - 5 | |
| NRC 2050 Transitions Study (NRC 2013) | ||
| HVAC and thermal management | 2 | Electric power steering for smaller vehicles reduces continuous load on engine – smaller benefits (1-3%) estimated for the FTP. |
| Electric power steering | 2 - 3 | |
| NHTSA/EPA Final Rule (NHTSA 2005) | ||
| High-efficiency alternator | 1.2 - 1.8 | |
| Improved cooling | 1.74 - 1.55 | |
Barriers
The technologies discussed above focused on the compressor, electric motor controls, and system controls, which reduce the overall load on the AC system. The goal is to improve efficiency of the AC system without sacrificing passenger comfort.
AUTOMATED AND CONNECTED VEHICLES
Automated and connected vehicles are attracting increasing attention. They can function under current highway conditions, as has been demonstrated by the vehicles put on the road in California by Google that traveled well over 200,000 miles. They are touted as a means to improve driving safety, reduce travel times, enable otherwise-incapable people to operate cars, and reduce fuel consumption. NHTSA believes that automated and connected vehicles represent “a historic turning point for automotive travel” (NHTSA Preliminary Policy on Automated Vehicles 2015). In 2013, the Agency released a policy statement that describes the technologies available, a summary of the research it has been pursuing, and its recommendations on a safe implementation of these technologies. The technologies deliver capabilities that range from increasing the available information to a driver to a vehicle being capable of operating under complete autonomy. NHTSA has classified these technologies into categories defined by five levels of autonomy:
- No automation (Level 0). The driver is in complete and sole control of the primary vehicle controls—brake, steering, throttle, and motive power—at all times.
- Function-specific automation (Level 1). Automation at this level involves one or more specific control functions. Examples include electronic stability control or precharged brakes, where the vehicle automatically assists with braking to enable the driver to regain control of the vehicle or stop faster than would be possible by acting alone.
- Combined function automation (Level 2). This level involves automation of at least two primary control functions designed to work in unison to relieve the driver of control of those functions. An example of combined functions enabling a Level 2 system is adaptive cruise control in combination with lane centering.
- Limited self-driving automation (Level 3). Vehicles at this level of automation enable the driver to cede full control of all safety-critical functions under certain traffic or environmental conditions and in those conditions to rely heavily on the vehicle to monitor for changes requiring transition back to driver control. The driver is expected to be available for occasional control, but with sufficiently comfortable transition time. The Google car has mostly operated under limited self-driving automation.
- Full self-driving automation (Level 4). The vehicle is designed to perform all safety-critical driving functions and monitor roadway conditions for an entire trip. Such a design anticipates that the driver will provide destination or navigation input but is not expected to be available for control at any time during the trip. This includes both occupied and unoccupied vehicles.
The following section attempts to characterize these technologies by level and describes potential effects on fuel consumption and passenger safety.
Level 1: Function-Specific Autonomy
In the near term, it is likely that the technologies that will be commercially available will remain in Level 1 through Level 3. Some of these technologies have been commercially available on certain models and, in some situations, NHTSA has found the technologies to be essential to improving vehicle safety. Function-specific autonomy can describe technologies such as maintaining speed, assisting in stopping, and warning of action that would increase the risk to the vehicle occupants.
Conventional cruise controls maintain a constant (or nearly constant) speed, effectively relieving the driver of one task. The newer, autonomous cruise control addresses two things: proximity to vehicles ahead of the subject car and lane boundaries. The autonomous (or “adaptive”) cruise control(ACC) keeps the speed of the vehicle at a level that maintains a preset distance behind the vehicle ahead of the controlled vehicle. Such controls are currently available, for example, on four models of Ford cars and three Lincoln cars. The current market price for these systems ranges between $1,200 and $3,000. The sensing systems in these controls are now radar; formerly, some were laser light beams. Regarding fuel consumption reduction, advanced cruise control systems have the potential to keep the vehicle at a more constant speed, which uses less fuel than having the driver attempt to maintain vehicle speed. However, the reduction in fuel consumption would be highly dependent on the driver’s behavior and is difficult to quantify. It is unknown what impacts this technology may have on safety since it controls only one task for the driver. Assuming that the driver is attentive to controlling the vehicle, it is likely that maintaining a constant speed will increase safety for other drivers on the road and therefore reduce risk.
Electronic stability control (ESC) is one area of research that NHTSA has identified as a promising approach to increasing safety. Often referred to as “traction control,” ESC is a digital technology that works by its ability to automatically apply braking to individual wheels in order to avoid dangerous changes in vehicle heading. In other words, it supports the driver’s behavior, such as driving along a curved road, by noting the intended change in direction, calculating whether or not braking is required to maintain vehicle stability for each wheel, and then executing the braking required to steer the vehicle in the intended direction. The entire process usually occurs so quickly that the driver is often ignorant of the fact that it is even functioning. NHTSA has found the technology to be so promising that every light-duty vehicle after MY 2011 has been required to include it.
Level 2: Combined Function Autonomy
Many of the technologies in Level 2 are also available today. These technologies are capable of controlling the vehicle in two functions, thereby removing the tasks from the driver. A more elaborate cruise control system, in a testing stage now, provides an audible and visual warning signal when vehicles ahead reduce speeds, and then prepares and applies brakes, presumably faster than the human driver could move a foot from accelerator to brake pedal. A version of cruise control under development now monitors the deviations of the vehicle’s path from any strictly in-lane motion. It goes by the name “Lane Keep Assist” (LKA). A simpler device is the “Lane Departure Warning” (LDW), which simply alerts the driver to the beginnings of a deviation. The LDW control puts in a resistance to any steering that would take the car from a linear, in-lane path, literally nudging it back into its lane. Fuel savings from widespread implementation of cruise controls might result if simulations represent their effects accurately. The travel times from simulations were 20 to 37.5 percent shorter than those without autonomous cruise controls, so the total fuel consumption would be lower than at present (Treiber and Kesting 2012; Suzuki and Nakatsuji 2003). With respect to maintaining lane control, this approach does not seem to have any effect on fuel performance. Assuming that these technologies function as intended, it is likely that societal and personal safety will improve as they are included in more and more vehicles. However, the degree of improvement on safety is an unknown as drivers are unlikely to report when a collision is avoided because of the technology functioning properly.
Longer-Term Fully Automated and Connected Vehicles (Levels 3 and Up)
Fully automated vehicles require sensors to recognize all the relevant characteristics of their surroundings and their current operation, but they also must have both links to the mechanical controls of the vehicle and a control system, presumably based in a computer, to determine the appropriate response to the sensors’ signals for adjusting the mechanical controls.
There are two levels of sensor technology associated with self-driving vehicles. One is the set of sensors and controls for an individual vehicle that could operate under existing conditions on streets and highways. The second level has communication between autonomous vehicles and between vehicles and their surroundings. While there are many benefits to making individual, independent vehicles self-driving, still more benefits could be achieved if there were, as the advisory firm KPMG Consulting describes it, “a convergence of sensor-based technologies and connected-vehicle communication.”
Sensor-based technologies that recognize other nearby vehicles, signals, signs, pedestrians, and cyclists come at
various levels of sophistication and with a choice of sensor technology. Sensor technology is typically based in either radar (radio frequency or microwave radiation) or lidar (optical radiation). At present, the cost of any adequate sensor is far too high to make the technology widely available. For example, the lidar system used by Google for its autonomous vehicles costs $70,000 (Bunkley 2012). Obviously such costs would drop significantly with mass application, but by how much is unknown to the committee.
Fuel Consumption
The potential of autonomous vehicles for reducing fuel consumption is considerable indeed, provided that large numbers of cars have that capability. Maintaining smooth traffic flow would reduce mean travel times by reducing congestion and fuel consumption. “Platooning,” or having significant numbers of vehicles move in synchrony, would reduce air resistance much as “drafting” does when a cyclist rides close behind other cyclists or behind a vehicle. Estimates of fuel savings associated with having significant numbers of autonomous cars vary, but a conservative minimum is about 20 percent. However, the full implementation of high levels of autonomy in vehicles may produce unexpected results in terms of fuel consumption due to an increase in vehicle miles traveled.
Timing
Estimates of the time it will take until autonomous vehicles constitute a significant fraction of the car market vary widely. The most optimistic say that this could happen by 2022; others say 2050. There is a growing view that at some time in the next half-century, we will see many self-driving cars in use. One aspect is of course establishing a manufacturing structure, but a complementary one is creating the means to retrofit existing vehicles both for sensing and communicating with other vehicles and stationary signaling centers.
Costs
The costs of fully automated and connected vehicles have yet to be determined. While studies are currently being performed on this topic, the range of estimates on the costs of implementing autonomous technologies more advanced than Level 4 have significant ranges of uncertainty associated with them.
Barriers
Given the experimental status of autonomous vehicles, the National Highway Traffic Safety Administration (NHTSA) has established a requirement that a human driver must be able to take control at any time of an otherwise autonomous vehicle. This requirement will presumably remain in effect until such a time when these vehicles are fully tested and have become acceptable on the basis of their reliability and safety. There will also be a very long period of time when fully automated and connected vehicles share the road with conventional vehicles.
The technology could have net negative consequences in terms of fuel consumption and traffic flow. The autonomy enables people to operate cars who would be unable to drive conventional vehicles. For example, Google made a video of a full round-trip in an autonomous vehicle with a blind man in the driver’s seat. This might lead to an increase in the number of vehicles on the roads and an increase in the fleet’s vehicle miles traveled.
Finding 6.1 The committee’s estimates of fuel consumption reduction effectiveness and direct manufacturing costs for aerodynamic improvements, low rolling resistance tires, low drag brakes, electric power steering, and improved accessories are shown in Table 6.21 and are in agreement with NHTSA’s estimates.
Finding 6.2 The mass reduction targets identified in the NHTSA/EPA TSD are conservative. Automakers are more likely to implement the more aggressive levels of mass reduction estimated in Table 6.22.
Finding 6.3 As more mass is removed from a vehicle, incremental costs tend to increase. The initial reductions in mass come from easier and less-complex alternatives than later alternatives, particularly with mass substitution options. For example, the progression in the industry to lightweighting shifts applications from mild steel to high-strength steel, or from high-strength steel to aluminum, or aluminum to composites and magnesium. Each increasingly aggressive step removes additional mass and comes at a higher cost than the preceding step. Manufacturers will be constrained by high costs rather than by options in reducing mass between now and 2030.
Finding 6.4 The mass reductions cited above, in the 15-20 percent range for larger vehicles, are expected, especially when they are accomplished with a complete vehicle design and consequent mass decompounding and drivetrain optimization. Such mass reductions could be cost effective, especially for electric- and hybrid-powered vehicles, because savings associated with mass reductions are more significant for these powertrains than for conventional spark-ignition powertrains.
Finding 6.5 It is the committee’s view that mass will be reduced across all vehicle sizes, with proportionately more mass removed from heavier vehicles. The most current studies that analyze the relationships between vehicle foot-
TABLE 6.21 Estimates of Technology Effectiveness and Costs for 2017, 2020, and 2025
| Direct Manufacturing Costsa (in 2010$) | |||||||||||||||||||
| Technology | Fuel Consumption Reduction (%) | 2017 | 2020 | 2025 | |||||||||||||||
| Aerodynamic Improvement 1(10% Cd) | |||||||||||||||||||
| Small and Large Car | 2.3 | 39 | 37 | 33 | |||||||||||||||
| Light Truck | 2.3 | 39 | 37 | 33 | |||||||||||||||
| Aerodynamic Improvement 2(20% Cd)b | |||||||||||||||||||
| Small and Large Car | 2.5 | 117 | 110 | 100 | |||||||||||||||
| Light Truck | 2.5 | 117 | 110 | 100 | |||||||||||||||
| Low Rolling Resistance Tires Level 1 | 1.9 | 5 | 5 | 5 | |||||||||||||||
| Low Rolling Resistance Tires Level 2b | 2.0 | 58 | 46 | 31 | |||||||||||||||
| Low Drag Brakes | 0.8 | 59 | 59 | 59 | |||||||||||||||
| Electric Power Steering | |||||||||||||||||||
| Small Car | 1.3 | 87 | 82 | 74 | |||||||||||||||
| Large Car | 1.1 | 87 | 82 | 74 | |||||||||||||||
| Light Truck | 0.8 | 87 | 82 | 74 | |||||||||||||||
| Improved accessories Level 1 | |||||||||||||||||||
| Small Car | 1.2 | 71 | 67 | 60 | |||||||||||||||
| Large Car | 1.0 | 71 | 67 | 60 | |||||||||||||||
| Light Truck | 1.6 | 71 | 67 | 60 | |||||||||||||||
| Improved accessories Level 2b | |||||||||||||||||||
| Small Car | 2.4 | 43 | 40 | 37 | |||||||||||||||
| Large Car | 2.6 | 43 | 40 | 37 | |||||||||||||||
| Light Truck | 2.2 | 43 | 40 | 37 | |||||||||||||||
a Relative to baseline except as noted.
b Relative to Level 1.
TABLE 6.22 Mass Reductions Foreseen by NHTSA/EPA and by the Committee (percent)
| Vehicle | NHTSA/EPA TSD Estimate | Committee Estimate |
| Small car | 0 | 5 |
| Midsize car | 3.5 | 10 |
| Large car | 10 | 15 |
| Minivan | 20 | 20 |
| Light duty truck | 20 | 20 |
print, mass, and safety support the argument that removing mass across the fleet in this manner while keeping vehicle footprints constant will have a beneficial effect on societal safety risk. Additionally, with the introduction of improved crash simulation and vehicle design techniques, new materials, and crash avoidance technology (such as lane change warning and autonomous frontal braking), crashworthiness and crash avoidance should be improved. During the transition period when vehicle masses are being reduced, there could be an increase in safety risk due to variance in the distribution of the mass across the vehicle fleet.
Recommendation 6.1 NHTSA should carefully consider and, if necessary, take steps it believes could mitigate the possible threats to safety during the transition period, as the fleet moves from current vehicle designs to a more lightweighted fleet.
Finding 6.6 The cost to repair and insure lighter weight vehicles will increase as manufacturers employ material substitution to lightweight cars. Material substitution with high-strength steel, aluminum, magnesium, and composites add complexity to vehicles, making them more expensive to insure and repair. The service industry will have to increase training and upgrade equipment to be able to evaluate and repair vehicles with a broader mix of materials and joining technologies.
Recommendation 6.2 Automobile manufacturers, the insurance industry, and the repair industry should continue
coordination so that appropriate procedures and technology are ready for the introduction of vehicles with nontraditional materials.
Finding 6.7 The evolution of the materials’ industries, especially steel and aluminum, is significant and warrants monitoring. The availability of aluminum or other aspects of the aluminum supply chain (e.g., annealing, rolling, recycling, tooling/forming, etc.) may limit the industry’s move toward lighter weight cars. The economic impact of transitioning to higher aluminum content may have a significant impact on the associated workforce.
Finding 6.8 There have been several teardown studies to help assess the opportunity and cost for reducing mass in vehicles, but little attention has been given to interpreting how best to use the results. The committee feels that the studies are hard to generalize and apply to other vehicles due to the wide variation across vehicle models and because extrapolating results from one or two studies to the entire fleet would be problematic. Future teardown studies would benefit from careful selection of vehicles that are representative of their class.
Finding 6.9 The committee finds the use of the lightweight optimization studies combining computer-aided engineering and teardown analyses to be an improvement over the current method used for the 2017-2025 rulemaking. These types of analyses can be helpful in identifying components where lightweighting is possible, illustrating examples of material substitution, and taking an integrated approach to mass reduction over the entire vehicle. However, the committee recognizes the limitations of vehicle-specific studies when used to estimate costs across the entire fleet, or even across a vehicle class. The vehicle model selected for the analyses will have a large impact on the opportunities for mass reduction. Factors such as the substantial differences in the starting point of vehicle models, the varied materials in current designs, and individual business considerations—such as global platforms and maintaining vehicle NVH—mean that such studies must be supplemented with other analysis. There is high potential for misinterpretation of the cost estimates resulting from these vehicle-specific studies if they are applied to other vehicle designs in a general fashion, and this potential is much greater for mass reduction techniques than it is for other types of technologies.
Recommendation 6.3 The committee recommends that the Agencies augment their current work on vehicle design optimization with a materials-based approach that looks across the fleet to better define opportunities and costs for implementing lightweighting techniques, especially in the area of decompounding. Such an approach might include assessing opportunities for well-defined substitution, such as replacing a hood or door with a lighter material across the light-duty fleet. A characterization of current vehicles in terms of materials content is a prerequisite for such a materials-based approach and for quantifying the opportunities to incorporate different lightweighting materials in the fleet. The committee recommends that the Agencies consider undertaking such a characterization.
Finding 6.10 An estimated 20 percent reduction in rolling resistance appears reasonable, with a 4 percent incremental fuel consumption reduction in the 2020 to 2025 time frame. However, there are engineering challenges associated with tire design with respect to rolling resistance, tread wear, and traction, because these attributes affect tire costs.
Finding 6.11 The NHTSA/EPA TSD estimates that electric power steering could provide an incremental fuel consumption reduction of 1.3 percent for small cars, 1.0 percent for large cars, and 0.8 percent for small light trucks, 1.0 percent for medium light trucks and 0.8 percent for large light trucks at a cost of $109 appear reasonable.
Recommendation 6.4 NHTSA/EPA should consider the contributions of tire pressure management systems and autonomous tire inflation technology to reducing fuel consumption and improving vehicle safety.
Recommendation 6.5 NHTSA should continue to maintain the current tire safety regulatory structure, which will not allow safety performance to be traded off for improved fuel economy performance. And, in this vein, NHTSA should maintain a regulatory structure—including a rating system, especially fuel economy ratings, for tire consumers,—to support marketplace decisions that could result in aftermarket tire performance that does not significantly differ from new vehicle tire performance.
Finding 6.12 EPA and NHTSA have estimated that the final CAFE rule will encourage a reduction in AC CO2 emissions for cars and trucks of up to 42 percent from current baseline levels. Since the AC is not turned on as a part of the fuel economy and GHG emissions standards compliance test drive cycles, the effect of AC efficiency improvements is an off-cycle effect. AC credits for efficiency improvements are applicable to both GHG emissions and fuel consumption. For MYs 2017 to 2019, the AC17 test will be used to demonstrate eligibility for AC credits using a menu based on the AC design. For MYs 2020 and thereafter, the AC17 test will be used to qualify the amount of the credit. AC17 test results must demonstrate reductions in fuel consumption equal to or greater than the allowable credits to qualify for the full credits listed by EPA and NHTSA. AC efficiency improvements are estimated by the Agencies to have a direct manufacturing cost of $40 (2010 dollars) by MY 2025.
Finding 6.13 While there has been much publicity over the potential benefits of connected vehicle technologies,
significant uncertainty remains about the impact these technologies will have in the 2025 timeframe. In addition to the uncertainty of how these technologies will affect fuel consumption, there is even greater uncertainty about how these technologies will be implemented with regard to laws and regulations, how they will affect vehicle miles traveled, and safety considerations for more advanced connected vehicle technologies.
Recommendation 6.6 NHTSA/EPA should continue to evaluate the potential contribution of automated and connected vehicle technologies for improving fuel economy. The Agencies should consider the desirability and feasibility of providing CAFE-related credits to incentivize the adoption of appropriate technologies.
3M Company. n.d. Auto Part Targets for Lightweight Plastics and Rubber.
Alonso, E., T.M. Lee, C. Bjelkengren, R. Roth, and R. Kirchain. 2012. Evaluating the potential for secondary mass savings in vehicle lightweighting. Environmental Science & Technology.
Barrand, J., and J. Bokar. 2008. Reducing tire rolling resistance to save fuel and lower emissions. SAE Paper 2008-01-0154. SAE International, Warrendale, PA.
Bunkley, K. 2012. The car without a driver. Automotive News, July 16. http://www.autonews.com/article/20120716/OEM06/307169920/the-car-without-a-driver.
California Air Resources Board (CARB). 2011. Appendix Q Proposed LEVIII GHG Technical Support Document. December 7. Sacramento, Calif.
Cheah, L.W. 2010. Cars on a Diet: The Material and Energy Impacts of Passenger Vehicle Weight Reduction in the U.S. PhD. Dissertation, Massachusetts Institute of Technology.
DOE (U.S. Department of Energy). 2010. Material Content per Light Vehicle, 1995 and 2008. http://energy.gov/eere/vehicles/fact-642-september-27-2010-material-content-light-vehicle-1995-and-2008.
DOE. 2013. Workshop Report: Light-Duty Vehicles Technical Requirements and Gaps for Lightweight and Propulsion Materials, February.
Ducker Worldwide. 2014. 2015 North American Light Vehicle Aluminum Content Study.
Ducker Worldwide. 2011. Aluminum in 2012 North American Light Vehicles: Executive Summary. September 7.
EEA (Energy and Environmental Analysis, Inc.). 2007. Update for Advanced Technologies to Improve Fuel Economy of Light Duty Vehicles—Final Report. Prepared for U.S Department of Energy. October.
EPA (Environmental Protection Agency). 2015. Cost-Effectiveness of a Lightweight Design for 2020-2025: An Assessment of a Light-Duty Pickup Truck. SAE World Congress. April 2015. Detroit, Mich.
EPA. 2008. EPA Staff Technical Report: Cost and Effectiveness Estimates of Technologies Used to Reduce Light-Duty Vehicle Carbon Dioxide Emissions. EPA420-R-08-008. Ann Arbor, MI.
EPA/NHTSA (Environmental Protection Agency/National Highway Traffic Safety Administration). 2012a. 2017 and Later Model Year Light-Duty Vehicle Greenhouse Gas Emissions and Corporate Average Fuel Economy Standards. EPA 40 CFR 85, 86, 600; NHTSA 49 CFR 523, 531, 533, 536, 537. August 28.
EPA/NHTSA. 2012b. Joint Technical Support Document: Final Rulemaking for the 2017-2025 Light-Duty Vehicle Greenhouse Gas Emission Standards and Corporate Average Fuel Economy Standards. EPA-420-R-12-901. http://www.epa.gov/otaq/climate/documents/420r12901.pdf.
Evans, L. 1991. Traffic Safety and the Driver. New York: Van Nostrand Reinhold Publishing.
Forbes. 2008. Automakers’ Natural Appeal. Forbes Magazine, September 26.
GAO (U.S. Government Accountability Office). 2004. Highway Safety: Federal and State Efforts to Address Rural Road Safety Challenges. U.S. General Accounting Office Report to Congressional Committees. http://www.gao.gov/assets/250/242663.pdf.
Gessat, J. 2007. Electrically Powered Hydraulic Steering Systems for Light Commercial Vehicles. SAE 2007-01-4197.
Goodyear Tire and Rubber Company. 2009. Letter from Donald Stanley, Vice President, Product Quality and Plant Technology, April 13, 2009; email exchanges with Donald Stnaley, January 28, 2009, and February 25, 2009.
Hucho, H.W. 2005. Aerodynamik des Automobils, Wieweg+Tuebner, 5th ed.
Kahane, C.J. 2012. Relationships Between Fatality Risk, Mass, and Footprint in Model Year 2000-2007 Passenger Cars and LTVs – Final Report. DOT HS 811 665. August. National Highway Traffic Safety Administration.
Kebschull, S.A., and M. Sekiguchi. 2008. Brief Summary of a Furthur Analysis of the effects of SUV Weight and Length Changes on SUV Crashworthiness and Compatibility Using Fleet Modeling and Risk-Benefit Analysis. Dynamic Research, Inc., DRI-TM-08-24.
Kolwich, G. 2014. Silverado 1500 Mass-Reduction and Cost Analysis Project Review. Follow-up to NAS/NRC Committee visit to NVFEL, July 31st, 2014. Presentation to the Committee on Assessment of Technologies for Improving the Fuel Economy of Light-Duty Vehicles, Phase 2, September 4.
Lotus Engineering. 2010. An Assessment of Mass Reduction Opportunities for a 2017-2020 Model Year Vehicle Program. Washington, D.C.: The International Council on Clean Transportation.
McCartt, A.T. and E.R. Teoh. 2014. Type, Size and Age of Vehicles Driven by Teenage Drivers Killed in Crashes During 2008-2012. Arlington, Virginia: Insurance Institute for Highway Safety.
NHTSA (National Highway Traffic Safety Administration). 2005. Federal Motor Vehicle Safety Standards; Tire Pressure Monitoring Systems; Controls and Displays. Docket No. NHTSA 2005-20586. http://www.nhtsa.gov/cars/rules/rulings/tpmsfinalrule.6/tpmsfinalrule.6.html
NRC (National Research Council). 2006. Tire and Passenger Vehicle Fuel Economy: Informing Consumers, Improving Performance-Special Report 286. Washington, D.C.: The National Academies Press.
NRC. 2011. Assessment of Fuel Economy Technologies for Light-Duty Vehicles. Washington, D.C.: The National Academies Press.
NRC. 2013. Transitions to Alternative Vehicles and Fuels. Washington, D.C.: The National Academies Press.
Pike Research and International Council Clean Transportation. 2011. Opportunities to Improve Tire Energy Efficiency. http://theicct.org/tire-energy-efficiency.
Ramesh C.K. et al. 2012. Design of Hood Stiffener of a Sedan Car for Pedestrian Safety. M.S. Ramaiah School of Advanced Studies. Bangalore, India.
Rugh, J.P. et al. 2007. Reduction in Vehicle Temperatures and Fuel Use from Cabin Ventilation, Solar-Reflective Paint, and a New Solar-Reflective Glazing. NREL/CP-540-40986. Presented at the 2007 SAE World Congress. Detroit, MI, April 16-19.
Schutte and Joost. 2012. Energy, Materials, and Vehicle Weight Reduction. U.S. Department of Energy Presentation. Washington, D.C., May 6.
Singh, H. 2012. Mass Reduction for Light-Duty Vehicles for Model Years 2017-2025: Final Report. DOT HS 811 666. August. National Highway Traffic Safety Administration.
Snyder, J. 2008. A big fuel saver: Easy-rolling tires (but watch braking). Automotive News, July 21. http://www.autonews.com/article/20080721/OEM01/307219960.
Suzuki, H., and T. Nakatsuji. 2003. Effect of adaptive cruise control (ACC) on traffic throughput: numerical example on actual freeway corridor. JSAE Review 24(4): 403-410. doi: 10.1016/S0389-4304(03)00074-2.
Treiber, M., and A. Kesting. 2012. Validation of traffic flow models with respect to the spatiotemporal evolution of congested traffic patterns. Transportation Research Part C: Emerging Technologies 21: 31-41.
Van Auken, R.M., and J.W. Zellner. 2013a. Updated Analysis of the Effects of Passenger Vehicle Size and Weight on Safety, Phase I; Updated Analysis Based on 1995 to 2000 Calendar Year Data for 1991 to 1999 Model Year Light Passenger Vehicles. DRI-TR-11-01-1. Torrance, CA: Dynamic Research, Inc. May.
Van Auken, R.M., and J.W. Zellner. 2013b. Updated Analysis of the Effects of Passenger Vehicle Size and Weight on Safety, Phase II; Preliminary Analysis Based on 2002 to 2008 Calendar Year Data for 2000 to 2007 Model Year Light Passenger Vehicles to Induced-Exposure and Vehicle Size Variables. DRI-TR-13-02. Torrance, CA: Dynamic Research, Inc. May.
Van Auken, R.M., and J.W. Zellner. 2013c. Updated Analysis of the Effects of Passenger Vehicle Size and Weight on Safety; Sensitivity of the Estimates for 2002 to 2008 Calendar Year Data for 2000 to 2007 Model Year Light Passenger Vehicles to Induced-Exposure and Vehicle Size Variables. DRI-TR-13-04. Torrance, CA: Dynamic Research, Inc. May.
Wenzel, T. 2010. Analysis of the Relationship Between Vehicle Weight/Size and Safety, and Implications for Federal Fuel Economy Regulation, Final Report prepared for the Office of Energy Efficiency and Renewable Energy, U.S. Department of Energy. http://energy.lbl.gov/ea/teepa/pdf/lbnl-3143e.pdf.
Wenzel, T. 2012a. Assessment of NHTSA’s Report “Relationships Between Fatality Risk, Mass, and Footprint in Model Year 2000-2007 Passenger Cars and LTVs”. Final report prepared for the Office of Energy Efficiency and Renewable Energy, US Department of Energy. Lawrence Berkeley National Laboratory. August. LBNL-5698E. http://energy.lbl.gov/ea/teepa/pdf/lbnl-5698e.pdf.
Wenzel, T. 2012b. An Analysis of the Relationship between Casualty Risk per Crash and Vehicle Mass and Footprint for Model Year 2000-2007 Light-Duty Vehicles. Final report prepared for the Office of Energy Efficiency and Renewable Energy, US Department of Energy. Lawrence Berkeley National Laboratory. August. LBNL-5697E. http://energy.lbl.gov/ea/teepa/pdf/lbnl-5697e.pdf.
Wenzel, T. 2013. Assessment of DRI’s Two-Stage Logistic Regression Model Used to Simultaneously Estimate the Relationship between Vehicle Mass or Size Reduction and U.S. Fatality Risk, Crashworthiness/Compatibility, and Crash Avoidance. Draft report prepared for the Office of Energy Efficiency and Renewable Energy, U.S. Department of Energy. Lawrence Berkeley National Laboratory. January.
Wernle, B. 2014. Ford Dealers Throng Training on How to Fix Aluminum F-150. Automotive News, May 5. http://www.autonews.com/article/20140505/RETAIL05/305059973/ford-dealers-throng-training-on-how-to-fix-aluminum-f-150.


