Technologies for Reducing Fuel Consumption in Compression-Ignition Diesel Engines
The compression-ignition (CI) diesel engine has long been used in the over-the-road, heavy-duty-vehicle sector of trucks and buses in the United States and is recognized as the most fuel-efficient internal combustion engine. However, the diesel engine has not penetrated the U.S. light-duty vehicle market, consisting of Class 1 and 2a1 passenger cars and light trucks, with less than 1 percent of new LDVs sales in 2014. In contrast, diesel engines have significantly penetrated the Class 2b pickup and van market, with approximately 50 percent market share in 2014, and the light-duty passenger car and light truck vehicle market in Europe, with approximately 56 percent market share in 2013.
This chapter begins with a review of the fundamentals of CI engines and their role in the 2017-2025 MY final CAFE rulemaking. The next section discusses the available technologies for reducing fuel consumption, carbon dioxide, and criteria emissions in advanced diesel engines. This is followed by a discussion of estimated incremental costs of diesel engines relative to baseline gasoline engines. The incremental retail prices of diesel-powered vehicles relative to gasoline-powered vehicles are reviewed together with the current and projected future diesel vehicle offerings. The low market share penetration of diesel-engine-powered vehicles in the United States currently and the role of these vehicles in achieving the 2017-2025 CAFE standards will be discussed. New and emerging technologies, including the use of alternative fuels in diesel engines and advanced combustion systems, are discussed. The chapter concludes with the committee’s findings and recommendations regarding diesel engines. Estimates of effectiveness in fuel consumption reductions and costs are developed throughout the chapter, and a complete set of estimates for the diesel technologies applied to a midsize car, a large car, and a large light truck are provided in Table 3A.1 for effectiveness of reduction in fuel consumption and Tables 3A.2a, b, and c for direct manufacturing costs (see annex at end of this chapter).
COMPRESSION IGNITION ENGINE EFFICIENCY FUNDAMENTALS
Light-duty CI engines operating on diesel fuels have the highest thermodynamic cycle efficiency of all light-duty engine types. The diesel thermodynamic cycle efficiency advantage over the more common spark-ignition (SI) gasoline engine stems from three major factors: the diesel engine’s use of lean mixtures, its lack of need for throttling the intake charge, and its higher compression ratios. The diesel thermodynamic cycle is shown on a P-V diagram and compared with the Otto cycle representation of the SI engine in Appendix D.
Lean fuel mixtures are thermodynamically more efficient than rich mixtures because of the higher ratio of specific heats. Such mixtures are enabled by the diesel combustion process. In this process, diesel fuel, which has chemical and physical properties to ensure that it self-ignites readily, is injected into the cylinder late in the compression stroke. This ability to operate on overall lean mixtures allows diesel engine power output to be controlled by limiting the amount of fuel injected without resorting to throttling the amount of air inducted. This attribute leads to the second major factor enabling the higher efficiency of the diesel engines, namely the absence of throttling during the intake process, which otherwise leads to negative pumping work. Finally, the diesel combustion process needs higher compression ratios to ensure ignition of the heterogeneous mixture without spark ignition. The higher diesel compression ratios (e.g., 16-18 versus 9-11 for SI gasoline engines) improve thermodynamic expansion efficiency, although some of the theoretical gain is lost due to increased ring-to-bore wall friction from higher
_____________
1 The Federal Highway Administration (FHWA) organizes vehicles into classifications. Light-duty Class 1 and 2a vehicles are under 8,500 lb. gross vehicle weight (GVW), although medium-duty passenger vehicles (MDPVs) from 8,500 lb to 10,000 lb. GVW are included. Class 2b pickups are classified as heavy-duty trucks with a gross vehicle weight rating (GVRW) between 8,500 lb and 10,000 lb as classified by the FHWA.
cylinder pressures and friction from larger bearings required to withstand the resulting higher loads in the engine.
The diesel-engine-powered vehicles also achieve more miles per gallon than SI gasoline powered vehicles due to the higher heating value of diesel fuel (128,450 Btu/gal) vs. gasoline (116,090 Btu/gal). The approximately eleven percent higher heating value results in an eleven percent better fuel consumption on a volumetric basis. At the pump, diesel fuel also costs more than regular gasoline in most areas of the United States. For the first 6 months of 2014, the average price of diesel fuel was $3.87/gal, while regular gasoline was $3.59/gal, or approximately 8 percent higher costs for diesel fuel. However, early projections of diesel fuel prices in 2015 expect a national average of $2.84/gal and a rise to $3.24 in 2016 (EIA 2015). The effect of this price decrease on diesel vehicle penetration in the U.S. market is currently unknown.
The exhaust emissions from diesel engines have been regulated since the 1960s for light-duty diesels and 1973 for heavy-duty diesels. The current regulations of the Environmental Protection Agency (EPA) and the California Air Resources Board (CARB) require control of criteria emissions of hydrocarbons (HC), carbon monoxide (CO), oxides of nitrogen (NOx), and particulate matter (PM). The CO emissions of diesels are inherently low due to lean combustion, and HC emissions are low compared to gasoline engines. The NOx and PM emissions have been controlled through engine technology, but recently more stringent standards have resulted in aftertreatment being used for PM (which is reduced with diesel particulate filters [DPF]) and NOx (which is controlled with selective catalytic reduction [SCR]). This is discussed in greater detail later in the chapter.
Although diesel fuel has higher energy content per gallon than gasoline, it also has a higher carbon density that results in approximately 15 percent more carbon dioxide emitted per gallon of diesel fuel relative to a gallon of gasoline. Diesel produces 10,180 g of carbon dioxide per gallon when burned, while gasoline produces 8,887 g of carbon dioxide per gallon (EPA/NHTSA 2012a). The EPA/National Highway Traffic Administration (NHTSA) Joint Technical Support Document refers to the additional carbon dioxide released from the burning of a gallon of diesel, relative to the burning of a gallon of gasoline, as the “carbon penalty” (EPA/NHTSA 2012b). Due to the cited “carbon penalty,”a diesel vehicle yields greater fuel economy improvements compared to its CO2 emissions reduction improvements. Another consideration is that diesel fuel is generally slightly more efficient to refine than gasoline, and there is a potential CO2 and energy benefit when refining crude oil to diesel as compared with refining crude to gasoline. This possible offset is not accounted for in the Agencies’ regulations.
This issue is amplified in the final CAFE rule, which states that the “163 g/mi [carbon dioxide standard] would be equivalent to 54.5 mpg, . . . [assuming] gasoline fueled vehicles (significant diesel fuel penetration would have a different mpg equivalent)” (EPA/NHTSA 2012a). EPA and NHTSA cite the additional carbon dioxide released from burning diesel fuel, compared to burning gasoline, as one of the reasons why manufacturers might not invest significantly in diesel engine technologies as a way to comply with the CAFE and GHG standards for MY 2017-2025 (EPA/NHTSA 2012b).
EPA/NHTSA 2017-2025 CAFE Rulemaking
The Agencies’ CAFE rulemaking for the 2017-2025 time frame relies heavily on the analysis done in the previous 2012-2016 rulemaking. The 2017-2025 rulemaking acknowledges the benefits of diesel engines regarding reduced pumping losses, improved torque, diesel fuel’s higher energy content compared to gasoline, and lean combustion. In spite of these benefits, EPA and NHTSA’s Joint Technical Support Document (TSD) recognizes the challenges that manufacturers will face regarding tailpipe emissions of diesel vehicles due to the “carbon penalty” and the NOx reductions required in the U.S. Tier 2 Bin 2 standards. In addition, it is recognized that diesels will also need to meet the EPA Tier 3 rules (EPA/NHTSA 2012b; EPA 2014a) introduced in March 2014 (see Chapter 2).
In order to meet the stricter CAFE/GHG standards, the Agencies acknowledged the potential need for vehicle manufacturers to include diesels in their product strategies. According to the TSD, several vehicle manufacturers have indicated to the Agencies that diesels will be part of their strategy to meet the midterm goals. Manufacturers that produce more diesel-engine-powered vehicles have also informed the Agencies that they expect diesel technologies to be part of a feasible strategy for reducing fuel consumption, carbon dioxide, and NOx emissions in the future.
In analyzing the technology, the TSD discusses the challenges of reducing diesel emissions to meet future requirements while acknowledging the fuel consumption reduction benefits of diesel engines. The approach to reducing emissions will include a combination of improvements to the combustion system to reduce emissions leaving the engine and improvements to the aftertreatment system. Technologies to improve the combustion system include fuel systems with higher injection pressures and multiple injection capabilities, advanced control systems, higher levels of cooled exhaust gas recirculation (EGR) to reduce NOx emissions, and advanced turbocharger systems. The aftertreatment system will continue to consist of a diesel oxidation catalyst followed by a DPF, or a catalyzed DPF and an SCR system for NOx reductions.
During the analysis, the Agencies used performance as the equalizing metric to compare diesel and gasoline vehicles. For smaller vehicles, the Agencies applied an I4 diesel engine with a displacement of 2.0L to replace a larger displacement I4 gasoline engine. For large cars and mid-sized trucks, a large I4 diesel engine with a displacement of 2.8L was used instead of a larger displacement V6 gasoline engine. For
large light trucks and performance cars, a V6 diesel engine with a 4.0 L displacement was used instead of the larger displacement V8 gasoline engine. It was also assumed that all new diesels would include SCR aftertreatment.
In the cost analysis, there have been four major changes from the 2012-2016 rulemaking to the recent analysis. The first is that only SCR-based systems would be used for NOx control for all diesel engines, whereas lean NOx traps had been previously used for I4 engine applications. Second, the Agencies assumed that the vehicle manufacturers would meet Tier 2 Bin 2 emission standards rather than the previously assumed Tier 2 Bin 5 standards. Tier 2 Bin 2 emissions standards were assumed to require catalyst volumes 20 percent larger. Third, the Agencies updated the platinum group metals cost2 from the March 2009 values used for the 2012 to 2016 CAFE standards to the February 2011 values, which resulted in a 69 percent increase in cost per troy ounce. As of November 2014, the value of the platinum group metals is lower by 32 percent from the February 2011 value. EPA acknowledged that there is not a good option for handling platinum group metal costs but elected to be transparent by using the most recent price and reporting its basis. Finally, a $50 direct manufacturing cost was added for improvements associated with fuel and urea controls.
FUEL CONSUMPTION REDUCTION EFFECTIVENESS
NRC Phase 1 Study
The NRC Phase 1 study used the EPA full system simulation carried out by Ricardo, Inc. in 2008 to assess the fuel consumption and CO2 reductions of diesel engines relative to gasoline engines in three vehicle classes (NRC 2011). The results from this full system simulation were used to develop the committee’s estimate of fuel consumption reduction effectiveness, as described in this section. The engine system layout studied by Ricardo is shown in Figure 3.1 for a six-cylinder diesel engine in a passenger car. The following system components are included in this diesel engine layout.
Gas Handling System
A single-stage, variable nozzle turbocharger with air-to-air charge air cooling was used for boosting for I4 and V6 diesel engines for cars. For the large light-truck applications with a V6 diesel engine, boosting was accomplished with a two-stage, series sequential turbocharging system. The low-pressure turbine was fixed geometry with a wastegate. The high-pressure turbocharger included a variable nozzle turbine. High levels of cooled EGR were provided with a single-stage, high-pressure EGR system and an EGR cooler, although additional cooling was expected to be required in the 2017 to 2025 time frame. The EGR system included a cooler bypass to aid in cold start, light load emissions, and transient operation. Ricardo indicated that this configuration would likely require an EGR diesel oxidation catalyst (DOC) to mitigate fouling issues in the EGR cooler and intake system.
Combustion System
The geometric compression ratio of the engine was 17.5:1. The fuel system was a high-pressure common rail (HPCR) system with 1,800 bar solenoid-operated injectors. Glow plugs were used to aid in cold start, with one or more having cylinder pressure sensing capability for adaptation to fuel cetane variations.
Aftertreatment
Aftertreatment included a DOC, a DPF, and a Lean NOx Trap (LNT) (Figure 3.1). However, SCR was used for the V6 diesel engine for a large, light truck.
The results of the Ricardo full system simulations are summarized in the upper portion of Table 3.1. As will be discussed later in this chapter, the table shows that the reductions in CO2 emissions for the diesel relative to the gasoline engine are approximately 10 percentage points less than the reductions in fuel consumption. In this study, Ricardo evaluated the diesel powertrains in combination with other non-diesel fuel consumption reduction technologies, which were only applied to the diesel vehicles and not to the baseline gasoline vehicles. To normalize the results of these full system simulations, the committee applied estimates of the fuel consumption reduction effectiveness of these technologies from the NHTSA regulatory impact analysis (RIA), as shown in the lower portion of Table 3.1 (NHTSA 2012). After normalizing the full system simulation results for comparable technologies applied to both the diesel and gasoline vehicles, the diesel vehicles were shown to provide fuel consumption reductions of 26 to 29 percent relative to the gasoline vehicles.
For the 2017-2025 CAFE final rule, NHTSA combined “conversion to diesel” and “conversion to advanced diesel” into one technology labeled “advanced diesel.” Conversion to advanced diesel was defined in the NRC Phase 1 study as consisting of downsizing, downspeeding, friction reduction, and combustion improvements. The normalized fuel consumption reductions for diesel engines listed in Table 3.1 already included some of the features considered as part of NHTSA’s description of “conversion to advanced diesel”. Specifically, the Ricardo full systems simulations included downsizing with a 20 percent reduction in displacement. Another feature of the conversion to advanced diesel engine was downspeeding, but this technology was defined as increasing transmission ratios beyond 6, which would be accounted for as a transmission technology and is not included in the
_____________
2 In March 2009, platinum cost $1,085 per troy ounce; in February 2011 it was $1,829; and in November 2014 it was $1,240.
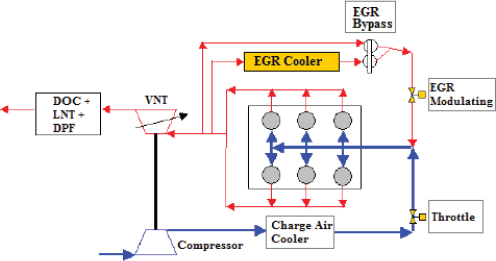
FIGURE 3.1 Schematic of the V6 diesel engine system for a passenger car used in the Ricardo full system simulation.
SOURCE: EPA/Ricardo (2008).
| Ricardo Full System Simulation Results Based on EPA (2008) | Small MPV | Full-Size Car | Truck | ||||||||||||||||
| Gasoline engine | 2.4L I4 | 3.5L V6 | 5.4L V8 | ||||||||||||||||
| Transmission | 4-sp AT | 5-sp AT | 4-sp AT | ||||||||||||||||
| Diesel engine | 1.9L I4 | 2.8L I4 | 4.8L V8 | ||||||||||||||||
| Transmission | 6-sp DCT | 6-sp DCT | 6-sp DCT | ||||||||||||||||
| Gasoline CO2 (g/mi) | 316 | 356 | 517 | ||||||||||||||||
| Diesel CO2 (g/mi) | 247 | 273 | 391 | ||||||||||||||||
| Reduction (%) | 21.8 | 23.3 | 24.2 | ||||||||||||||||
| Gasoline fuel consumption (gal/100 mi) | 3.596 | 4.051 | 5.883 | ||||||||||||||||
| Diesel fuel consumption (gal/100 mi) | 2.449 | 2.707 | 3.877 | ||||||||||||||||
| Reduction (%) | 31.9 | 33.2 | 34.1 | ||||||||||||||||
| Normalization of diesel vs. gasoline engines without non-diesel features | Small MPV | Full-Size Car | Truck | ||||||||||||||||
| Gasoline engine | 2.4L I4 | 3.5L V6 | 5.4L V8 | ||||||||||||||||
| Transmission | 4-sp AT | 5-sp AT | 4-sp AT | ||||||||||||||||
| Diesel engine | 1.9L I4 | 2.8L I4 | 4.8L V8 | ||||||||||||||||
| Transmission | 6-sp DCT | 6-sp DCT | 6-sp DCT | ||||||||||||||||
| Deletion of non-diesel features added only to diesel vehicle simulation (reduction in fuel consumption [%]a) | |||||||||||||||||||
| 6-sp AT replacing 4-sp AT | 2.0 | 2.0 | 2.1 | ||||||||||||||||
| 6-sp DCT replacing 6-sp AT | 4.1 | 3.8 | 3.8 | ||||||||||||||||
| Efficient accessories and high efficiency alternator | 1.2 | 1.0 | 1.6 | ||||||||||||||||
| Electric power steering | 1.3 | 1.1 | 0.8 | ||||||||||||||||
| Multiplicative total | 8.4 | 7.7 | 8.1 | ||||||||||||||||
| Normalized diesel fuel consumption (gal/100 mi) | 2.655 | 2.915 | 4.191 | ||||||||||||||||
| Percent reduction for diesel w/o added features vs. gasoline (%) | 26.2 | 28.0 | 28.7 | ||||||||||||||||
a Percent reductions in fuel consumption taken from NHTSA RIA (2012).
NOTE: AT, automatic transmission; DCT, dual clutch transmission; MPV, midsize passenger vehicle
SOURCE: NRC (2011) Table 5.1.
accounting for diesel engine fuel consumption reduction effectiveness improvements.
Applying the foregoing considerations, the estimated fuel consumption reductions for NHTSA’s advanced diesel were derived from the estimates for “conversion to diesel” shown in Table 3.1 by including the applicable technologies for “conversion to advanced diesel,” and the results are shown in Table 3.2. The fuel consumption reductions estimated by the committee agreed closely with NHTSA’s estimates shown in the last line of Table 3.2.
2014 MY Diesel Vehicle Fuel Consumption Reductions-EPA Certification Data
The EPA certification fuel economy (two-cycle combined CAFE) data of comparable current vehicles with gasoline and diesel engines were used to determine the reduction in fuel consumption provided by the diesel vehicles. The 36 diesel-powered 2014 MY vehicles were identified from the Diesel Technology Forum website. The fuel economy comparison for all of these vehicles is provided in Annex Table 3A.3 at the end of this chapter. The fuel consumption reduction data for diesel vehicles shows a range of 14 percent to 36 percent. A summary of the results for several of the comparisons of vehicles with automatic transmissions is shown in Table 3.3. The comparisons in this table were normalized to approximately equal performance by using the methodology described in Chapter 2. The diesel power was adjusted first to account for the characteristic higher peak torque relative to a naturally aspirated gasoline engine with comparable power. The performance of the gasoline engines were subsequently normalized to the adjusted power-to-weight ratio of the diesel vehicles using NHTSA’s formula (discussed in Chapter 2). The normalization resulted in minor changes to the results, since there were only small differences in power-to-weight ratio for the diesel and gasoline vehicles being compared in most cases. The reductions in fuel consumption provided by the diesel vehicles ranged from a low of 6.7 percent to a high of 28.9 percent compared to gasoline engine vehicles from the same manufacturer.
Table 3.3 shows the effectiveness of today’s diesel vehicles compared to their gasoline versions as having an average of 20 percent reduction in fuel consumption and a range of 6.7-28.9 percent reduction in fuel consumption using EPA’s normalized power-to-weight ratio conversions. Several reasons may be responsible for this lower average result and the wide range of results. First, many of the 2014 MY diesel vehicles had not fully implemented all of the features defined for the advanced diesel engine, which the committee estimates to result in a 29.0-30.5 percent reduction in fuel consumption. Second, there may be differences in the features of the diesel and baseline gasoline vehicles
| Technology Improvements | |||||||||||||||||||
| I4 | V6 | V8 | |||||||||||||||||
| Conversion to diesela (%) | 26.2 | 28.0 | 28.7 | ||||||||||||||||
| Conversion to advanced diesel | |||||||||||||||||||
| Downsizingb (%) 20% reduction in displacement Two-stage turbocharger |
4.0b | 4.0 b | 4.0 b | ||||||||||||||||
| Downspeedingc (%) | 1.5c | 1.5 c | 1.5 c | ||||||||||||||||
| — Increasing transmission ratios beyond 6 | |||||||||||||||||||
| Friction reduction (%) Dual pressure oil pump Nonrecirculating low-pressure fuel pump |
1.5 | 1.5 | 1.5 | ||||||||||||||||
| Combustion improvement (%) Greater than 2,000 bar injection pressure Piezo Injectors |
3 | 3 | 3 | ||||||||||||||||
| Multiplicative total (%) | 4.5 | 4.5 | 4.5 | ||||||||||||||||
| Total diesel fuel consumption reduction (%) | 29. 5 | 31.3 | 31.9 | ||||||||||||||||
| NHTSA estimated fuel consumption reduction (%) | 29.4 | 30.5 | 29.0 | ||||||||||||||||
a From Table 3.2 of the NRC (2011) report.
b Downsizing by 20 percent was already included in the Ricardo full system simulation and is not included in the accounting for the diesel engine fuel consumption reduction effectiveness.
c The downspeeding benefit is attributed to an increased number of transmission ratios beyond 6. This reduction in fuel consumption is accounted for as a transmission technology and is not included in the accounting for the diesel engine fuel consumption reduction effectiveness.
SOURCE: NRC (2011), Tables 5.8 and G.1.
| Vehicle | Diesel Vehicle Power (hp) | Diesel Vehicle Weight wt (lb) | Diesel Power – to – Weight Ratio (hp/lb) | Adjusted Power (hp) for Torquea | Gasoline Vehicle Power (hp) | Gasoline Vehicle Weight wt (lb) | Gasoline Power – to – Weight Ratio (hp/lb) | Gasoline gpm Mod/Gasoline gpm | Diesel gpm % Reduction Relative to Gas gpm Mod | ||||||||||
| Audi A6 | 240 | 4,178 | 0.057 | 0.061 | 220 | 3,726 | 0.059 | 1.01 | 26.3 | ||||||||||
| Audi A7 | 240 | 4,167 | 0.058 | 0.061 | 310 | 4,167 | 0.074 | 0.93 | 22.6 | ||||||||||
| Audi A8L | 240 | 4,564 | 0.053 | 0.056 | 333 | 4,365 | 0.076 | 0.90 | 18.1 | ||||||||||
| Audi Q5 | 240 | 4,475 | 0.054 | 0.057 | 220 | 4,079 | 0.054 | 1.02 | 22.0 | ||||||||||
| Audi Q7 | 240 | 5,412 | 0.044 | 0.047 | 280 | 5,192 | 0.054 | 0.97 | 15.0 | ||||||||||
| BMW 328i | 181 | 3,460 | 0.052 | 0.055 | 180 | 3,410 | 0.053 | 1.02 | 28.9 | ||||||||||
| BMW 535i | 255 | 4,255 | 0.060 | 0.064 | 241 | 3,814 | 0.063 | 1.00 | 23.7 | ||||||||||
| Chevy Cruze | 151 | 3,471 | 0.044 | 0.046 | 138 | 3,206 | 0.043 | 1.02 | 22.5 | ||||||||||
| Porsche Cayenne | 240 | 4,797 | 0.050 | 0.053 | 300 | 4,398 | 0.068 | 0.92 | 6.7 | ||||||||||
| VW Beetle | 140 | 3,157 | 0.044 | 0.047 | 170 | 2,948 | 0.058 | 0.93 | 15.0 | ||||||||||
| VW Golf | 140 | 3,120 | 0.045 | 0.048 | 170 | 3,102 | 0.055 | 0.95 | 21.6 | ||||||||||
| VW Jetta | 140 | 3,457 | 0.040 | 0.047 | 115 | 2,804 | 0.041 | 1.05 | 28.0 | ||||||||||
| VW Passat | 140 | 3,494 | 0.040 | 0.042 | 170 | 3,221 | 0.053 | 0.93 | 23.1 | ||||||||||
| VW Touareg | 240 | 4,974 | 0.048 | 0.051 | 280 | 4,711 | 0.059 | 0.96 | 11.9 | ||||||||||
aAdjusted hp/wt to account for approximately 6 percent more torque of diesel during 0-60 mph acceleration (power equal to gasoline engine.
NOTE: gpm, gal/mile; Mod, modified for equal power/weight.
being compared that were not identified in the EPA database. Third, there may be a difference in the maturity of the diesel and gasoline engines that are being compared.
These comparisons of diesel and gasoline vehicles provided an opportunity to determine if a relationship existed between downsizing and reduction in fuel consumption for the diesel vehicles. However, no significant correlation was found due in part to the wide range of results. However, engines with the larger percentage downsizing consistently provided reductions in fuel consumption with generally higher values.
COMBUSTION IGNITION ENGINE CRITERIA EMISSION REDUCTION
Criteria Emission Standards
Various studies used throughout this chapter reference a variety of criteria emission standards. The referenced federal and California emission standards are listed in Table 3.4. The NOx standard is the same for the federal Tier 2 Bin 5 and California ULEV II standards, although the non-methane organic gases (NMOG) standard is significantly lower for the ULEV II standard. Vehicles can be certified to the ULEV II standard and be compliant under the Tier 2 Bin 5 standard. The NOx standard for Tier 2 Bin 2 is significantly lower than the Tier 2 Bin 5 standard. A similar level of NOx and NMOG control is provided with the recently published federal Tier 3 Bin 30 and California LEV III standards (since NMOG + NOx = 0.03 g/mi is equivalent to NMOG = 0.01 g/mi plus NOx = 0.02 g/mi). Relative to the Tier 2 Bin 2 standard, the PM standard has been lowered from 0.010 g/mi to 0.003 g/mi for the federal Tier 3 Bin 30 and the California LEV III standards. By 2028, the California LEV III PM standard is reduced further to 0.001 g/mi.
HC/CO Control
In spite of relatively low exhaust temperatures, the control of HC/CO has traditionally been relatively easy for diesel engines due to the relatively low levels of these constituents emitted from conventional diesel combustion. However, that situation has changed as the diesel combustion process has been modified to reduce combustion-gas temperatures, which reduces exhaust temperatures even further. As the combustion temperatures have been reduced, HC/CO emissions have risen. The DOC was introduced around 1996 to reduce hydrocarbon emissions and to reduce the soluble organic fraction of the particulate matter. As a result of the reduced exhaust temperatures noted above, the DOC is being moved closer to the turbocharger outlet to increase the temperature of the catalyst to increase its conversion effi-
| Emission Standard | Federal or California | NMOGa + NOX | NMOGa | CO | NOx | PM | Mileage | ||||||||||||
| ULEV II | California | 0.055 | 2.1 | 0.07 | 0.010 | 120,000 | |||||||||||||
| Tier 2 Bin 5 | Federal EPA | 0.09 | 4.2 | 0.07 | 0.010 | 120,000 | |||||||||||||
| Tier 2 Bin 2 | Federal EPA | 0.01 | 2.1 | 0.02 | 0.010 | 120,000 | |||||||||||||
| Tier 3 Bin 30 | Federal EPA | 0.03 | 1.0 | NA | 0.003 | 150,000 | |||||||||||||
| LEV III | California | 0.03 | 1.0 | NA | 0.003 | 150,000 | |||||||||||||
| LEV III | California | 0.03 | 1.0 | NA | 0.001 | By 2028 | |||||||||||||
aFor diesel-fueled vehicles, NMOG means non-methane hydrocarbons (NMHC).
ciency. Oxidation catalyst coatings are being added to diesel particulate filters (with DPFs thus becoming catalyzed DPFs) for additional HC/CO control and to provide the temperature rise required for regeneration, as discussed the next section.
Particulate Control
Particulate matter is being controlled using DPFs. These PM filters are quite effective, filtering out 90 to 99 percent of the PM from the exhaust stream, making diesel engines more attractive from an environmental impact point of view. However, PM accumulates in the filters and imposes additional back pressure on the engine’s exhaust system, thus increasing pumping work done by the engine. This increase in pumping work increases fuel consumption. In addition, there is a second fuel consumption penalty caused by the additional fuel required to regenerate the filter by oxidizing retained PM. The low exhaust temperatures encountered in light-duty automotive applications of these filters are insufficient to passively oxidize the accumulated PM. As a result, exhaust temperatures must be increased by injecting fuel (most frequently in the engine cylinder after combustion has been completed) which will be oxidized as the fuel and exhaust gas mixture passes over the DOC or catalyzed DPF. These hot gases flow directly to the DPF to oxidize the PM retained in the filter. Engine control algorithms for filter regeneration not only must sense when the filters need to be regenerated and control the regeneration without overheating the filter, but these algorithms must also contend with other events like the driver turning off the engine while regeneration is underway, thus leaving an incompletely regenerated filter. When the vehicle is then restarted, the control algorithms must appropriately manage either completion of the regeneration or start of a new filling and regeneration cycle. These algorithms have become quite sophisticated, with the result that PM filter systems are quite reliable and durable.
NOx Control
There are two approaches to aftertreatment of NOx emissions: NOx storage and reduction catalysts, which are also called lean NOx traps, and selective catalytic reduction devices using ammonia as a reducing agent for NOx.
NOx Storage Catalysts
NOx storage catalysts (NSC) utilize a typical monolith substrate that has barium and/or potassium as well as a precious metal (e.g., platinum) in its coatings. These coatings adsorb NOx from the exhaust gas to form nitrates, thereby storing the NOx in the catalyst. As NOx is adsorbed from the exhaust, adsorption sites on the surface of the coating fill up. Once all the coating sites are filled with adsorbed NOx, the NSC can no longer adsorb additional NOx so it passes through the NSC without being adsorbed. Since this pass-through would not be acceptable, before the catalyst is completely filled the NSC must be regenerated to purge the adsorbed NOx and free the sites to adsorb additional NOx. By supplying the NSC with a rich exhaust stream containing CO and hydrogen, the CO and H2 molecules desorb the NOx from the catalyst surface and reduce it to N2, H2O, and carbon dioxide. Therefore, like the PM filter, the NSC operates in a cyclic fashion, first filling with NOx and then purging the NOx.
Selective Catalytic Reduction
Selective catalytic reduction (SCR) has been applied to heavy-duty diesel engines in the United States since 2007 and also in Europe. SCR was introduced in the U.S. in light-duty vehicle applications in 2009 on some Mercedes, BMW, and VW diesel vehicles. This system, called BlueTEC, was jointly developed by three manufacturers. SCR functions by injecting ammonia in the form of an aqueous solution of urea into the exhaust stream, which then passes over a copper-zeolite or iron-zeolite SCR catalyst. The aqueous solution of ammonia is called diesel exhaust fluid (DEF) in the U.S. and AdBlue in Europe, and must be carried on board the vehicle in sufficient quantities. The ammonia reacts with the NOx over the SCR catalyst, reducing the NOx to N2 and water. The amount of urea that needs to be supplied to the SCR catalyst depends on the level of NOx in the exhaust and
therefore depends on driving conditions, but for light-duty vehicles it is a small fraction of the fuel flow.
Combined NSC and SCR Systems
Another strategy that has been proposed is to use a system in which the NSC is followed by SCR without external urea addition. Under some operating conditions with the appropriate washcoat formulation, NSCs can convert NOx to ammonia, which is undesirable for an NSC-only system and hence must be cleaned up before exiting the exhaust system. However, by following the NSC with a SCR catalyst without urea injection, which is generally called passive SCR, the SCR will capture and store the ammonia generated by the NSC and use it to reduce NOx. Since the amount of ammonia generated by the NSC is not large, the passive SCR unit will have low conversion efficiencies but can be a useful supplement to the NSC system. This approach has been used by Mercedes in its BlueTEC I system in Europe.
SCRF, SCR on a DPF
The SCR-on-filter (SCRF) technology consists of applying an SCR coating on the DPF in the current DOC + DPF + SCR system. This system results in positioning the SCRF closer to the engine for improved light-off, improved low-temperature/cold-start performance, and lower back pressure. Several SCRF configurations are currently being developed. One configuration consists of two layers of catalyst, with the first coat using a silica and Ce/Zr SCR formulation and with the second coat using Fe/zeolite or vanadium (Michelin et al. 2014). Another configuration consists of a Cu-zeolite formulation for better high-temperature durability (Johansen et al. 2014). An alternative concept proposes a DOC + SCRF + underfloor SCR with the SCRF optimized for high NH3 storage and high NOx conversion and the underfloor SCR catalyst used for NH3 slip management and extra NOx conversion during high load conditions (Wang et al. 2007).
In summary, diesel emission control continues to include basic improvements in diesel combustion and extensive use of aftertreatment technology. Improvements are continuing to be researched. Aftertreatment technology is expensive and results in small increases in fuel consumption due to the extra fuel required to regenerate the DPF and the increased back pressure resulting from the DPF. In addition, the operating costs will increase as the cost of the DEF must be added to the cost of the fuel.
DIESEL ENGINE AND DIESEL VEHICLE COST DATA
Costs from NRC Phase 1 2011 Report
In the absence of teardown cost studies for current diesel engines, costs were developed using input from previous studies together with costs contained in the EPA/NHTSA Technical Support Document. Developing updated costs included several steps. First, the costs for diesel engines developed in the NRC Phase 1 report Assessment of Fuel Economy Technologies for Light-Duty Vehicles were reviewed and used for diesel engines complying with the Tier 2 Bin 5 emissions standards. In the next step, costs of the appropriate features of NHTSA’s “conversion to advanced diesel” were added to the Tier 2 Bin 5 diesel engines. Finally, the incremental costs to achieve Tier 3 emission standards were developed and added to the Tier 2 Bin 5 advanced diesel. These steps are described in the following sections.
Diesel Costs at Tier 2 Bin 5 Emission Levels—From NRC Phase 1 Report
Incremental costs of diesel engines at Tier 2 Bin 5 emissions levels were developed in the NRC Phase 1 report. These costs were developed from a Martec study in 2007-2008 using a methodology referred to as a bill of materials process (Martec 2008). The Martec study is described in Annex 3B. Martec sought input from vehicle manufacturers and suppliers with the goal of reaching consensus and agreement on the cost estimates. The costs developed in the Phase 1 study are summarized in Table 3.5. Cost are included for the common rail fuel injection system; the variable geometry turbocharger with air-to-air charge air cooler; electrical upgrades; engine upgrades; high-pressure and low-pressure EGR system; Tier 2 Bin 5 emissions control system; and onboard diagnostics and associated sensors. Credits were provided for SI-engine-related components that were deleted.
CONVERSION TO ADVANCED DIESEL—FROM NRC PHASE 1 REPORT
The “conversion to advanced diesel” required adding the costs for engine downsizing, friction reduction, a low-pressure EGR system, and high-pressure piezo injections. The costs of these features are listed in Table 3.6 and added to the previously developed diesel costs to provide the advanced diesel incremental costs. Engine downsizing requires the application of two-stage turbocharging for all engine configurations. Additionally, to maintain equal power and torque, the downsized engines will have to operate at higher brake mean effective pressure (BMEP) levels, which require higher-pressure-compatible bearings, stronger materials, higher-temperature-capable valve seats, more expensive head gasket materials, and noise, vibration and harshness (NVH)-control technologies, all of which would increase the cost. The incremental cost for the EGR system results from the addition of two-stage turbocharging to the advanced diesel engines. Friction reductions were achieved with a dual-pressure oil pump and a non-recirculating low-pressure fuel pump. The common rail fuel injection pressure for the advanced diesel was increased from 1,800 bar to over 2,000 bar, and piezo injectors replaced solenoid injectors.
| SI Gasoline Engine | SI: 2.4L I4 | SI: 4.0L-4.2L V6 | SI: 5.3L-6.2L V8 | ||||||||||||||||
| CI Diesel Engine | CI: 2.0L I4 | CI: 3.5L V6 | CI: 3.5L V6 | ||||||||||||||||
| Common rail 1,800 bar fuel system1 | 675 | 911 | 911 | ||||||||||||||||
| Variable geometry turbocharger (VGT) with air-air charge air cooler | 375 | 485 | 830a | ||||||||||||||||
| Electrical upgrades: starter motor, alternator, battery can cabin heater | 125 | 167 | 167 | ||||||||||||||||
| Engine upgrades: cam, crank, con rods, bearings, pistons, oil lines, countermeasures to engine/vehicle NVH | 161 | 194 | 194 | ||||||||||||||||
| HP/LP EGR system2,b | 215 | 226 | 226 | ||||||||||||||||
| DOC+DPF+SCR (NSC for I4)c | 688 | 964 | 1,040 | ||||||||||||||||
| (Included PGM cost in 2009$) | (PGM 597) | (PGM 296) | (PGM 372) | ||||||||||||||||
| (Included urea dosing system) | (NSC) | (urea sys. 363) | (urea sys. 363) | ||||||||||||||||
| Onboard diagnostics and sensors3 | 154 | 227 | 227 | ||||||||||||||||
| Total diesel incremental cost | 2,393 | 3,174 | 3,595 | ||||||||||||||||
| Credits included in costs shown above | I4 to I4 | V6 to V6 | V8 to V6 | ||||||||||||||||
| 1 SI engine content deleted | (32) | (48) | (48) | ||||||||||||||||
| 2 PFI emissions and evaporative system deleted | (245) | (343) | (200) | ||||||||||||||||
| 3 Switching oxygen sensors deleted | (18) for 2 | (36) for 4 | (36) for 4 | ||||||||||||||||
NOTES: HP/LP, high-pressure/low-pressure; NVH, noise, vibration, and harshness; PFI, port fuel injection; PGM, platinum group metals; NSC, NO x storage and reduction catalysts.
a One variable geometry turbocharger and one fixed geometry turbocharger.
b HP EGR system is shown on Ricardo diesel system schematic.
c Tier 2, Bin 5.
SOURCE: NRC (2011).
| Average Direct Manufacturing Cost (2008 dollars) | |||||||||||||||||||
| I4 | V6 | V8 | |||||||||||||||||
| Conversion to diesel | 2,393 | 3,174 | 3,595 | ||||||||||||||||
| Conversion to advanced diesela | |||||||||||||||||||
| Downsizing | 50 | 75 | 75 | ||||||||||||||||
| Two-stage turbocharger | 375 | 375 | 0 | ||||||||||||||||
| Dual-pressure oil pump | 5 | 6 | 6 | ||||||||||||||||
| Non-recirculating low-pressure fuel pump | 10 | 12 | 12 | ||||||||||||||||
| EGR system enhancement | 95 | 95 | |||||||||||||||||
| High-pressure (>2,000 bar) piezo injectors | 80 | 120 | 120 | ||||||||||||||||
| Total | 520 | 683 | 308 | ||||||||||||||||
| Advanced diesel incremental cost | 2,913 | 3,857 | 3,903 | ||||||||||||||||
a From Table 5.8 of NRC Phase 1 report (NRC 2011).
TIER 3 FROM TIER 2 BIN 5 INCREMENTAL COSTS – FROM TSD
The incremental costs to achieve Tier 2 Bin 2 emission standards (similar to Tier 3 for NMOG + NOx, as shown in Table 3.4) relative to Tier 2 Bin 5 emission standards were developed by comparing NHTSA’s direct manufacturing costs for the 2017-2025 CAFE standards at Tier 2 Bin 2 emission standards with the direct manufacturing costs for the 2012-2016 CAFE standards at Tier 2 Bin 5 emissions standards. This comparison is shown in Table 3.7, in which the incremental costs for Tier 2 Bin 2 emissions controls were developed. This comparison included the following steps. First, the GDP modifier was applied to NHTSA’s estimated cost for diesel at Tier 2 Bin 5 emission standards to convert them from 2007 dollars to 2010 dollars. Next, reverse learning was applied to NHTSA’s 2017 costs (2010 dollars) for the diesel at Tier 2 Bin 2 emission standards to convert them to 2012 costs. Finally, the difference between these two costs yields the incremental direct manufacturing costs of the Tier 2 Bin 2 emissions control systems over the Tier 2 Bin 5 emission control systems.
Cost Estimates for Advanced Diesel at Tier 2 Bin 2 Emissions
The final step in determining the diesel engine costs at Tier 3 emission levels required adding the incremental Tier 2 Bin 2 emission control costs to the advanced diesel engine costs, as shown in Table 3.8. The GDP multiplier was applied to the advanced diesel engine cost for 2009 (2008 dollars) shown in Table 3.6 to bring these cost up to the 2010 dollar level. Then, appropriate learning factors were applied to bring these costs to the 2012 base year and then to the 2017 MY. The Tier 2 Bin 2 emission costs were added to these advanced diesel engine costs to yield the advanced diesel costs shown in the table.
The committee’s estimated direct manufacturing costs, derived using the process shown in Table 3.8, are listed in Table 3.9 for 2017, 2020, and 2025 and compared with NHTSA’s estimated costs. As shown in the table, the committee’s estimated direct manufacturing costs are approximately 31 to 47 percent higher than NHTSA’s estimated costs. The NRC Phase 1 report was peer reviewed and published with the basis for the advanced diesel costs. In addition, the incremental costs used to estimate the cost of the Tier 2 Bin 2 emission control system relative to the Tier 2 Bin 5 emission control system were derived directly from NHTSA’s
| Step | Source | Year | Year$ | Standard Car (I4 2.0L) | Large Car (V6 3.0L) | Large Truck (V6 4.0L) | |||||||||||||
| 1 | 2012-2016 rulemaking Tier 2 Bin 5 | 2012 | 2007$ | $1,697 | $2,399 | $2,676 | |||||||||||||
| 2 | Apply GDP multiplier (1.04) | 2012 | 2010$ | $1,765 | $2,495 | $2,766 | |||||||||||||
| 3 | 2017-2025 rulemaking Tier 2 Bin 2 | 2017 | 2010$ | $2,059 | $2,522 | $2,886 | |||||||||||||
| 4 | Apply reverse learning 2017 to 2012 (0.89) | 2012 | 2010$ | $2,367 | $2,899 | $3,317 | |||||||||||||
| 5 | Cost for Tier 2 Bin 2 over Tier 2 Bin 5 (Subtract 2 from 4) | 2012 | 2010$ | $602 | $404 | $551 | |||||||||||||
| Year | Year$ | Standard Car (I4 1.6L) | Large Car (V6 2.8L) | Large Truck (V8 3.5L) | |||||||||||||||
| NRC 2011 Estimate (Tier 2 Bin 5) | 2009 | 2008$ | $2,913 | $3,857 | $3,903 | ||||||||||||||
| Apply GDP Multiplier (1.02)a | 2009 | 2010$ | $2,971 | $3,934 | $3,981 | ||||||||||||||
| Apply Learning (1.18 and 1.04)b | 2017 | 2010$ | $2,421 | $3,206 | $3,244 | ||||||||||||||
| Tier 2 Bin 2 Emission Costs | 2017 | 2010$ | $ 602 | $ 404 | $ 551 | ||||||||||||||
| Diesel Engine Costs | 2017 | 2010$ | $3,023 | $3,565 | $3,795 | ||||||||||||||
a GDP multiplier of 1.02 applied for 2008$s.
b Yearly costs due to learning are reduced by 3 percent per year from 2009 to 2015 and 2 percent for the years 2016 and 2017.
| Advanced Diesel Engine at Tier 2 Bin 2 Emissions | MY 2017 | MY 2020 | MY 2025 | ||||||||||||||||
| NRC Estimated Most Likely DMCa | NHTSA Estimated DMCa | NRC Estimated Most Likely DMCa | NHTSA Estimated DMCa | NRC Estimated Most Likely DMCa | NHTSA Estimated DMCa | ||||||||||||||
| Midsized car I4 diesel engine | 3,023 | 2,059 | 2,845 | 1,938 | 2,572 | 1,752 | |||||||||||||
| Large car V6 diesel engine | 3,565 | 2,522 | 3,356 | 2,374 | 3,034 | 2,146 | |||||||||||||
| Large light truck V6 diesel engine | 3,795 | 2,886 | 3,571 | 2,716 | 3,228 | 2,455 | |||||||||||||
a Relative to baseline gasoline engine.
estimated costs. Additionally, the committee’s estimated costs are directionally consistent with input received from the vehicle manufacturers.
These advanced diesel costs were derived from NHTSA’s estimates for meeting Tier 2 Bin 2 emission standards. As shown in Table 3.4, the Tier 3 emissions standards, which were enacted after the final CAFE rule was issued, have essentially the same NMOG + NOx emission requirements as the Tier 2 Bin 2 standards. However, the Tier 3 standards have the additional requirement of 0.003 g/mi PM, which is a significant reduction from the Tier 2 Bin 2 PM requirement of 0.010 g/mi. A review of CARB certification test results shows that some current diesel cars are achieving 0.001 g/mi PM in certification testing, even though the current standard is 0.010 g/mi (CARB 2014). Therefore, current technology DPFs may be adequate for meeting the Tier 3 PM requirement. More test results are needed to confirm that the 0.003 g/mi PM standard would not require additional costs, as assumed in the cost analysis of the advanced diesel engine.
The committee examined NHTSA’s cost estimates by deducing the aftertreatment costs of $688 for Tier 2 Bin 5 emission standards and the $602 for the Tier 2 Bin 2 emission standards from NHTSA’s cost estimate of $2,059 for an I4 advanced diesel and found that the incremental diesel engine cost without emissions control systems would be $768. This estimate appears to be low when the common rail fuel injection system alone is estimated to cost $675 (from Table 3.6) without considering the cost of the turbocharger, the base engine upgrade, the EGR system, and the electrical system upgrades. This illustration suggests that an updated teardown cost study of a modern diesel engine is needed.
The committee reviewed other sources of cost estimates for diesel emission reduction technologies and compared them with the cost estimates developed in this report. The report of the International Council on Clean Transportation (ICCT), Estimated Cost of Emission Reduction Technologies for Light-Duty Vehicles (2012), provided costs for diesel engine aftertreatment systems meeting Euro 6 standards (Sanchez et al. 2012, Tables 4-11 through 4-14). The estimated costs for Euro 6 diesel engine aftertreatment system components consisting of DOC, DPF, and LNT or SCR are shown in Table 3.10 for several different engine displacements.
The 2012 ICCT report also estimated costs of emission control technologies that included engine modifications and aftertreatment systems for European diesel Euro 6 and U.S. Tier 2 Bin 5 standards as shown in Table 3.11 (Sanchez et al. 2012, Tables 4-16 through 4-18).
A wide range of cost estimates were found in reviewing other sources. The large variations were due to inconsistent emission standards ranging from Euro 6 to Tier 2 Bin 5 and a lack of detail in defining the engine and aftertreatment systems. However, the ICCT estimates for aftertreatment system costs ranging from $648 to $1,011 for Euro 6 emission standards are relatively consistent, with the NRC Phase 1 report
| Diesel Engine Displacement | 1.5L | 2.0L | 2.5L | 3.0L | |||||||||||||||
| DOC | 62 | 78 | 99 | 116 | |||||||||||||||
| DPF | 266 | 332 | 402 | 468 | |||||||||||||||
| LNT | 320 | 413 | 509 | 602 | |||||||||||||||
| SCR | 418 | 453 | 494 | 526/633b | |||||||||||||||
a Long-term costs as defined by ICCT = 0.8x (DMC + overhead + warranty cost); dollar year not defined.
b For meeting Tier 2 Bin 5 standard.
SOURCE: ICCT (2012).
| Euro 6b | Tier 2 Bin 5c | ||||||||||||||||||
| <2.0L | >2.0L | 2.0L I4 | 3.0L V6 | ||||||||||||||||
| Engined | $699 | $800 | $736 | $817 | |||||||||||||||
| Aftertreatment | $648e | $1,011e | $823e | $1,217f | |||||||||||||||
| Total Cost | $1,347 | $1,811 | $1,559 | $2,035 | |||||||||||||||
a Long term costs as defined by ICCT = 0.8x (DMC + overhead + warranty cost); dollar year not defined.
b Euro 6 standards (g/km) = 0.09 HC/0.5 CO/0.08 NOx/0.0045 PM.
c Tier 2 Bin 5 standards (g/km) = 0.056 NMHC/2.5 CO/0.04 NOx/0.006 PM.
d A/F control and engine-out emissions controls, consists of: 50% of fuel system, 50% of turbocharger, 50% of intercooler, 50% of VGT, EGR valves, EGR cooling system.
e Includes DOC, DPF, LNT.
f Includes DOC, DPF, SCR.
SOURCE: ICCT (2012).
showing aftertreatment costs ranging from $688 to $1,040 for Tier 2 Bin 5 emission standards.
Summary of Diesel Engine Technologies
Many of the technologies applied in the conversion to a diesel engine and the additional conversion to an advanced diesel engine were previously reviewed in the NRC Phase 1 report or the EPA/NHTSA Technical Support Document. EPA and NHTSA relied primarily on the study conducted by their contractor Ricardo for the technologies in the TSD (Ricardo Inc. 2011). These technologies are listed in the upper part of Table 3.12 and include not only technologies for the diesel engine, engine emission control, and aftertreatment systems, but also for the vehicle integration of the engine, which includes the cooling system, battery and electrical systems, torsional vibration damper, noise, vibration and harshness controls, and accommodation of the increased weight of the engine. Some of these technologies are directed toward new and emerging technologies, which will be discussed in a later section of this chapter. The lower part of Table 3.12 lists technologies that were not considered in the NRC Phase 1 study or the EPA/NHTSA TSD and that consist almost exclusively of new and emerging technologies.
Diesel Vehicle Incremental Cost
Diesel-engine-powered vehicles cost more than similar gasoline-engine-powered vehicles for a variety of reasons. Incremental costs are incurred not only due to the engine, engine emission control system, and aftertreatment system, but also due to vehicle integration costs related to the cooling system; electrical system components; NVH control; and handling the increased weight of the diesel engine. Some of these incremental costs for diesel-engine-powered vehicles were considered by EPA/NHTSA, but a detailed accounting was not provided in the TSD or other supporting documentation to determine if all of these costs were included. In contrast, the costs developed in the NRC Phase 1 study, which the committee used as the beginning point for the cost estimates in this report, included costs for nearly all of the following systems except for the cooling system, torsional vibration damper, and handling of the increased engine weight. This complete accounting of costs is partly responsible for the committee’s higher cost estimates for the diesel engines relative to NHTSA’s estimates.
Engine
The core diesel engine (cylinder block, cylinder head, crankshaft, camshaft, connecting rod and piston) needs to carry the loads from the increased compression ratio and the higher cylinder firing pressures. This results in the application of materials with higher strength such as cast iron or steel instead of aluminum, and castings and forgings instead of other types of lower-cost forming. The diesel engine also includes other components that cost more than a gasoline direct-injected, turbocharged engine. These components include the fuel injection system, which includes the fuel injection pump (with 2,000 bar pressure capability assumed for the advanced diesel, but rising in some applications to 2,500 bar), the fuel rail, high pressure fuel lines, and injectors. The diesel engine also includes a more expensive turbocharger that is likely to include variable geometry turbine nozzles to assist in driving the EGR to the intake system and an air-to-air intercooler or water-to-air aftercooler. A VVT system may also be employed in the future.
Engine Emission Control System
The diesel engine emission control system consists of the common rail fuel injection system, the electronic control module (ECM), the EGR system (which may be a low-pressure loop, a high-pressure loop, or a dual loop with both systems), EGR coolers, and various sensors and wiring
TABLE 3.12 Diesel Engine Technologies Considered by the Agencies and the NRC Phase One Study
| Technologies Considered by the NRC Phase One Study | Technologies Considered by both the EPA/NHTSA TSD and the NRC Phase One Study | Technologies Considered by the EPA/NHTSA Technical Support Document | |||||||||||||||||
|
• Downspeeding • Air-air intercooler and ducts • Pressure-sensing glow plugs • Combustion improvements • Reduced friction • Reduced accessory loads, water pump, fuel pump, etc. • NVH countermeasures • Two-state turbocharging with air-water intercooler • Dual-pressure oil pump • Cylinder-pressure-sensing glow plugs • 2,000 bar piezo-actuated injector • Improved low-pressure fuel pump • Engine (cam, crank, connecting rods, pistons) • High-pressure EGR with cooling • Low-pressure EGR with cooling |
• Downsizing • High-pressure common rail fuel system • VGT • Larger battery, alternator, and starter motor • Glow plugs |
• Powertrain mounting • Supplemental heater • Transmission modifications (damper) • Sound insulation enhancement • Smaller radiator |
|||||||||||||||||
| Technologies Not Considered in NRC Phase One Study or EPA/NHTSA TSD | |||||||||||||||||||
|
• Narrow-speed-range operation • Cylinder-pressure-sensing fuel injectors • Direct-acting piezo injectors • Variable valve timing (VVT) • Variable valve lift (VVL) • Onboard diagnostics (OBD) • Reduced compression ratio |
• Preturbine DOC • Mass reduction • Mechanical turbocompounding • Electrical turbocompounding • Electrification of front engine accessory drive (FEAD) • Closed-loop combustion control with in-cylinder pressure sensors • Electric ancillaries (coolant pump, oil pump, etc.) |
• Increased compression ratio • Advanced boosting technologies, e-turbines, e-compressors, superchargers • Calibration system optimization (engine + transmission + aftertreatment) |
|||||||||||||||||
harnesses. The onboard diagnostic (OBD) system must also be included to detect deterioration in these systems.
Aftertreatment System
The diesel aftertreatment system consisting of DOC, DPF, and SCR and the associated costs were discussed earlier in this chapter. However, the new technology of applying SCR catalyst coating on the DPF to provide a single-substrate SCR filter (SCRF) may lead to lower costs and improved emission reduction. Vehicle manufacturers see little prospect of significantly reducing aftertreatment costs, since U.S. Tier 3 standards and the California LEV III standards will tend to increase aftertreatment volumes and platinum group metal usage. The prospects of replacing urea injection systems with a lower cost ammonia system also appear to be minimal.
Cooling System
The diesel cooling system is more complex than for a gasoline engine and consists of the radiator, the air-to-air cooler, the EGR cooler, the thermostat and housing, and the water pump. The cooling system must dissipate heat from the engine cooling system, from the intercoolers or aftercoolers, from the EGR cooler, from the oil cooler, and from any other water-cooled component (such as a fuel cooler).
Battery, Starter (Cranking) Motor, and Alternator
Due to the higher torque needed to crank a diesel engine and the cold starting requirements, the manufacturers use a larger capacity battery with diesels than with gasoline engines. The starter motor and alternator also need to be larger in capacity.
Vibration Damper and Clutch
Diesel engines have higher firing torque pulse amplitude than gasoline engines, so they need more sophisticated torsional vibration damping. Torsional vibration dampers are generally included in automatic transmissions with lockup torque converters. However, the cost of a two-torsional damper system could increase the cost of the torque converter by 20 percent, and the centrifugal pendulum absorber could increase the cost of the torque converter by 50 percent. These incremental costs need to be included in the transmission costs for diesel engines.
Noise, Vibration, Harshness Issues
Significant reductions have been made in diesel engine noise as a result of emission control, common rail fuel systems, and diesel pilot injection. Manufacturers are installing other noise control systems such as engine covers, hood covers, firewall insulation, under-engine panels, tuned muffler systems, special glass on windows, and triple door seals (some of these features are also used on gasoline engines). The vibration and harshness issues are controlled with the torsional vibration damper (discussed previously) and with engine mounts. In some cases, active mounts may be required.
Increased Weight
If the diesel engine installation results in increased weight compared to the gasoline engine installation (although this may not be the case with downsized diesel engines) the increased weight could affect the design of the brakes and tires and possibly structural and suspension components.
Total Cost of Ownership
As discussed above, diesel-powered vehicles cost more than gasoline-powered vehicles. The University of Michigan Transportation Research Institute (UMTRI) did a study for the Robert Bosch Corporation in March 2013, Total Cost of Ownership: Gas Versus Diesel Comparison. The results show that diesel vehicles had a higher resale value than their gasoline counterparts after 3 years/45,000 miles and 5 years/75,000 miles. With the diesel vehicle’s better fuel economy, fuel costs for these periods were lower in spite of higher pump prices for diesel fuel. The total cost of ownership (TCO), considering depreciation, fuel, repairs, fees, taxes, insurance, and maintenance, was lower for all light-duty vehicles with diesels. For instance, for the VW Jetta and Golf, the TCOs were $3,128 and $5,013, respectively, less for diesels after 3 years/45,000 miles and $5,475 and $1,506 less for diesels after 5 years/75.000 miles. The incremental costs for these diesel vehicles are shown in Table 3.13. Although the price of the diesel engine option for a vehicle is higher than the gasoline engine vehicle, the resale value of the diesel option is also higher and the fuel costs are lower, so the total cost of ownership is lower.
Incremental Retail Price of Current Diesel Vehicles
Retail incremental prices for the diesel engine option in several vehicles are reviewed in this section. The following incremental diesel engine prices were recently published and the sources are noted:
- Chrysler RAM 1500. The diesel engine costs $2,860 more than the same truck with the V8 Hemi engine, which is a $1,900 premium over the standard V6 Pentastar engine. Therefore, the diesel is a $4,760 premium over the standard gasoline engine. (USA Today 2013).
- Chrysler Grand Cherokee. The diesel engine bears a $4,500 premium: “The diesel engine adds a $4,500 premium to the price, putting the sticker of a top end diesel-powered Grand Cherokee at $53,490, including shipping” (Automotive News February 25, 2013).
- Porsche Cayenne. The base price for the vehicle with the diesel engine of $56,725 is $6,900 more than the base price for a gasoline Cayenne.
- GM/Chevrolet Cruze. The Cruze diesel with 2LT trim vs. Cruze Eco with 1LT trim is $25,695 vs. $20,490. The difference is $5,205, except when the same trim is specified, the incremental cost is $3,224.
TABLE 3.13 Prices of Gasoline and Diesel Equivalent Vehicles (2013 dollars)
| Vehicle | With Gasoline Engine | With Diesel Engine | Diesel Incremental Price | ||||||||||||||||
| VW Beetle | 19,995 | 24,195 | 4,200 | ||||||||||||||||
| VW Golf 2-Door | 18,095 | 24,495 | 6,400 | ||||||||||||||||
| VW Passat SE | 23,945 | 26,295 | 2,350 | ||||||||||||||||
| VW Jetta SE | 20,420 | 23,196 | 2,776 | ||||||||||||||||
| VW Touareg | 47,535 | 51,035 | 3,500 | ||||||||||||||||
| Chrysler Ram vs V6 | 4,760 | ||||||||||||||||||
| Chrysler Ram vs V8 | 2,860 | ||||||||||||||||||
| Chrysler Cherokee | 4,500 | ||||||||||||||||||
| Porsche Cayenne | 6,900 | ||||||||||||||||||
| Chevrolet Cruze | 3,224 | ||||||||||||||||||
SOURCE: Volkswagen Web site (www.vw.com) and references given previously.
- Daimler/Mercedes GLK 250. The all-wheel drive 2.5L I4 diesel GLK 250 has a sticker price of $39,495. However, the I4 diesel GLK is priced $500 less than the 3.5L V6 gasoline engine GLK 350 with all-wheel drive, possibly reflecting the cost savings of downsizing the diesel engine with fewer cylinders.
- Volkswagen. Using Volkswagen’s website and the feature “build and price,” the diesel and gasoline equivalent vehicles were compared and are shown in Table 3.13 together with the foregoing comparisons.
In summary, the latest diesel engine incremental prices, based on prices in the current market for the limited number of vehicles evaluated, show that diesel-powered vehicles are priced higher than gasoline vehicles by an average of $4,147. These incremental prices are within the range of the committee’s estimated direct manufacturing costs, which suggests that these vehicle manufacturers may not be adequately recovering their overhead for their diesel vehicle offerings.
Diesel Product Offerings
Vehicle manufacturers introduced 22 additional diesel-powered light-duty vehicles to the U.S. market in 2013, which brings the total to 42 diesel offerings. By 2017, 54 diesel-powered light-duty vehicles are expected to be available in the U.S. market (Shuldiner 2013). A listing of anticipated new diesel offerings for 2014 through 2017 is provided in Table 3.14. Sales of 2014 MY diesel light-duty vehicles for the first 6 months of 2014 (see Table 3.14) totaled 75,509 and made up 0.93 percent of the new vehicle market (Cobb 2014).
Diesel Market Penetration
EPA and NHTSA developed a possible cost-effective compliance path in the final 2017-2025 CAFE rule that showed 0 percent penetration of diesel engines by 2025. This low market penetration for diesel engines is in contrast to the announced introductions of new diesel engine models by European and Asian vehicle manufacturers listed in Table 3.14. The diesel engine market penetration in the U.S. also increased to 0.93 percent in 2013 and EPA projected a 1.5 percent penetration in 2014 (EPA 2014b). However, sales of diesels in 2014 only reached 0.84 percent of all light- duty vehicle sales (Cobb 2015).
Vehicle manufacturers must also consider the costs for CAFE compliance. The cost effectiveness values of various fuel consumption reduction technologies, defined as the incremental cost per percent reduction in fuel consumption ($/% FC), are discussed in Chapter 8. An I4 diesel engine in a midsize car that can provide a 29.4 percent reduction in fuel consumption and with an estimated most likely direct manufacturing cost of $3,023 has a cost effectiveness of $103 per percent reduction in fuel consumption. Although this cost effectiveness is competitive with that of hybrid vehicles, it is about twice the cost per percent fuel consumption reduc-
TABLE 3.14 Light-Duty Diesel Vehicle Models
| Year | Manufacturer | Vehicle Model |
| 2014 | Volkswagen | Jetta, Passat, Golf, Tuareg, Beetle |
| Porsche | Cayenne | |
| Audi | Q7, Q5, A6, A7, A3, A8, A6 3.0 TDI Premium Plus | |
| Mercedes | GLK, ML, GL, E, S, R | |
| BMW | X5, 3 Series, 5 Series, 328d, 535d | |
| GM/Chevrolet | Cruze | |
| Chrysler/Jeep | Grand Cherokee | |
| Chrysler | RAM 1500 | |
| 2015 (Announced) | Audi | A3 TDI, A4 TDI, A3 Sportback TDI |
| Volkswagen | Golf Sportwagen TDI | |
| Porsche | Macan Diesel | |
| 2016 (Announced) | Volkswagen | Cross Blue Plug-in Hybrid TDI |
| Nissan | Titan with Cummins 5.0L V8 | |
| GM/Chevrolet | Colorado, GMC Canyon | |
| Toyota | Tundra with Cummins 5.0L V8 | |
| Mercedes Benz | G-Class SUV BlueTEC | |
| 2017 (Announced) | Audi | R8 TDI |
| Volkswagen | Golf GTD | |
tion for an SI engine with all of NHTSA’s fuel consumption reduction technologies applied. In addition, the SI engine with all of NHTSA’s technologies has been estimated to provide fuel consumption reductions within 2 percentage points of the diesel engine. These cost effectiveness considerations may be a limiting factor in the market availability and subsequent penetration of diesel engine vehicles in the United States.
This section will review new and emerging technologies that can reduce fuel consumption of diesel engines, including the use of alternative fuels. Progress in the ongoing research into alternative combustion systems, generally classified as low-temperature combustion, will also be reviewed. A complete set of estimates for these diesel technologies applied to a midsize car, a large car, and a large light truck are provided in Tables 3A.1 for effectiveness of reduction in fuel consumption and Tables 3A.2a, b, and c for direct manufacturing costs (annex at end of chapter).
Alternative Fuel Technologies
Utilization of alternative fuels in diesel engines has been receiving the attention of researchers at EPA, DOE and the national laboratories, vehicle manufacturers, universities, and the fuel industry. Some of the research programs/projects are related to reducing criteria emissions, but others are focused on reducing fuel consumption. A primary consideration for conventional diesel engines is the specification of fuel with a lower cetane number in the United States than in Europe and other parts of the world. Another consideration is the specification of biofuels designated B5 to B100 (where B5 indicates 5 percent biodiesel and 95 percent petroleum diesel) to ensure that these fuels can be a “drop-in fuel” for current diesel engines. Most engine manufacturers currently allow up to B20, but some manufacturers only allow up to B5.
The use of some alternative fuels that do not have cetane numbers within the current specification range must address the issue that the diesel CI engine does not tolerate low cetane or high octane fuels very well. Gasoline, with a very low cetane number, can be compression ignited in a diesel engine by using a higher compression ratio, about 23:1, but this concept has been applied only in military engines. The use of natural gas, also with a very low cetane number, has been receiving increased attention for heavy-duty diesel engines, but the principles should be applicable to light-duty diesel engines as well. Using natural gas in a diesel engine is accomplished by fumigating the natural gas (mixing the natural gas with the combustion air before it enters the combustion chamber) or injecting it directly into the cylinder, and igniting the gas with a pilot injection of diesel fuel. The direct injection of diesel fuel results in autoignition of a small kernel of diesel fuel, which propagates and ignites the natural gas fuel mixture without spark ignition. Natural gas combustion benefits from the high compression ratios. This process is categorized by EPA as a dual-fuel engine because it blends natural gas with diesel fuel.
Research and development is under way to develop dual-fuel compressed natural gas (CNG)/diesel engines with higher efficiency. Laboratory experiments and simulations show that a dual-fuel CNG/diesel modification of a 2.0L VW TDI engine achieved brake thermal efficiencies up to 39.5 percent using natural gas/diesel ratios of 98 percent/2 percent, at high loads (Ott et al. 2013). The high engine-out NOx emissions at high loads were reduced using a cost-effective three-way catalyst with stoichiometric operation instead of a NOx aftertreatment system. Accurate and robust dual-fuel combustion requires in-cylinder pressure measurements and advanced feedback control of the start and duration of the diesel injection. Control of transient operation, cold-start issues, and engine-out methane leakage are still under investigation. In contrast to a dual-fuel engine, a bi-fuel engine, which is also called a “switchable” system, can switch between diesel fuel and CNG (CNG Solutions 2012).
Advanced Combustion Systems
Low-temperature combustion technologies are methods for lowering criteria emissions while also having the potential to improve brake thermal efficiency and reduce fuel consumption in diesel engines. The direction for diesel combustion system technology development has been toward more premixed combustion and away from traditional diesel engine diffusion-type combustion. Higher levels of dilution, provided by large amounts of EGR, together with earlier injection and longer ignition delays, reduce both average and local temperatures and allow more mixing time, so that the local fuel-air ratios will be significantly leaner. This combination of lower temperatures and locally leaner mixtures minimizes the occurrence of diffusion flame combustion, which results in reduced NOx and PM emissions, as shown in Figure 3.2.
The combustion strategies that utilize this approach have been given many different names in the literature, including LTC (low-temperature combustion), PCI (premixed CI), and PCCI (premixed-charge CI). All of these partially homogeneous charge strategies drive the combustion process in the direction of HCCI (homogeneous-charge compression ignition), as shown in Figure 3.3. The term HCCI in its purest form refers to virtually homogeneous rather than partially homogeneous charge. To utilize these premixed forms of combustion, a number of measures are used to reduce temperatures and improve mixing of the charge. The simplest and most effective measure is increased EGR. In addition to increased EGR, lowering the compression ratio also reduces mixture temperatures and, as a bonus, allows increasing engine power without exceeding cylinder-pressure design
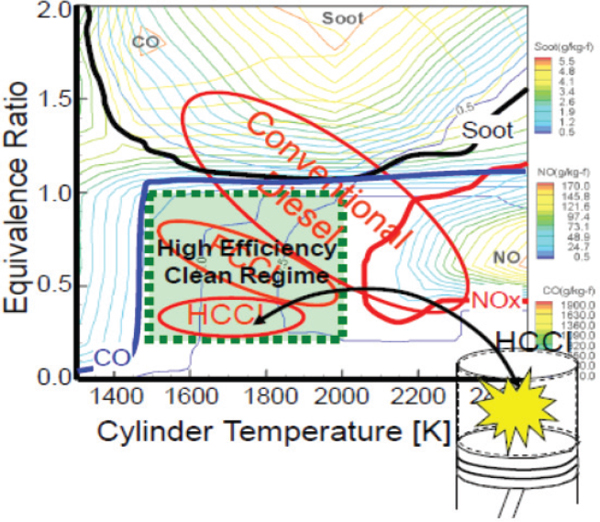
FIGURE 3.2 HCCI combustion regime with lean equivalence ratios and low temperatures for low NOx and PM emissions.
SOURCE: Figure courtesy of Prof. R.D. Reitz, Engine Research Center, University of Wisconsin-Madison (2010).
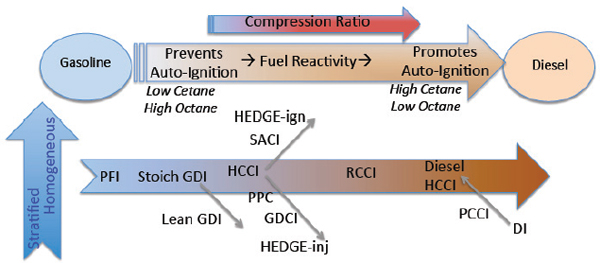
SOURCE: Daw et al. (2013), Oak Ridge National Laboratory (ORNL).
limits. However, lower compression ratios present challenges in developing acceptable cold-start performance in spite of improved glow plugs and glow plug controls. Technologies being developed to support the move in combustion technology toward premixed low-temperature combustion include piezo-actuated fuel injectors with higher injection pressures, cylinder-pressure-based closed-loop control, higher-pressure, two-stage turbocharger systems, and dual high- and low-pressure loop EGR systems.
In a conventional diesel engine, with the high reactivity of diesel fuel, autoignition follows fuel injection after a small delay. The injection is typically timed close to top dead-center (TDC) to accomplish high efficiency. Without premixed fuel-air mixtures in the end-gas, knock does not occur, so that high compression ratios can be used to achieve high fuel efficiency. The relative absence of premixed charge mixtures in conventional diesel engines is predominantly responsible for the higher emissions.
A modification being applied to diesel engines is the use of multiple injections, instead of a single injection, to allow fuel and air-mixing to create more homogenous conditions (Dec 2009). The partially mixed conditions reduce rich-lean spatiotemporal distributions to significantly reduce smoke. Experimental investigation of the benefits and the limits of this approach, called premixed charge compression ignition (PCCI), are under way for both light- and heavy-duty diesel engines (Hanson et al. 2010; Ra et al. 2011; Simescu et al. 2003; Song-Charng et al. 2004). To lengthen the autoignition delay to allow better mixing, a high EGR rate is used, which also reduces NOx emissions. Even with very high levels of EGR, diesel HCCI can be achieved in only a narrow operating range due to excessive rates of pressure rise at high loads. Although considerable effort has been pursued in controlling and optimizing diesel HCCI engines in Europe due to the significant cost benefit of simplifying the diesel exhaust aftertreatment, significantly wider operating ranges have not yet been realized.
In an effort to extend the range of PCCI, the University of Wisconsin has been pursuing the combustion concept of a dual fuel PCCI, called reactivity-controlled compression ignition (RCCI), where gasoline is injected by PFI and diesel fuel is directly injected, as shown in Figure 3.4. Both fuels mix in the cylinder, and the cetane number of the mixed fuel controls the ignition timing (Kokjohn et al. 2009). Despite the flexibility offered by the dual fuel, mode switches between RCCI and conventional direct injection (DI) are necessary at high load (Daw et al. 2013). Mode switches between RCCI and DI should be smoother than in pure HCCI-DI (or gasoline HCCI-SI mode, as described in Chapter 2) and easier to execute since dual-fuel percentages can be controlled more
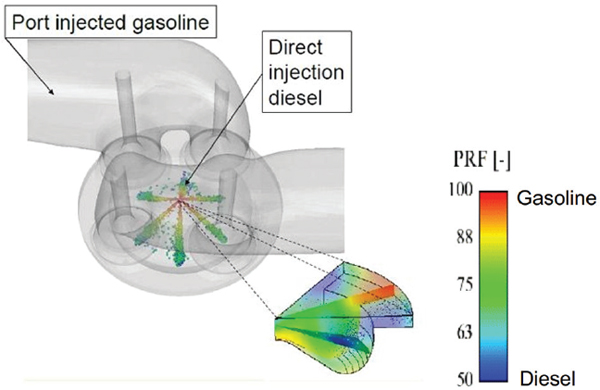
SOURCE: Ra and Reitz (2011). Figure courtesy of Prof. R.D. Reitz, Engine Research Center, University of Wisconsin-Madison.
accurately and faster than the air path. Nevertheless, with mode switching, the full conventional diesel aftertreatment system and associated cost and complexity will be necessary.
Various alternative fuels such as a gasoline blend of up to 30% ethanol (E30) and a diesel blend of up to 20% biodiesel (B20) are being explored for extending RCCI to higher loads. However, a more important consideration is the inability to extend RCCI to low loads. Researchers at ORNL have found that the conventional diesel mode at idle provides similar efficiencies and NOx levels, but significantly lower HC and CO emissions than RCCI (Curran 2014). Exhaust temperatures below 200°C with high HC and CO emissions present challenges for the application of RCCI with current oxidation catalysts.
The status of RCCI was reported at the 2014 DOE Annual Merit Review. A light duty diesel with RCCI was projected to have up to 30 percent improvement in fuel economy, or 23 percent reduction in fuel consumption, compared to a PFI naturally aspirated gasoline engine. However, this improvement is significantly less that the 29.0 to 30.5 percent estimated by NHTSA for a conventional advanced diesel engine in a light-duty vehicle. RCCI was shown to have 52 percent coverage of the non-idling portion of the Federal Test Procedure (FTP) cycle and 74 percent coverage of the highway fuel economy test (HWFET) cycle (Curran 2014). In summary, alternative combustion systems are still in the research phase, and although progress is being reported, significant utilization of HCCI or derivative concepts is unlikely until after 2025.
Summary of New and Emerging Technologies
New and emerging technologies have the potential to provide additional reductions in fuel consumption of diesel engines. Both short-term technologies, which are already appearing in production vehicles, and longer term technologies expected in the future are discussed in this section. The committee’s estimates of fuel consumption reduction effectiveness and costs for the technologies likely to be applied in the future are shown in Tables 3A.1 and 3A.2 in the annex (at the end of the chapter). The committee recommends that EPA and NHTSA evaluate the benefit of these technologies applied to the latest technology diesel engines using full system simulation supported by engine mapping. Cost analyses of these technologies are also recommended.
Downsizing
The two categories of downsizing need to be distinguished. As discussed earlier in the chapter, conversion from a naturally aspirated gasoline engine to a diesel engine included approximately a 20 percent downsizing of the diesel engine combined with turbocharging. The fuel consumption reduction effectiveness of the downsizing in the conversion to diesel has already been taken into account in the diesel engine effectiveness estimates.
Further downsizing of the diesel engine can provide additional reductions in fuel consumption and is already taking place. Opel recently introduced a 1.6L diesel engine in Europe that will replace its existing 1.7L engine and lower power versions of their 2.0L engine (Green Car Congress 2013a). Downsizing a diesel engine will be less effective in reducing fuel consumption than downsizing a gasoline engine since pumping losses are already low in the diesel engine. Downsizing is considered a short-term opportunity for reducing the fuel consumption of diesel engine.
Downspeeding
Downspeeding an engine by designing it to operate in a narrower speed range is being applied as a means of reducing engine friction as well as a method of keeping the engine in the most efficient areas of the engine map while reducing transmission losses. Ricardo estimated that operation in a narrow speed range could reduce fuel consumption by 2 percent to 4 percent after optimizing combustion for the narrower speed range (Ricardo Inc. 2011). To maintain vehicle performance, increased boost pressures are required. Downspeeding requires proper selection of final drive ratio and the narrow speed range is facilitated by an increase in the number of ratios in the transmission. Downspeeding with increased boost pressure is estimated to provide 2.5 percent reduction in fuel consumption. The estimated cost of downspeeding was based on estimates for light heavy-duty diesel engines in pickup trucks developed by EPA/NHTSA (EPA/NHTSA 2011). The higher peak combustion pressure with downsizing was estimated to require $9 additional expenditure for strengthening the cylinder head, and the higher pressure boost system was estimated to require $16 more for a turbocharger with improved efficiency and $3 for an improved EGR cooler, for a cumulative direct manufacturing cost of downspeeding of $28 (2010 dollars) for the 2017 MY and $24 for the 2025 MY.
Common Rail Fuel System
The baseline fuel injection pressure for the advanced diesel is over 2,000 bar, but many companies are investigating increased pressures up to 3,000 bar, and some are already offering 2,500 bar systems. The fuel injectors are tending to evolve from solenoid-controlled to piezo-controlled and to a direct-acting-piezo ceramic actuator for opening and closing the injector needle three times faster than conventional servo-hydraulic-actuated systems (Delphi n.d.). Denso has introduced a 2,500 bar system that reduced fuel consumption by 3 percent, reduced particulate matter by 50 percent, and reduced NOx emissions by 8 percent (Denso 2013). Mazda is using piezo injectors with 12 holes to facilitate cold starting in its low compression ratio Skyactiv diesel (Coleman 2014). Injectors are available with built-in pressure sensors to measure fuel injection pressure in real time and control the fuel injection quantity and timing of each injector
(Denso 2013). Delphi announced in 2014 that its 2,700 bar F2E distributed pump common rail system is in volume production for heavy-duty vehicles (Meek et al. 2014). The committee estimated that increasing injection pressures to 2,500 to 3,000 bar will provide 2.5 percent reduction in fuel consumption with direct manufacturing cost of $26 (2010 dollars) for the 2017 MY and $22 for the 2025 MY. This estimated cost was based on estimates for light heavy-duty diesel engines in pickup trucks developed by EPA/NHTSA (2011). The increased injection pressure was estimated to require $3 additional cost for the enhanced fuel pump, $10 additional cost for the enhanced fuel rail, and $13 additional cost for the enhanced fuel injectors. This estimated cost may be revised upward as the design details and associated costs of recently introduced production systems become known.
Turbocharging
The baseline I4 advanced diesel has one variable geometry turbocharger with air-air charge cooling or air-water charge cooling, while the V6 advanced diesel in a large light truck is envisioned to have two-stage turbocharging with one variable geometry turbocharger and one fixed geometry turbocharger. The next generation technology will include broader applications of two-stage turbocharging as engines are further downsized or downspeeded. Some two-stage turbocharger systems are already in production (with or without two-stage cooling and with or without variable nozzle turbines). The next-generation Nissan Titan with a 5.0L Cummins diesel will have a two-stage turbocharger system (Tingwell 2012). Increased boost pressures are included in the committee’s estimated effectiveness and costs for the downspeeding technology discussed earlier.
Other boosting systems, including electrically assisted turbochargers, turbocharger plus supercharger, and turbochargers with electrically driven compressors, have been proposed for diesel engine applications. Another technology with potential for reducing fuel consumption is an asymmetric-twin scroll turbine housing in which cylinders supplying EGR and operating with high back pressures operate with a different scroll than the cylinders that are not supplying EGR and operating with low back pressure (Markus 2008). Turbocompounding, in which a second turbine following the turbocharger is geared to the crankshaft, is being used in heavy-duty applications. The Ricardo analysis showed that turbocompounding in which the second turbine is coupled to an electrical generator could provide 4 percent to 5 percent reduction in fuel consumption on the highway cycle. Turbocharger friction reduction may provide less than 1 percent additional reduction in fuel consumption.
Exhaust Gas Recirculation
Most current diesel applications of EGR use the high-pressure loop or the “short loop system.” These systems have fast response times but can result in EGR cooler fouling. Low-pressure EGR, or “long loop system,” has been proposed, possibly alone but more likely as a combination of high-pressure and low-pressure EGR, or “dual loop system.” Low-pressure EGR has slow response but provides clean EGR without fouling, can be cooler, and provides more stable cylinder-to-cylinder EGR distribution. A dual-loop EGR system was found in a research program to provide a 2.1 percent reduction in fuel consumption together with a 50 percent reduction in NOx and a 22 percent reduction in soot emissions (Zamboni and Capobianco 2013). Another study showed that low-pressure EGR could provide up to a 3 percent reduction in fuel consumption (Czarnowski et al. 2008). Ricardo estimated that a low-pressure EGR circuit for increased EGR flow rate in conjunction with a separate low-temperature cooling circuiting will reduce fuel consumption by 2 to 4 percent (Ricardo Inc. 2011). Dual-loop EGR has been implemented in VW’s latest 2.0L diesel engine (EA288). The committee estimated that a low-pressure EGR loop will provide 3.5 percent reduction in fuel consumption with 2025 direct manufacturing costs of $113 to $141.
Friction
Reducing engine friction is an effective path for reducing fuel consumption. The baseline advanced diesel engine defined by NHTSA, which provides 29.4 to 30.5 percent reduction in fuel consumption, as discussed previously in this chapter, already includes the friction reduction technologies that were described for the SI engine in Chapter 2. NHTSA’s decision trees illustrate that these friction reduction technologies were applicable to both the SI engine path and the advanced diesel engine path. These friction reduction technologies included low friction lubricants level-1, engine friction reduction level-1, and low friction lubricants together with engine friction reduction level-2, which, taken together, were estimated to provide 3.5 to 4.9 percent reduction in fuel consumption. As for SI engine friction reduction, which was discussed in Chapter 2, achieving these friction reductions requires attention to the details of many engine components and design details, including bearings, piston rings, two-stage oil pumps, deactivated water pumps, thermal management, dual-chamber oil pans, reduced back pressure, and lower compression ratio. The applicability of the low-friction lubricants to turbocharged, downsized SI engines presents significant technical issues and similar issues are expected with advanced diesel engines.
Since diesel engines have higher friction levels than spark-ignition engines, additional reductions in friction may be possible. The trend towards lower compression ratios may provide additional opportunities for friction reduction. Reduction of parasitic losses in driving the high pressure fuel pump may provide additional reductions in friction. The committee estimated that additional friction reductions of approximately 2.5 percent might be possible at an incremental
cost of $96 for the 2017 MY and $82 for the 2025 MY based on estimates for light heavy-duty diesel engines in pickup trucks developed by EPA/NHTSA (EPA/NHTSA 2011). The estimated cost could be significantly higher if technologies such as low-friction diamond-like coatings, two-stage oil pumps, thermal management systems involving split cooling, and dual-chamber oil pans need to be applied.
Combustion
The diesel engine combustion is largely controlled due to criteria emissions of hydrocarbons, particulate matter and oxides of nitrogen. Within these constraints, there are some opportunities for further reductions in fuel consumption. Ricardo estimated that closed loop combustion control (CLCC) using cylinder pressure sensors in glow plugs could reduce fuel consumption by less than 1 percent, while also providing compensation for changes in the fuel cetane quality, which becomes increasingly important with the increased use of biodiesel fuel. General Motors developed a V6 diesel engine in Europe that included CLCC (Green Car Congress 2007). Since CLCC also improves NOx and PM emissions, these improvements can be traded for further reductions in fuel consumption. CLCC has been implemented in VW’s latest 2.0L diesel engine (EA288). With this combination of benefits, the committee estimated that CLCC could provide up to 2.5 percent reduction in fuel consumption at a 2025 cost of $58 to $87. Research on HCCI and RCCI, discussed in the previous section, is expected to require CLCC for feedback control of combustion timing.
Aftertreatment
The typical aftertreatment system in the production of light-duty diesel vehicles currently is a combination of DOC, DPF, and SCR. An improvement in the SCR from 96 percent to 98 percent efficiency will allow the engine-out NOx to be increased and provides a corresponding improvement in fuel economy. Currently the highest SCR efficiency is 96 percent and occurs in a relatively narrow range of temperatures, as shown in Figure 3.5.
The primary proposed aftertreatment improvement is the application of the SCR catalyst on the DPF, or SCR filter (SCRF), so that NOx and PM can be controlled on one substrate. This development is expected to reduce the cost and size of the system while maintaining emission control capabilities. The enabler for the SCRF is advanced zeolite SCR technology that can withstand the active filter regenerations.
Other promising concepts have been investigated in the past. One concept is the use of solid ammonia in place of diesel exhaust fluid (DEF). Several companies have tested solid ammonia systems (amines system), but issues remain in achieving an effective and customer friendly system. Another system that received attention in the past was a NOx catalyst that generated ammonia within the catalyst that was being developed by Honda. In the two-layer structure of the catalyst, one layer adsorbed NOx from the exhaust gas. The engine air-fuel ratio was periodically set to run rich, so that the NOx in the adsorption layer would react with hydrogen obtained from the exhaust gas to produce ammonia. The adsorbent material in the upper layer temporarily adsorbed
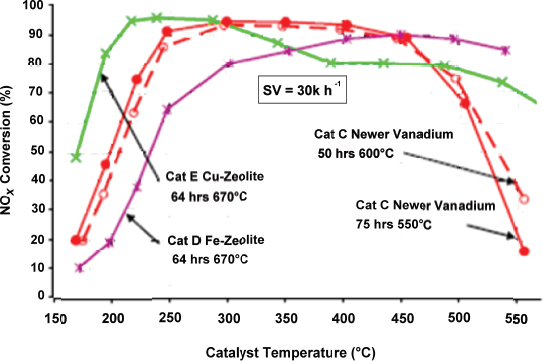
SOURCE: Girard (2009). Reprinted with permission from SAE paper 2009-01-0121 Copyright © 2009 SAE International.
the NH3. The resulting ammonia was used later in a reaction that converted the NOx in the exhaust into nitrogen. Although a promising concept for eliminating the SCR system with urea, the development of this system appears to have been terminated, possibly due to the delicate balance between the ammonia generation and use together with the fuel consumption required for the rich engine operation.
Variable Valve Actuation and Intake Port Control
Variable valve actuation includes variable valve lift (VVL), variable valve timing (VVT), and variable intake ports. The baseline-advanced diesel engine does not have any of these features, but some are in production today. Mitsubishi introduced VVT into production in 2010 on a 1.8L DOHC I4 diesel engine in Japan (BBC Top Gear 2010). It lowered the compression ratio in this engine to reduce fuel consumption and advanced the closing of the intake valve to increase the effective compression ratio for cold-starting.3 Advanced valve timing also provided for a reduced idle speed of 600 rpm. The lift of one intake valve was reduced to enhance swirl (Mitsubishi 2010). In 2013, VW introduced VVT, actuated by cam phasing, for reducing internal emissions. This system enables the engine to achieve a higher effective compression during cold-start and low NOx and particulate emissions (Green Car Congress 2013b). The VW diesel engine also has swirl control valves in the intake port. Combinations of VVT and intake port control are candidates for further analysis.
Mass Reduction
Diesel engines are heavier than gasoline engines because they are designed to withstand significantly higher peak combustion pressures than gasoline engines. In the past, diesel engines were designed with gray iron cylinder heads and cylinder block (crankcase). However, many modern light-duty diesel engines are now being designed for reduced mass with aluminum cylinder heads and either aluminum or compacted graphite iron (CGI) cylinder blocks. Other features that are providing mass reductions include integration of the charge air cooler into the intake manifold and exhaust aftertreatment close to the engine (Schmidt 2012).
Waste Heat Recovery
Nearly two-thirds of the input energy to the diesel engine is lost as exhaust enthalpy or heat rejected to coolant. Although this is low-quality heat (since the temperature difference relative to ambient is small compared to, for example, exhaust gas entering the turbocharger), recovering a portion of this energy could provide reductions in fuel consumption. Several approaches have been considered, including thermoelectric generators (TEGs) and an organic Rankine cycle system (Briggs 2010). Additionally, turbocompounding could also be considered, as previously discussed in this chapter. The committee estimated that waste heat recovery might provide up to 2.5 percent reduction in fuel consumption, with a 2025 cost of $700 for midsized cars, $805 for large cars, and $1,050 for large light trucks. The effectiveness of waste heat recovery for a diesel may be less than for a gasoline engine due to the lower exhaust temperatures of the diesel. As discussed in Chapter 2, an approach using TEGs could incur costs of approximately $700.
Other Technologies
In addition to the foregoing technologies, many of which are already being incorporated in production engines, other technologies are being developed to further reduce fuel consumption of diesel engines. These technologies are discussed in this section.
Higher Expansion Ratios
Variable intake valve timing has already been introduced for controlling the effective compression ratio. Similarly, variable exhaust valve timing may be applied to provide higher expansion ratios, particularly for the lighter load conditions of the dominant CAFE test cycles.
Exhaust Manifold Integrated in the Cylinder Head
Integrated exhaust manifolds in cylinder heads have been introduced in gasoline engines and are now being considered for diesel engines. The shortened path to the turbocharger in a diesel engine can provide reduced heat loss for faster warmup of the aftertreatment system and provide more energy to the turbocharger for faster transient response times and increased boost pressures. In addition, the integration of the exhaust manifold and cylinder head can reduce weight and cost (D’Ambrosio et al. 2013).
Exhaust Manifold with Air Gap Insulation
Internal heat transfer in an exhaust manifold is the dominant mode of heat loss in an exhaust manifold in the first 30 seconds of operation on the FTP test cycle. Air gap insulation in the exhaust manifold will reduce heat loss from the
_____________
3 Part load brake thermal efficiency reaches a broad maximum value around a compression ratio of 16:1, as shown in Figure 2.13. As compression ratio is increased above 16:1, mechanical efficiency decreases faster (due to higher engine friction) than the increase in indicated thermal efficiency, so that brake thermal efficiency begins to decrease. In contrast to diesel engines, which may benefit from reducing compression ratio to approach 16:1, gasoline engines, with compression ratios in the range of 9:1 to 10:1 can benefit from increasing compression ratio if adequate knock-resistant fuel is available, although the rate of increase of indicated thermal efficiency diminishes at higher compression ratios.
exhaust gas to provide faster warm-up of the aftertreatment system.
Improved EGR Coolers
Additional reductions in NOx emissions and improved performance can be realized with lower EGR temperatures achieved through more effective EGR coolers. BorgWarner has developed a cooler design that combines the best attributes of plate-and-shell coolers with plate-and-insert heat exchangers. These EGR coolers are claimed to provide improved heat rejection from the EGR with less soot and hydrocarbon buildup (BorgWarner 2014).
Reduced Piston Cooling
Modifications to the piston design and to the combustion process have the potential to reduce the piston temperature so that less oil will be needed to cool the pistons and a smaller oil pump can be used, thereby reducing engine friction. Alternatively, higher-temperature piston materials can also reduce the amount of oil needed to cool the pistons. In 2015, Toyota introduced a 2.8L diesel engine with a maximum brake thermal efficiency of 44 percent that was achieved by using a thermal barrier coating to reduce heat loss during combustion together with numerous other design features (Mihalascu 2015). The thermal insulation consisted of Thermo Swing Wall Insulation Technology and silica-reinforced porous anodized aluminum on the pistons.
Advanced Actuators (EGR, Wastegates, Exhaust Throttles)
Electric actuators as replacements for pneumatic actuators can provide faster transient response for reduced emissions and improved performance.
Low-Temperature Combustion
Research in low temperature combustion is continuing. The pursuit of HCCI in its purest form can be achieved only in a narrow operating range and will require mode switching to conventional diesel combustion, together with complete conventional diesel aftertreatment systems. PCCI, which uses multiple injections, may extend the operating range but with higher emissions. With these limitations, research is focusing on the dual-fuel RCCI process using port fuel injection of gasoline and direct injection of diesel fuel. Mode switches between RCCI and conventional diesel combustion may still be needed so that the complete conventional diesel aftertreatment system would be required. Since HCCI for diesel engines is still in the research phase, it should be considered a technology that may be applied after 2025.
Gasoline Direct Injection Compression Ignition
This combustion system is discussed in Chapter 2 since it uses only gasoline fuel. However, the combustion system is also being investigated in diesel engines as a means to achieve lower fuel consumption with lower emissions.
Opposed Piston Engine
Achates Power, Inc. has been investigating a two-stroke opposed piston diesel engine as an alternative to the conventional four-stroke diesel engine. In a recent publication, Achates reported on its study, which showed that an opposed piston diesel engine could provide over 30 percent improvement in fuel economy when compared to an equivalent four-stroke diesel engine in a light-duty full-size 5,500 lb pickup truck application (Redon et al. 2014).
Alternative Fuels for Reduced Carbon Dioxide
The Department of Energy is working on further increasing the availability of advanced biofuels. Today, virtually all the renewable diesel fuel being produced in the United States is biodiesel, although next-generation renewable diesel fuels are quickly being developed. Today, most diesel engines can run on high-quality blends of biodiesel with few modifications. Next-generation, drop-in renewable diesel fuels are expected to provide further benefits. Some other alternative fuels, including those with higher cetane number, such as dimethyl ether and Fisher-Tropsch fuels, and fuels with lower cetane values, such as natural gas, may require modifications to adapt to these fuels, particularly in the areas of the fuel injection system and the addition of closed-loop combustion control system (Diesel Technology Forum 2014).
Improved Accessories
The improved accessories at level-1 and level-2 discussed in Chapter 2 and 6 will equally benefit diesel engine vehicles. Included in these improved accessories are an electric water pump, electric cooling fan, and high-efficiency alternator.
Transmissions
The increase in the number of ratios and the reduction in parasitic losses in future transmissions are expected to provide similar benefits to those described in Chapter 5 for the SI engine.
Finding 3.1 The committee estimated that the fuel consumption reduction effectiveness of an advanced diesel as defined by NHTSA and meeting Tier 3 emission standards ranges from 29.0 to 30.5 percent relative to a baseline natu-
rally aspirated gasoline engine, which agrees with NHTSA’s estimates. The advance diesel engine includes a 1,800 bar common rail fuel injection system, variable geometry turbocharger, high-pressure cooled EGR, and low-friction lubricants and engine friction reductions defined by NHTSA. The incremental direct manufacturing cost for advanced diesel engines is estimated to be 31 to 47 percent higher than NHTSA’s estimates when all of the costs associated with a diesel engine, emission control system, and vehicle integration are included. However, these costs are not based on teardown cost studies.
Recommendation 3.1 EPA and NHTSA should expand their full system simulations supported by mapping the latest diesel engines that incorporates as many of the latest technologies as possible, as discussed in this chapter. EPA and NHTSA should conduct a teardown cost study of a modern diesel engine with the latest technologies to provide an up-to-date estimate of diesel engine costs. The teardown study should evaluate all costs, including vehicle integration, which includes the cooling system, torsional vibration damper, electrical systems, including starter motors, batteries and alternator, noise, vibration, and harshness (NVH) control technologies, and vehicle costs resulting from the increased weight of the diesel engine. The study should include an analysis of the increased residual value of a diesel-powered vehicle.
Finding 3.2 The EPA certification fuel economy (uncorrected CAFE) data for comparable current vehicles with gasoline and diesel engines showed that diesel engines provided an average of 20 percent reduction in fuel consumption, which is lower than the committee’s estimate of 29.0 to 30.5 percent. Several factors may be responsible for this lower average result. First, many of the 2014 MY diesel vehicles had not fully implemented all of the features discussed in this chapter for the advanced diesel engine. Second, there may be inconsistencies in features between the diesel and baseline gasoline vehicles being compared that were not identified in the EPA database. Third, there may be a difference in the maturity of the diesel and gasoline engines that are compared.
Finding 3.3 Diesel fuel has a higher energy content per gallon than gasoline, but it also has a higher carbon density, which causes approximately 15 percent more carbon dioxide to be emitted per gallon (often referred to as the “carbon penalty”). Therefore, a manufacturer that invests in diesel technology and that can meet the CAFE standards will have greater difficulty meeting the GHG standards than if the manufacturer had invested in gasoline engine technologies. The “carbon penalty” is one reason manufacturers might not choose to invest heavily in diesel engine technologies as a way to comply with the CAFE and GHG standards for MYs 2017-2025.
Finding 3.4 In the current market, vehicles with diesel engine are priced an average of more than $4,000 more than comparably equipped gasoline vehicles. Moreover, based on the committee’s estimated direct manufacturing costs, these prices may be lower than the total cost of the diesel engine to the manufacturer when all overhead costs are included. However, a recent study found that the total cost of ownership considering depreciation, fuel, repairs, fees, taxes, insurance, and maintenance was lower for light-duty vehicles with diesel engines compared to those with gasoline engines.
Finding 3.5 The most significant short-term opportunity for further reduction in fuel consumption beyond the level of the advanced diesel engine is through downsizing and downspeeding with a narrow operating speed range. To maintain vehicle performance, increased boost pressures are required. Downspeeding is accomplished with proper selection of final drive ratio, and the narrow speed range can be accomplished with an increase in the number of ratios in the transmission.
Finding 3.6 Although diesel engines provide significant reductions in fuel consumption, additional improvements will be possible in the long-term by the application of new technologies. Some of the new technologies that are expected to be implemented in the next ten years are closed-loop combustion control and fuel quality sensing using fuel injectors or glow plugs with built-in pressure sensors; fuel injection systems capable of 2,500-3,000 bar injection pressures; improved aftertreatment systems such as SCR catalyst applied to the DPF; low- and high-pressure exhaust gas recirculation (EGR); friction reduction; and waste heat recovery.
Finding 3.7 Homogeneous charge compression ignition (HCCI) can only be achieved in a narrow operating range and will require mode switching to conventional diesel combustion together with complete conventional diesel aftertreatment systems. With these limitations, research is focusing on the dual-fuel reaction-controlled compression ignition (RCCI) process. Mode switches between RCCI and conventional diesel combustion may still be needed. A light-duty diesel with RCCI was projected to have up to 23 percent reduction in fuel consumption, compared to a port fuel injection (PFI) naturally aspirated gasoline engine. However, this improvement is significantly less that the 29.0 to 30.5 percent estimated by NHTSA for a conventional advanced diesel engine. RCCI was shown to have 52 percent coverage of the nonidling portion of the Federal Test Procedure (FTP) cycle and 74 percent coverage of the Highway Fuel Economy Test (HWFET) cycle. Alternative combustion strategies are still in the research phase, and, although progress is being reported, significant utilization of HCCI or derivative concepts is unlikely until after 2025.
Finding 3.8 EPA and NHTSA developed a possible cost-effective compliance path in the final 2017-2025 CAFE rule, which showed zero percent penetration of diesel engines in 2025, although they recognized that each manufacturer would determine its own compliance path. This prognosis for low diesel engine market penetration comes even as European and Asian vehicle manufacturers announce new diesel engine introductions. The committee found that most manufacturers and suppliers did not agree with a near-zero penetration for diesel engines, even though some manufacturers do not have any diesel-powered vehicles in their product plans for the United States. However, the diesel’s 2025 MY direct manufacturing cost effectiveness is approximately $100 per percent fuel consumption reduction, which significantly exceeds the cost effectiveness of approximately $50 per percent fuel consumption reduction for a sparkignition engine having nearly comparable fuel consumption reduction when all of NHTSA’s defined technologies are applied.
BBC Top Gear. 2010. Mitsubishi ASX. http://www.topgear.com/uk/mitsubishi/asx/road-test/1.8-did-driven.
Belzowski, B., and P. Green. 2013. Total Cost of Ownership: A Gas Versus Diesel Comparison. University of Michigan Transportation Research Institute, March.
BorgWarner. 2014. Passenger Vehicle EGR Coolers. http://www.borgwarner.com/en/Emissions/products/Pages/PC-EGR-Coolers.aspx. Accessed December 6, 2014.
Briggs, T.E., K.D. Edwards, S.J. Curran, E.J. Nafziger, and R.M. Wagner. 2010. Performance of an Organic Rankine Cycle Waste Heat Recovery System for Light Duty Diesel Engines. U.S. Department of Energy DEER Conference. Detroit, Michigan, September.
California Energy Commission. 2007. “Full Fuel Cycle Assessment Well to Tank Energy Inputs, Emissions, and Water Impacts,” February. http://www.energy.ca.gov/2007publications/CEC-600-2007-002/CEC-600-2007-002-D.PDF.
CARB (California Air Resources Board). 2014. Home page. http://www.arb.ca.gov/homepage.htm.
Cobb, J. 2014. Dashboard, June 24. http://www.hybridcars.com/june-2014-dashboard/.
Cobb, J. 2015. December 2014 Dashboard. Hybridcars.com, January 6. http://www.hybridcars.com/december-2014-dashboard/.
Coleman, D. 2014. What’s all this Skyactiv anyway. Mazda. Accessed December 5, 2014. http://www.cargroup.org/assets/speakers/presentations/36/coleman_dave.pdf.
Curran, S., A. Dempsey, Z. Gao, V. Prikhodko, J. Parks, D. Smith. and R. Wagner. 2014. High Efficiency Clean Combustion in Multi-Cylinder Light-Duty Engines. 2014 DOE Hydrogen Program and Vehicle Technologies Annual Merit Review ACE016, May 14. http://energy.gov/sites/prod/files/2014/07/f17/ace016_curran_2014_o.pdf.
Curran, S., R. Hanson, R. Wagner, and R. Reitz. 2013. Efficiency and Emissions Mapping of RCCI in a Light-Duty Diesel Engine. SAE Technical Paper 2013-01-0289. doi:10.4271/2013-01-0289.
Curran, S., Z. Gao, J. Szybist, and R. Wagner. 2014. Fuel Effects on RCCI Combustion: Performance and Drive Cycle Considerations. 2014 CRC Workshop on Advanced Fuels and Engine Efficiency, February.
Czarnowski, R., V. Joergl, O. Weber, J. Shutty, and P. Keller. 2008. Can Future Emissions Limits be Met with a Hybrid EGR System Alone? U.S. Department of Energy DEER Conference. Detroit, Michigan, August.
D’Ambrosio, S., A. Ferrari, E. Spessa, L. Magro, and A. Vassallo. 2013. Impact on performance, emissions and thermal behavior of a new integrated exhaust manifold cylinder head Euro 6 diesel engine. SAE Int. J. Engines 6(3):1814-1833. doi:10.4271/2013-24-0128.
Daw, S., Z. Gao, V. Prikhodko, S. Curran, and R. Wagner. 2013. Modeling Emissions Controls for RCCI Engines. Engine Research Center Symposium, Madison, Wisconsin, June 5.
Dec, J.E. 2009. Advanced compression-ignition engines—Understanding the in-cylinder processes. Proceedings of the Combustion Institute 32(2): 2727–2742. doi:10.1016/j.proi.2008.08.008.
Delphi. n.d. Delphi Direct Acting Light Duty Diesel Common Rail System. https://delphi.com/shared/pdf/ppd/pwrtrn/direct-acting-light-duty-diesel-crs.pdf. Accessed December 5, 2014.
DENSO. 2013. DENSO Develops a New Diesel Common Rail System with the World’s Highest Injection Pressure. June 26. http://www.globaldenso.com/en/newsreleases/130626-01.html.
DieselNet. 2014. ECOpoint Inc. www.dieselnet.com.
Diesel Technology Forum. n.d. An Alternative Fuel Option. http://www.dieselforum.org/energy-and-environment/an-alternative-fuel-option. Accessed December 6, 2014.
DOE (U.S. Department of Energy). 2014. Download Fuel Economy Data. Office of Energy Efficiency and Renewable Energy. www.fueleconomy.gov/feg/download.shtml.
DOE VTO (U.S. Department of Energy, Vehicle Technologies Office). 2014. Annual Merit Review and Peer Evaluation Meeting, Washington, D.C., June 16-20. http://www4.eere.energy.gov/vehiclesandfuels/resources/merit-review/search.
EIA (U.S. Energy Information Administration). 2015. Prices. Short-Term Energy Outlook, March 10. http://www.eia.gov/forecasts/steo/report/prices.cfm.
EPA (Environmental Protection Agency). 2014a. Control of Air Pollution from Motor Vehicles: Tier 3 Motor Vehicle Emission and Fuel Standards; Final Rule. Federal Register 79(81).
EPA. 2014b. Light-Duty Automotive Technology, Carbon Dioxide Emissions, and Fuel Economy Trends: 1975 through 2014. EPA-420-S-14-001.
EPA/NHTSA (National Highway Traffic Safety Administration). 2010. Joint Technical Support Document, Final Rulemaking to Establish Light-Duty Vehicle Greenhouse Gas Emission Standards and Corporate Average Fuel Economy Standards. EPA-420-R-10-901.
EPA/NHTSA. 2011. Final Rulemaking to Establish Greenhouse Gas Emissions Standards and Fuel Efficiency Standards for Medium- and Heavy-Duty Engines and Vehicles Regulatory Impact Analysis. EPA-420-R-11-901, April.
EPA/NHTSA. 2012a. 2017 and Later Model Year Light-Duty Vehicle Greenhouse Gas Emissions and Corporate Average Fuel Economy Standards. EPA 40 CFR 85, 86, 600; NHTSA 49 CFR 523, 531, 533, 536, 537.
EPA/NHTSA. 2012b. Joint Technical Support Document, Final Rulemaking 2017-2025 Light-Duty Greenhouse Gas Emission Standards and Corporate Average Fuel Economy Standards. EPA-420-R-12-901.
EPA/Ricardo Inc. 2008. A Study of Potential Effectiveness of Carbon Dioxide Reducing Vehicle Technologies. Prepared for EPA by Ricardo, Inc. EPA420-R-08-004a, June.
Freitag, A. 2013. Robert Bosch LLC, Presentation to the National Research Council Committee on Assessment of Technologies for Improving Fuel Economy of Light-Duty Vehicles, Phase 2, Washington D.C., June 13.
Girard, J., C. Montreuil, J. Kim, G. Cavataio, and C. Lambert, Technical advantages of vanadium SCR systems for diesel NOx control in emerging markets, SAE Int. J. Fuels Lubr. 1(1):488-494, 2009, doi:10.4271/2008-01-1029.
Green Car Congress. 2007. GM Introduces New V-6 Clean Diesel: Diesel will Debut in Cadillac CTS in 2009 in Europe. Green Car Congress, March 6.
Green Car Congress. 2013a. Opel introducing new 1.6L diesel engine family; fuel consumption reduced by up to 10%, Euro 6 compliant, Green Car Congress, January 6.
Green Car Congress. 2013b. New diesel Volkswagen Golf GTD heading for the US; first driving impressions. Green Car Congress, July 16.
Hanson, R., S. Kokjohn, D. Splitter, and R. Reitz. 2010. An experimental investigation of fuel reactivity controlled PCCI combustion in a heavy-duty engine. SAE Int. J. Engines 3 (1):700-716. doi:10.4271/2010-01-0864.
Herold, R., M. Wahl, G. Regner, J. Lemke, and D. Foster. 2011. Thermodynamic Benefits of Opposed-Piston Two-Stroke Engine. SAE Technical Paper 2011-01-2216.
Honda. 2006. Honda Develops Next-Generation Clean Diesel Engine Capable of Meeting Stringent Tier II Bin 5 Emissions Requirements in the U.S. Honda Worldwide, September 25. http://world.honda.com/news/2006/c060925DieselEngine/.
Hussain, J., K. Palaniradja, N. Alagumurthi, and R. Manimaran. 2012. Effect of exhaust gas recirculation (EGR) on performance and emission characteristics of a three cylinder direct injection compression ignition engine. Alexandria Engineering Journal 51(4): 241-247.
Johannessen, T. 2012. 3rd Generations SCR System Using Solid Ammonia Storage and Direct Gas Dosing—Expanding the SCR Window for RDE (Real Driving Emissions). U.S. Department of Energy DEER Conference. Dearborn, Michigan, October 17.
Johansen, K., H. Bentzer, A. Kustov, K. Larsen, T.V.W. Janssens, and R. Barfod. 2014. Integration of Vanadium and Zeolite Type SCR Functionality into DPF in Exhaust Aftertreatment Systems—Advantages and Challenges. SAE Technical Paper 2014-01-1523. doi:10.4271/2014-01-1523.
Johnson, S. 2014. Diesel Efficiency and Associated Fuel Effects. CRC Workshop, February 25.
Kanda, T., T. Hakozaki, J. Uchimoto, N. Hatano, H. Kitayama and H. Sono. 2006. PCCI Operation with Fuel Injection Timing Set Close to TDC. SAE Technical Paper 2006-01-0920. doi 10.4271/2006-01-0920.
Kokjohn, S., R. Hanson, D. Splitter, and R. Reitz. 2009. Experiments and modeling of dual-fuel HCCI and PCCI combustion using in-cylinder fuel blending. SAE Int. J. Engines 2(2):24-39. doi 10.4271/2009-01-2647.
Majewski, W.A. 2011. Solid reductant storage for SCR systems. DieselNet Technology Guide. https://www.dieselnet.com/tech/cat_scr_solid.php.
Meek, G., R. Williams, D. Thornton, P. Knapp, and S. Cosser. 2014. F2E—Ultra High Pressure Distributed Pump Common Rail System. SAE Technical Paper 2014-01-1440. doi 10.4271/2014-01-1440.
Michelin, J., F. Guilbaud, A. Guil, I. Newbigging, E. Jean, M. Reichert, M. Balenovic, and Z. Shaikh. 2014. Advanced Compact SCR Mixer: BlueBox. SAE Technical Paper 2014-01-1531. doi 10.4271/2014-01-1531.
Mihalascu, D. 2015. Toyota Details Its New GD Family of Turbo Diesels. Carscoops.com, June 21. http://www.carscoops.com/2015/06/toyota-details-its-new-gd-family-of.html.
Mitsubishi. 2010. Clean Diesel Engine. http://www.mitsubishi-motors.com/en/spirit/technology/library/diesel.html.
Müller, M., T. Streule, S. Sumser, G. Hertweck, A. Nolte, and W. Schmid. 2008. The Asymmetric Twin Scroll Turbine for Exhaust Gas Turbo-chargers. ASME Paper No. GT2008-50614.
Nat G. Dual Fuel, Bi-Fuel, Dedicated? CNG Solutions. http://www.nat-g.com/why-cng/bi-fuel-dual-fuel-dedicated/. Accessed December 7, 2014.
NHTSA (National Highway Traffic Safety Administration). 2012. Final Regulatory Impact Analysis: Corporate Average Fuel Economy for MY2017-MY2025 Passenger Cars and Light Trucks. Office of Regulatory Analysis and Evaluation, National Center for Statistics and Analysis.
NRC (National Research Council). 2011. Assessment of Fuel Economy Technologies for Light-Duty Vehicles. Washington, D.C.: The National Academies Press.
Ott, T., C. Onder, and L. Guzzella. 2013. Hybrid-electric vehicle with natural gas-diesel engine. Energies 6(7): 3571-3592. doi 10.3390/en6073571.
Prikhodko, V., S. Curran, J. Parks, and R. Wagner. 2013. Effectiveness of diesel oxidation catalyst in reducing HC and CO emissions from reactivity controlled compression ignition. SAE Int. J. Fuels Lubr. 6(2):329-335. doi 10.4271/2013-01-0515.
Ra, Y., and R.D. Reitz. 2011. A combustion model for IC engine combustion simulations with multi-component fuels. Combustion and Flame 158:69-90.
Redon, F., C. Kalebjian, J. Kessler, N. Rakovec, et al. 2014a. Meeting Stringent 2025 Emissions and Fuel Efficiency Regulations with an Opposed-Piston, Light-Duty Diesel Engine. SAE Technical Paper 2014-01-1187. doi 10.4271/2014-01-1187.
Redon, F., J. Koszewnik, G. Regner, C. Kalebjian, J. Kessler, N. Rakovec, and J. Headley. 2014b. Meeting Stringent 2025 Emissions and Fuel Efficiency Regulations with an Opposed-Piston, Light-Duty Diesel Engine. SAE 2014 High Efficiency IC Engine Symposium.
Reese, R. 2012. A MultiAir/MultiFuel Approach to Enhancing Engine System Efficiency. DOE Vehicle Technologies Program Annual Merit Review ACE062.
Reitz, R.D. 2010. High Efficiency Fuel Reactivity Controlled Compression Ignition (RCCI) Combustion. U.S. Department of Energy DEER Conference. Detroit, Michigan, September 28.
Ricardo Inc. 2011. Computer Simulation of LDV Technologies for GHG Emission Reduction in the 2020-2025 Timeframe. EPA-420-R-11-020, December.
Sanchez, F.P., A. Bandivadekar, and J. German. 2012. Estimated Cost of Emission Reduction Technologies for Light-Duty Vehicles. ICCT (International Council on Clean Transportation). http://www.theicct.org/sites/default/files/publications/ICCT_LDVcostsreport_2012.pdf.
Schmidt, O. 2012. Volkswagen Group Powertrain and Fuel Strategy. http://www.cargroup.org/assets/speakers/presentations/40/schmidt_oliver.pdf.
Shuldiner, H. 2013. U.S. Light-Vehicle Diesel Offerings to Double This Year, Bosch Exec Says. WardsAuto, January 31. http://wardsauto.com/suppliers/us-light-vehicle-diesel-offerings-double-year-bosch-exec-says.
Simescu, S., S.B. Fiveland, and L.G. Dodge. 2003. An Experimental Investigation of PCCI-DI Combustion and Emissions in a Heavy-Duty Diesel Engine. SAE Technical Paper 2003-01-0345. doi 10.4271/2003-01-0345.
Song-Charng, K., A. Patel, and R. Reitz. 2004. Development and Application of Detailed Chemistry Based CFD Models for Diesel PCCI Engine Simulations. In Proc. of SAE Conference 2004-30-0030.
Tingwell, E. 2012. Next-Gen Nissan Titan Destined for Detroit, we detail its clever engine. Car and Driver, October 28.
Wang, D.Y., S. Yao, D. Cabush, and D. Racine. 2007. Ammonia Sensor for SCR NOx Reduction. Delphi. U.S. Department of Energy DEER Conference. Dearborn, Michigan, October 16-19.
Woodyard, C. 2013. Ram brings diesel power back to light-duty pickups. USA Today, September 24. http://www.usatoday.com/story/money/cars/2013/09/21/ram-diesel/2844813/.
Zamboni, G., and M. Capobianco. 2013. Influence of high and low pressure EGR and VGT control on in-cylinder pressure diagrams and rate of heat release in an automotive turbocharged diesel engine. Applied Thermal Engineering 51(1-2):586-596.
| Midsize Car I4 DOHC | Large Car V6 DOHC | Large Light Truck V8 OHV | |||||||||||||||||
| Diesel Engine Technologies | Abbreviation | Most Likely | Most Likely | Most Likely | Relative To | ||||||||||||||
| NHTSA Technologies | |||||||||||||||||||
| Advanced Diesel | ADSL | 29.4 | 30.5 | 29.0 | Baseline | ||||||||||||||
| Other Technologies | |||||||||||||||||||
| Low Pressure EGR | LPEGR | 3.5 | 3.5 | 3.5 | ADSL | ||||||||||||||
| Closed Loop Combustion Control | CLCC | 2.5 | 2.5 | 2.5 | ADSL | ||||||||||||||
| Injection Pressures Increased to 2,500 to 3,000 bar | INJ | 2.5 | 2.5 | 2.5 | ADSL | ||||||||||||||
| Downspeeding with Increased Boost Pressure | DS | 2.5 | 2.5 | 2.5 | ADSL | ||||||||||||||
| Friction Reduction | FR | 2.5 | 2.5 | 2.5 | ADSL | ||||||||||||||
| Waste Heat Recovery | WHR | 2.5 | 2.5 | 2.5 | ADSL | ||||||||||||||
| Midsize Car I4 DOHC | Large Car V6 DOHC | Large Light Truck V8 OHV | |||||||||||||||||
| Diesel Engine Technologies | Abbreviation | Most Likely | Most Likely | Most Likely | Relative To | ||||||||||||||
| NHTSA Technologies | |||||||||||||||||||
| Advanced Diesel | ADSL | 3,023 | 3,565 | 3,795 | Baseline | ||||||||||||||
| Other Technologies | |||||||||||||||||||
| Low Pressure EGR | LPEGR | 133 | 166 | 166 | ADSL | ||||||||||||||
| Closed Loop Combustion Control | CLCC | 68 | 102 | 102 | ADSL | ||||||||||||||
| Injection Pressures Increased to 2,500 to 3,000 bar | INJ | 24 | 26 | 26 | ADSL | ||||||||||||||
| Downspeeding with Increased Boost Pressure | DS | 28 | 28 | 28 | ADSL | ||||||||||||||
| Friction Reduction | FR | 64 | 96 | 96 | ADSL | ||||||||||||||
| Waste Heat Recovery | WHR | N/A | N/A | N/A | |||||||||||||||
| Midsize Car I4 DOHC | Large Car V6 DOHC | Large Light Truck V8 OHV | |||||||||||||||||
| Diesel Engine Technologies | Abbreviation | Most Likely | Most Likely | Most Likely | Relative To | ||||||||||||||
| NHTSA Technologies | |||||||||||||||||||
| Advanced Diesel | ADSL | 2,845 | 3,356 | 3,571 | Baseline | ||||||||||||||
| Other Technologies | |||||||||||||||||||
| Low Pressure EGR | LPEGR | 125 | 157 | 157 | ADSL | ||||||||||||||
| Closed Loop Combustion Control | CLCC | 64 | 96 | 96 | ADSL | ||||||||||||||
| Injection Pressures Increased to 2,500 to 3,000 bar | INJ | 23 | 25 | 25 | ADSL | ||||||||||||||
| Downspeeding with Increased Boost Pressure | DS | 26 | 26 | 26 | ADSL | ||||||||||||||
| Friction Reduction | FR | 60 | 91 | 91 | ADSL | ||||||||||||||
| Waste Heat Recovery | WHR | N/A | N/A | N/A | |||||||||||||||
| Midsize Car I4 DOHC | Large Car V6 DOHC | Large Light Truck V8 OHV | |||||||||||||||||
| Diesel Engine Technologies | Abbreviation | Most Likely | Most Likely | Most Likely | Relative To | ||||||||||||||
| NHTSA Technologies | |||||||||||||||||||
| Advanced Diesel | ADSL | 2,572 | 3,034 | 3,228 | Baseline | ||||||||||||||
| Other Technologies | |||||||||||||||||||
| Low Pressure EGR | LPEGR | 113 | 141 | 141 | ADSL | ||||||||||||||
| Closed Loop Combustion Control | CLCC | 58 | 87 | 87 | ADSL | ||||||||||||||
| Injection Pressures Increased to 2,500 to 3,000 bar | INJ | 20 | 22 | 22 | ADSL | ||||||||||||||
| Downspeeding with Increased Boost Pressure | DS | 24 | 24 | 24 | ADSL | ||||||||||||||
| Friction Reduction | FR | 54 | 82 | 82 | ADSL | ||||||||||||||
| Waste Heat Recovery | WHR | 700 | 805 | 1,050 | ADSL | ||||||||||||||
| Year | Manufacturer | Model | Engine | Tran | EPA Label MPG | CAFE MPG | |||||||||||||
| City | Hwy | Comb | %FE | %FC | City | Hwy | Com | %FE | %FC | Line | |||||||||
| 2014 | Audi | A6 | 3.0L 6 cyl gas | A | 18 | 27 | 22 | 23.1 | 38.1 | 28.1 | 415 | ||||||||
| 3.0L 6 cyl diesel | A | 24 | 28 | 29 | 32 | 24 | 30.7 | 52.5 | 37.7 | 34 | 26 | 414 | |||||||
| 2014 | Audi | A7 | 3.0L 6 cyl gas | A | 18 | 28 | 21 | 23.3 | 37.3 | 27.2 | 418 | ||||||||
| 3.0L 6 cyl diesel | A | 24 | 38 | 29 | 38 | 28 | 30.7 | 52.4 | 37.7 | 39 | 28 | 417 | |||||||
| 2014 | Audi | A8L | 3.0L 6 cyl gas | A | 18 | 28 | 21 | 22.3 | 37.3 | 27.2 | 613 | ||||||||
| 3.0L 6 cyl diesel | A | 24 | 36 | 28 | 33 | 25 | 29.9 | 51.4 | 36.9 | 36 | 26 | 612 | |||||||
| 2014 | Audi | Q5 | 3.0L 6 cyl gas | A | 18 | 26 | 21 | 22.8 | 35.5 | 27.2 | 943 | ||||||||
| 3.0L 6 cyl diesel | A | 24 | 31 | 27 | 29 | 22 | 29.2 | 43.5 | 34.3 | 26 | 21 | 944 | |||||||
| 2014 | Audi | Q7 | 3.0L 6 cyl gas | A | 16 | 22 | 18 | 19.4 | 30 | 23.1 | 1072 | ||||||||
| 3.0L 6 cyl diesel | A | 19 | 28 | 22 | 22 | 18 | 22.8 | 39.1 | 28.1 | 22 | 18 | 1071 | |||||||
| 2014 | BMW | 328i | 2.0L 4 cyl gas | A | 23 | 35 | 27 | 29.2 | 50.1 | 35.9 | 238 | ||||||||
| 328d | 2.0L 4 cyl diesel | A | 32 | 45 | 37 | 28 | 27 | 41.6 | 64.8 | 49.6 | 38 | 27 | 236 | ||||||
| 2014 | BMW | 328i xDrive | 2.0L 4 cyl gas | A | 22 | 33 | 36 | 28.4 | 46.9 | 34.5 | 240 | ||||||||
| 328d xDrive | 2.0L 4 cyl diesel | A | 31 | 43 | 35 | 36 | 26 | 40.6 | 60.9 | 47.7 | 38 | 28 | 237 | ||||||
| 2014 | BMW | 328i xD S-Wagen | 2.0L 4 cyl gas | A | 22 | 33 | 26 | 28.2 | 45.9 | 34.1 | 713 | ||||||||
| 328d xD S-Wagen | 2.0L 4 cyl diesel | A | 31 | 43 | 35 | 38 | 26 | 40.6 | 60.9 | 47.7 | 40 | 28 | 712 | ||||||
| 2014 | BMW | 535i | 3.0L 6 cyl gas | A | 20 | 30 | 24 | 25.1 | 42.6 | 30.8 | 430 | ||||||||
| 535d | 3.0L 6 cyl diesel | A | 26 | 38 | 30 | 25 | 20 | 32.3 | 54.4 | 40.3 | 31 | 24 | 428 | ||||||
| 2014 | BMW | 535i xDrive | 3.0L 6 cyl gas | A | 20 | 29 | 23 | 25 | 40.9 | 30.3 | 432 | ||||||||
| 536d xDrive | 3.0L 6 cyl diesel | A | 26 | 37 | 30 | 30 | 23 | 33.4 | 52.5 | 39.9 | 32 | 24 | 429 | ||||||
| 2014 | Chrysler Jeep | Gd. Cherokee 4x2 | 3.6L V6 gas | A | 17 | 24 | 20 | 21.8 | 34.5 | 26.1 | 1060 | ||||||||
| 3.0L V6 | A | 22 | 30 | 25 | 25 | 20 | 28 | 42.5 | 33.1 | 27 | 21 | 1059 | |||||||
| 2014 | Chrysler Jeep | Gd. Cherokee 4x4 | 3.6L V6 gas | A | 17 | 24 | 19 | 21.1 | 33.3 | 25.3 | 1102 | ||||||||
| 3.0L V6 diesel | A | 21 | 28 | 24 | 26 | 21 | 26.6 | 39.3 | 31.2 | 23 | 19 | 1101 | |||||||
| 2014 | GM Chevrolet | Cruze | 1.8L 4 cyl gas | A | 22 | 35 | 27 | 28.5 | 49.1 | 35.1 | 480 | ||||||||
| 2.0L 4 cyl diesel | A | 27 | 46 | 33 | 22 | 18 | 34.8 | 66.3 | 44.3 | 26 | 21 | 482 | |||||||
| 2014 | Mercedes | E350 | 3.5L V6 gas | A | 21 | 30 | 24 | 27.7 | 43.8 | 33 | 566 | ||||||||
| E250 | 2.1L 4 cyl diesel | A | 28 | 45 | 34 | 42 | 29 | 36.9 | 64.8 | 45.8 | 39 | 28 | 564 | ||||||
| 2014 | Mercedes | E350 4 matic | 3.5L V6 gas | A | 21 | 29 | 24 | 26 | 40.7 | 31 | 569 | ||||||||
| E250 BluTec 4 mat | 2.1L 4 cyl diesel | A | 27 | 42 | 32 | 33 | 25 | 35.6 | 59.6 | 43.5 | 40 | 29 | 565 | ||||||
| Year | Manufacturer | Model | Engine | Tran | EPA Label MPG | CAFE MPG | |||||||||||||
| City | Hwy | Comb | %FE | %FC | City | Hwy | Com | %FE | %FC | Line | |||||||||
| 2014 | Mercedes | ML350 4 matic | 3.5L V6 gas | A | 17 | 22 | 19 | 21.9 | 31.1 | 25.3 | 1126 | ||||||||
| ML350 BluTec 4ma | 3.0L V6 diesel | A | 20 | 28 | 23 | 21 | 17 | 25.2 | 38.8 | 29.9 | 18 | 15 | 1127 | ||||||
| 2014 | Mercedes | GL350 4 matic | 4.7L V8 gas | A | 14 | 19 | 16 | 17.3 | 26.2 | 20.4 | 1122 | ||||||||
| GL350 BluTec 4ma | 3.0L V6 diesel | A | 19 | 26 | 22 | 38 | 27 | 24 | 36.3 | 28.3 | 39 | 28 | 1121 | ||||||
| 2014 | Mercedes | GLK350 4 matic | 3.5L V6 gas | A | 19 | 25 | 21 | 23.3 | 34.7 | 27.3 | 1006 | ||||||||
| GLK250 BluTec 4m | 2.1L I4 diesel | A | 24 | 33 | 28 | 33 | 25 | 31.1 | 46.9 | 36.8 | 35 | 26 | 1005 | ||||||
| 2014 | Porche | Cayenne | 3.6L 6 cyl gas | A | 17 | 23 | 20 | 21.6 | 32.9 | 25.5 | 1133 | ||||||||
| Cayenne Diesel | 3.0L 6 cyl diesel | A | 20 | 29 | 23 | 15 | 13 | 24.1 | 41 | 29.6 | 16 | 14 | 1135 | ||||||
| 2014 | VW | Beetle Convertible | 2.0L 4 cyl gas | M | 23 | 31 | 26 | 27.8 | 43.9 | 33.3 | 217 | ||||||||
| 2.0L 4 cyl diesel | M | 28 | 41 | 32 | 23 | 19 | 36.1 | 58 | 43.5 | 31 | 23 | 216 | |||||||
| 2.0L 4 cyl gas | A | 23 | 29 | 25 | 28.9 | 40.8 | 33.2 | 215 | |||||||||||
| 2.0L 4 cyl diesel | A | 28 | 37 | 31 | 24 | 19 | 36.4 | 51.9 | 42.1 | 27 | 24 | 214 | |||||||
| 2014 | VW | Beetle | 2.0L 4 cyl gas | A | 24 | 30 | 26 | 29.2 | 42.3 | 33.9 | 382 | ||||||||
| 2.0L 4 cyl diesel | A | 29 | 39 | 32 | 23 | 19 | 37.3 | 58 | 43.5 | 29 | 23 | 381 | |||||||
| 2014 | VW | Beetle | 2.0L 4 cyl gas | M | 23 | 31 | 26 | 27.8 | 43.8 | 33.3 | 384 | ||||||||
| 2.0L 4 cyl diesel | M | 28 | 41 | 32 | 23 | 19 | 36.1 | 58 | 43.5 | 29 | 23 | 383 | |||||||
| 2014 | VW | Golf | 2.0L 4 cyl gas | A | 24 | 32 | 27 | 29.6 | 42.9 | 34.4 | 393 | ||||||||
| 2.0L 4 cyl diesel | A | 30 | 42 | 34 | 26 | 21 | 39.1 | 59.3 | 46.2 | 34 | 26 | 390 | |||||||
| 2.0L 4 cyl gas | M | 21 | 31 | 25 | 25.7 | 40.9 | 30.9 | 394 | |||||||||||
| 2.0L 4 cyl diesel | M | 30 | 42 | 34 | 36 | 27 | 38.7 | 59.8 | 46 | 49 | 33 | 391 | |||||||
| 2014 | VW | Jetta | 2.0L 4 cyl gas | A | 24 | 32 | 27 | 29.6 | 44.5 | 34.8 | 398 | ||||||||
| 2.0L 4 cyl diesel | A | 30 | 42 | 34 | 26 | 21 | 39.1 | 59.3 | 46.2 | 33 | 24 | 397 | |||||||
| 2.0L 4 cyl gas | M | 23 | 33 | 26 | 28.3 | 45.2 | 34 | 402 | |||||||||||
| 2.0L 4 cyl diesel | M | 30 | 42 | 34 | 31 | 24 | 38.7 | 59.8 | 46 | 35 | 26 | 401 | |||||||
| 2014 | VW | Passat | 2.5L 5 cyl gas | A | 22 | 31 | 25 | 27.1 | 40.8 | 31.9 | 607 | ||||||||
| 2.0L 4 cyl diesel | A | 30 | 40 | 34 | 36 | 27 | 37.9 | 56.8 | 44.6 | 40 | 28 | 605 | |||||||
| 1.8L 4 cyl gas | A | 24 | 34 | 28 | 30.2 | 48 | 36.2 | 603 | |||||||||||
| 2.0L 4 cyl diesel | A | 30 | 40 | 34 | 21 | 18 | 37.9 | 56.8 | 44.6 | 23 | 19 | 605 | |||||||
| 2.5L 5 cyl gas | M | 22 | 32 | 26 | 26.1 | 42.8 | 31.7 | 608 | |||||||||||
| 2.0L 4 cyl diesel | M | 31 | 43 | 35 | 35 | 26 | 38.2 | 62.3 | 46.4 | 46 | 31 | 606 | |||||||
| 1.8L 4 cyl gas | M | 24 | 35 | 28 | 30.3 | 48.2 | 36.3 | 604 | |||||||||||
| 2.0L 4 cyl diesel | M | 31 | 43 | 35 | 25 | 20 | 38.3 | 62.3 | 46.4 | 28 | 21 | 606 | |||||||
| Year | Manufacturer | Model | Engine | Tran | EPA Label MPG | CAFE MPG | |||||||||||||
| City | Hwy | Comb | %FE | %FC | City | Hwy | Com | %FE | %FC | Line | |||||||||
| 2014 | VW | Jetta Sport Wagen | 2.5L 5 cyl gas | A | 23 | 30 | 26 | 27.1 | 41.9 | 32.2 | 743 | ||||||||
| 2.0L 4 cyl diesel | A | 29 | 39 | 33 | 27 | 21 | 37.6 | 56.2 | 44.2 | 37 | 27 | 741 | |||||||
| 2.5L 5 cyl gas | M | 23 | 33 | 26 | 26.2 | 44.1 | 32.1 | 744 | |||||||||||
| 2.0L 4 cyl diesel | M | 30 | 42 | 34 | 31 | 24 | 38.7 | 59.8 | 46 | 43 | 30 | 742 | |||||||
| 2014 | VW | Touareg | 3.6L 6 cyl gas | A | 17 | 23 | 19 | 21.3 | 31.6 | 25 | 1148 | ||||||||
| 3.0L 6 cyl diesel | A | 20 | 29 | 23 | 21 | 17 | 24.1 | 41 | 29.6 | 18 | 16 | 1147 | |||||||
| Accessed January 1, 2014. From: www.fueleconomy.gov/feg/download.shtml. | |||||||||||||||||||
| . | Chrysler | RAM 1500 4x2 | 3.6L 6 cyl gas | A | 17 | 25 | 20 | 21.4 | 34.5 | 25.6 | 804* | ||||||||
| 2014 | Chrysler | RAM 1500 | 3.0L V6 diesel | A | 20 | 28 | 23 | 15 | 13 | 25.8 | 39 | 30.4 | 19 | 16 | 805* | ||||
| 2014 | Chrysler | RAM 1500 | 3.6L 6 cyl gas 3.0L V6 diesel | A | 15 | 21 | 17 | 18.1 | 28.4 | 21.6 | 832* | ||||||||
| 2014 | RAM | A | 19 | 27 | 22 | 29 | 23 | 24.5 | 37.2 | 30 | 39 | 28 | 833* | ||||||
| 1500 | |||||||||||||||||||
| 4X4 | |||||||||||||||||||
Revised March 23, 2014, * accessed March 23, 2014 at www.fueleconomy.gov/feg/download.shtml.
Summary of Martec Study Methodology
Conducted in 2007 and 2008, the Martec Group study relied on information and meetings with vehicle manufacturers and suppliers to estimate costs of converting engines from SI to a performance-equivalent compression ignition (CI) system. The methodology is referred to as a bill of materials approach, which takes into account the engineering necessities as well as a likely marketing and sales perspective for assigning costs. Once the bill of materials was generated, Martec then sought input from vehicle manufacturers and suppliers, with the goal being to reach a consensus on the cost estimates that were developed. Assuming that a vehicle manufacturer would sell to both North American and European markets, the study estimated a high production volume of 500,000 units for all components, with the caveat that, depending on the region, some of the production volumes might not be reached before 2020.
Unlike other studies in the 2000-2008 time frame, the Martec study included an evaluation of the incremental costs increases from the aftertreatment systems. In the evaluation of aftertreatment, the costs of commodities and the regulatory standards in 2007 and 2008 were considered in combination with information from vehicle manufacturers and suppliers regarding consumer acceptance. Based on the costs and availability of the commodities at that time, Martec chose NSC aftertreatment systems for deployment on cars and an SCR-urea aftertreatment system for SUVs and trucks. The decision to use SCR-urea aftertreatment systems on the SUVs and trucks was based on the need to comply with emission compliance for ULEVII. As for the diesel particulate filters, their effectiveness with respect to given vehicle sizes and consumer acceptance of them was considered. The use of advanced cordierite was assumed for DPF systems based on its effectiveness and consumer acceptance.
The NRC Phase 1 study used many of the costs from the Martec study with some key deviations. The biggest difference between the NRC Phase 1 and Martec studies was the decision to remove cylinders when converting from an SI to a CI engine. For large cars, Martec downsized the engine from a V6 to an I4 when converting an SI engine to a performance equivalent CI engine. For trucks and SUVs, Martec downsized the number of cylinders to go from a V8 to a V6. The Phase 1 study made the decision not to remove cylinders and instead used a V6 as a baseline for trucks and SUVs. Therefore, the costs in the Phase 1 study do not include a credit for the removal of cylinders from either the large car or from SUV/truck classes of vehicles. Another difference in the cost analysis performed in the Phase 1 study and the Martec study was the decrease in the price of commodities from 2007 to 2009 (NRC 2011).
References
Martec Group. 2008. Variable Costs of Fuel Economy Technologies. Prepared for the Alliance of Automobile Manufacturers.
NRC (National Research Council). 2011. Assessment of Fuel Economy Technologies for Light-Duty Vehicles. Washington, D.C.: The National Academies Press.