
5
Spatial Dimensions of Immigrant Integration
National statistics sometimes hide or even obfuscate the nation’s spatially uneven patterns of immigrant integration from one place to another. Indeed, where immigrants live shapes the integration experience in myriad ways. Every place—state, city, suburb, neighborhood or rural area—represents a unique context of reception that affects how immigrants, refugees, and their offspring are incorporated into neighborhoods, schools, local labor markets, and, ultimately, U.S. society. What is different today from the past is that unprecedented numbers of new immigrants and the foreign-born population have diffused spatially from traditional areas of first settlement (e.g., in the Southwest or in large gateway cities) to so-called “new destinations” in the Midwest and South, to suburbs previously populated largely by native-born Americans, to small but rapidly growing metropolitan areas, and even to rural communities (Lichter, 2012; Massey, 2008; Singer, 2013).
Perhaps paradoxically, this widespread geographic diffusion of immigrants also has occurred in tandem with population concentration in specific immigrant receiving areas (e.g., inner suburban neighborhoods, new Asian ethnoburbs, and Hispanic boom towns, as well as continued settlement in established destinations) with growing racial and ethnic minority populations that may not share the same culture, language, or education with the local native-born population. New immigration has left an outsized demographic and economic imprint on many communities, including on ethnoracial diversity, the provision of public assistance, school budgets, and local politics. Processes of assimilation and incorporation occur “in place,” and these processes are expressed differently depending on the re-
ception local communities give to groups of diverse national origins; that is, whether native-born populations and state and local policies are welcoming or antagonistic to new immigrants.
In this chapter, the panel emphasizes that the national picture of social integration of America’s new immigrant groups outlined in Chapter 1 is the net result of offsetting positive and negative trajectories of immigrant integration that occur unevenly from one place to another. Scholars often focus on immigrant incorporation into U.S. society or the economic mainstream, but the experience of integration is, in reality, an inherently local one. As this chapter makes plain, the current research-based understanding of the local context of immigrant reception is regrettably incomplete and often superficial, especially for nontraditional receiving areas that are now attracting large immigrant populations of different national origins, different legal statuses (e.g., unauthorized and refugee populations), and different levels of social and political capital. The research literature nevertheless has identified some policy options—at the state and local level—that can shape immigrant trajectories of incorporation, now and into the future.
This chapter has three specific aims. First, it provides a general overview of current theory and research on spatial assimilation: the local incorporation of immigrant populations into the mainstream. The panel discusses both the canonical view, which was drawn from classical assimilation theory, and alternative (and less optimistic) views that some new immigrant groups are becoming “ghettoized” or have assimilated spatially with an urban underclass population in poor and segregated neighborhoods and communities (even rural communities).
Second, the chapter highlights recent patterns of spatial redistribution and internal migration among the immigrant and foreign-born populations. Spatial integration can be defined by the extent to which residence patterns among immigrants mirror those of the native-born population. This chapter highlights changes in patterns of population redistribution among immigrants, as well as their movement into nontraditional areas of first settlement. Spatial assimilation is now taking place at multiple but interlinked levels of geography (i.e., region, state, metropolitan, suburban, neighborhood, and rural). New immigrants have transformed the racial and ethnic composition of many cities and communities, while also providing a demographic lifeline to other slow-growing or economically declining areas, especially in rural areas.
Third, the chapter identifies how processes of social integration and assimilation are influenced by local economic and political contexts of reception. New destinations, in particular, represent natural laboratories for studying immigrant integration, ethnic conflict and majority-minority relations, and local politics and policy responses (Waters and Jiménez, 2005). In those places, where growth in the immigrant population is fast-paced and
often unexpected by the resident population, policy reactions can be swift and strong. In response to the growing presence of immigrants in these new destinations and stalled efforts in Congress at comprehensive immigration reform, some states and municipalities have enacted inclusive policies and practices (e.g., sanctuary cities, like San Francisco), while others have created policies designed to restrict how and where some immigrants can work and live (e.g., in Arizona and Hazleton, Pennsylvania). How states and local communities assist or impede the incorporation of new immigrants into the larger community is important to understanding the process of immigrant integration at the local level.
SPATIAL INTEGRATION: BACKGROUND AND THEORY
The canonical view is that the spatial “assimilation” (as it has historically been called) of immigrants and minority groups is a product of increasing cultural and economic integration. That is, residential differences between immigrants and natives are expected to decline as immigrants—over time and across generations—experience upward social and economic mobility. Spatial assimilation theory holds that immigrants typically first settle in communities with others from similar backgrounds (e.g., enclaves where cultural and institutional support is ensured) but “move up and out” over time or across generations as they learn English, acquire new job skills, and become “Americanized” (Alba and Foner, 2015; Lichter et al., 2015; Massey, 2008). In this view, social and spatial mobility presumably go hand in hand. Spatial integration therefore both reflects and reinforces socioeconomic mobility among America’s new immigrant populations, including Hispanics from Mexico and other parts of Latin America, culturally and economically diverse Asian foreign-born populations, and refugee populations from war-torn parts of sub-Saharan Africa, the Middle East, and Eastern Europe (the Balkans). That family income among immigrant populations is positively associated with neighborhood quality also gives empirical credence to this spatial assimilation model (Alba et al., 2014).
Indeed, a common inference today is that the new spatial diffusion of immigrant populations from traditional gateway states (e.g., Texas or California) and cities (e.g., El Paso, Texas, or Los Angeles, California) to new destinations reflects social and economic integration. To illustrate the point historically, Italian immigrants in New York City in the early 1900s gained an economic toehold living in the tenements in the lower East Side of Manhattan before their upwardly mobile descendants moved to better neighborhoods in New Jersey, Long Island, and elsewhere (Kasnitz et al., 2009). Today’s recent immigrant movement to new destinations—many with little recent history of immigration—may similarly signal a pathway to immigrant integration in more affluent communities (Massey, 2008;
Massey et al., 2009). The movement of immigrants, especially Hispanics and Asians, to new or nontraditional destinations without an intermediate stop in traditional gateways suggests much greater similarity today than in the past in immigrants’ residence patterns with the native population. Spatial integration implies greater access to society’s rewards, including good schools, high-paying jobs, and safe neighborhoods.
An alternative view to the canonical model, a less optimistic one, is that new immigrants are remaining highly segregated and spatially isolated from the mainstream society. Indeed, low-income immigrant and refugee populations may be living in a “parallel society,” metaphorically locked away in poor and segregated neighborhoods that are cut off from the rest of society and where opportunities to succeed are limited (Alba and Foner, 2015). The concern arising from this view is that these communities lack the most basic economic, cultural, and political ingredients needed to ensure immigrant success—for themselves and their children. Moving to new destinations is no economic panacea. Emerging empirical evidence indicates that some native whites and affluent populations are “fleeing” diversifying neighborhoods for predominantly white suburbs, gated communities in exurban developments, or returning to the city as part of the gentrification process (in Minneapolis, Washington, D.C., and elsewhere), leaving behind the poorest and most vulnerable populations to fend for themselves in economically declining communities (Crowder et al., 2011; Hall and Crowder, 2014). The fact that more immigrants are bypassing traditional gateways altogether (Lichter and Johnson, 2009, Singer et al., 2008) suggests that native-born populations and basic institutions like schools in some new destinations are being exposed, perhaps for the first time, to immigrant populations that lack basic education and English-language skills. This makes integration especially difficult and sometimes instills new anti-immigrant antipathies and discrimination that compound the problem (Massey and Sanchez, 2012). Many new destinations simply lack the institutional resources needed to effectively accommodate the needs of new arrivals. As described later in this chapter, state and local responses in the form of racial profiling, restrictive zoning, or other exclusionary policies have cropped up in communities across the United States, even as other states and localities have welcomed immigrants (Carr et al., 2012; Gelatt et al., 2015). The problem, of course, is that idiosyncratic patterns from state to state or from community to community are not easily summarized by highly aggregated national statistics on the “average” experiences of specific immigrants or immigration populations.
Finally, Alba and Foner (2015, p. 71) argue that our thinking about spatial assimilation or isolation is sometimes “turned on its head” by the idea of the immigrant enclave, where economically vulnerable immigrants find a safe haven in institutionally complete and highly functional ethnic
communities (e.g., communities often known as Chinatown, Little Italy, Koreatown, or little Havana) that provide a permanent home or a launching point for someplace better. The immigrant enclave literature is large, well established, and typically based on local case studies, which can be idiosyncratic. Sweeping generalizations are best avoided, and caution in interpretation and lessons is required. For example, the establishment and growth of immigrant enclaves is sometimes viewed as a response to discrimination and the lack of good jobs. The important point is that all traces of “parallel society” in America are not regarded as especially problematic or as a source of fear among natives or local residences. In fact, ethnic neighborhoods are often regarded as a local attraction, providing native-born Americans with opportunities to experience a different culture (i.e., the people, language, music, and food of a foreign land) without leaving the United States.
Recent immigration settlement patterns have upended conventional theories of assimilation and integration (Waters and Jiménez, 2005). “Contexts of reception” clearly matter, and they matter now in ways heretofore unimagined because of the racial and ethnic diversity of America’s new immigrant populations and the heterogeneity in the places they settle. Indeed, the context of reception operates at the national level through government immigration policy, but any positive effects trickle down unevenly across states, cities, suburbs, neighborhoods, and rural areas with widely different institutional resources and local labor market dynamics (Ellis and Almgren, 2009). Diverse economic, political, civic, and social characteristics, along with local culture, shape the experiences of immigration integration.
THE GEOGRAPHY OF IMMIGRATION
Immigration is driving rapid increases in racial and ethnic diversity across the United States. Texas joined California, the District of Columbia, Hawaii, and New Mexico between 2000 and 2010 as “majority-minority” states having more ethnoracial minorities than non-Hispanic whites (Humes et al., 2011). Of the nation’s 3,143 counties, 348 are at least half minority. Most of America’s 100 largest cities have majority-minority populations (Frey, 2015), and the numbers of diverse suburban and rural communities have also grown considerably over the past two decades (Lee et al., 2014; Lichter, 2012). Many newcomers, however, continue to concentrate or become residentially segregated in specific neighborhoods or communities across the metropolitan landscape (Iceland and Scopilliti, 2008). Immigration is thus driving two countervailing trends: new patterns of spatial dispersal are occurring at the same time that many immigrant populations are concentrating locally (Rugh and Massey, 2014; Holloway et al., 2012). Recent trends require that a thoughtful person recalibrate the
SOURCE: Adapted from Singer (2013a).
historical perspective that immigrants gradually disperse and integrate with U.S. society over time and generation after initially settling in inner cities.
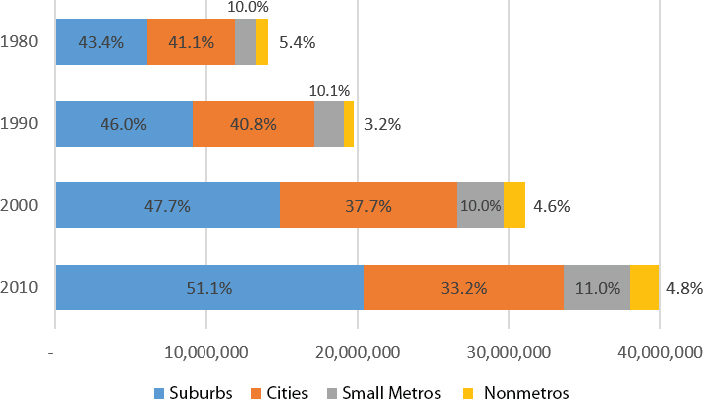
Residential integration occurs at multiple levels of geography (Lee et al., 2014; Massey et al., 2009). Yet, the usual metro-centric approach focusing on big-city neighborhood segregation may be less appropriate than the past.1 As illustrated below, immigrants are dispersing broadly across many different levels of geography—states, metropolitan cities, neighborhoods, and rural areas—and more than half of all immigrants are in the suburbs. This means that the usual generalizations based on the spatial assimilation model of big-city neighborhood segregation are incomplete and perhaps even misleading. Numerically speaking, the biggest shift in the distribution across places has been to the suburbs, where more than half of all immigrants currently live (see Figure 5-1) (Singer, 2013). A spatially inclusive approach to native-immigrant residence patterns is now required (Parisi et al., 2015). That is a key challenge for scholars today.
___________________
1 Segregation is the degree to which one or more groups live separately from one another. For more details on how this is conceptualized and measured, see Denton and Massey (1992).
States
Recent census data reveal that in 2010 more than 25 percent of the foreign-born population lived in California, and almost two-thirds of all immigrants lived in just six states: California, Florida, Illinois, New Jersey, New York, and Texas (Grieco et al., 2012). The spatial concentration of immigrants is greater than among the native-born population. California accounted for 10.2 percent of the native-born population, and the top six immigrant-receiving states were home to only about 36 percent of all native-born people (Grieco et al., 2012).
In 2012, about 26 percent of all immigrants were undocumented (see Figure 3-1), and the patterns of settlement of undocumented immigrants generally mirrored those of the immigrant population as a whole. For example, the top six receiving states for all immigrants are the same for the undocumented; these states accounted for 62.3 percent of all unauthorized immigrants in 2012 (Center for Migration Studies, 2015). The estimated numbers of immigrants eligible for Deferred Action for Childhood Arrivals (DACA) and Deferred Action for Parental Accountability (DAPA) also follow these patterns very closely.
In 2012, Mexicans made up more than 28 percent of the immigrant stock (11.5 million out of a total foreign-born population of 40.7 million) and they are even more concentrated than the total foreign-born population. According to recent research by the Pew Research Center, more than 58 percent of all Mexican immigrants live in just two states: California (4.2 million) and Texas (2.5 million).2 Immigrants from South and East Asia (principally immigrants from China, India, the Philippines, South Korea, and Vietnam) make up about a quarter of all immigrants: 10.4 million persons. These immigrants are more evenly distributed3 across the states than are Mexicans, with the main concentrations occurring in California (3.3 million) and New York (1 million). About 3.9 million immigrants are from the Caribbean; these immigrants remain highly concentrated, with more than 40 percent in Florida and another 28 percent in New York. Notably, the 3.2 million Central American immigrants are more evenly distributed than Mexicans, in part because of the significant numbers of El Salvadorans who have settled in the greater Washington, D.C., metropolitan area. South American immigrants have an East Coast orientation with concentrations in Florida, New Jersey, and New York; California, nevertheless accounts for over 9 percent of South Americans in the United States.
As noted in Chapter 3, in 2013 about 70,000 new refugees were re-
___________________
2 See http://www.pewhispanic.org/2014/04/29/statistical-portrait-of-the-foreign-bornpopulation-in-the-united-states-2012/#foreign-born-by-state-and-region-of-birth-2012-a [August 2015].
3 Measured using the Herfindahl index based on the percentage distribution across all states.
settled in the United States. This is roughly 5 percent of the total number of people who obtained lawful permanent residence status that year.4 The country profile of refugees is very different from that of other immigrants. Bhutan, Burma, and Iraq accounted for more than 70 percent of all arriving refugees in both 2012 and 2013. The principal receiving states were California and Texas, followed by Florida, Michigan, New York, and Pennsylvania. The top six states accounted for about 37 percent of all the refugees who arrived in 2012 and 2013. Thus refugees are more evenly distributed than are immigrants, but they are still distributed in a slightly more concentrated pattern that the native-born population (Burt and Batalova, 2014). And unlike the native-born and nonrefugee immigrants, refugees are also directed to specific places of settlement by the federal government. Although these are overwhelmingly places with large foreign-born populations, the refugees are also settled in smaller metropolitan areas where they may be disproportionately represented among the immigrant population (Singer and Wilson, 2006).
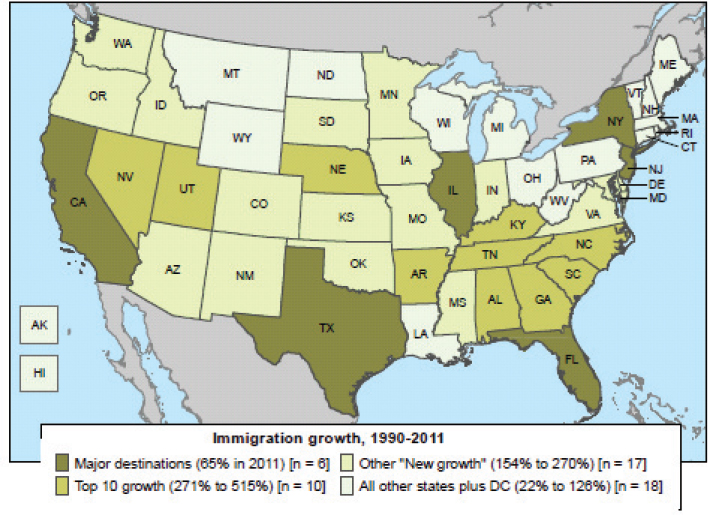
The top immigrant-receiving states have been important gateways for new immigrants for some time, but other states have become new destinations over the past two decades. In 2010, the six states with the largest immigrant populations accounted for 65 percent of the foreign-born population. This figure is nevertheless down from 2000 (68%) and 1990 (73%). For example, Mexican-born immigrants during the 1990s started leaving California in large numbers or moving to other destinations in a marked shift from the past. Today, the states with the highest rates of growth in immigrant populations include some relatively small states such as Nevada and Utah in the West but also include seven southern states (see Figure 5-2). The fiscal and political implications of the new state geography of U.S. immigration are played out unevenly at the local level: in cities, suburban communities, and neighborhoods.
Whether the realignment of immigrants across states reflects a process of spatial assimilation is open to debate. On the one hand, the passage of the Immigration Reform and Control Act (IRCA) in 1986 provided a new freedom for many newly legalized immigrants to freely move beyond traditional gateway states and communities. Long-established immigrant populations (i.e., Latin American immigrants in California, Texas, and elsewhere) also had accumulated sufficient socioeconomic and cultural resources to leave gateway enclaves for better employment opportunities and housing elsewhere (Card and Lewis, 2007; Light, 2008). On the other hand, the exodus from traditional gateways was often spurred by state anti-migrant legislation. For example, in California, Proposition 187 ac-
___________________
4 Another 29,000 individuals were granted asylum that year, with over a third of those coming from China. See Refugee and Asylee, Chapter 3.
SOURCE: Adapted from Jeff Passel, Pew Research Center, presentation to the panel, January 15, 2014.
celerated the departure of its foreign-born population, a circumstance that cannot be viewed as evidence of social and spatial integration. Moreover, the hardening of the border in the 1990s reduced illegal border entries in those heavily traveled areas and intentionally diverted flows to the Sonoran desert in Arizona, where authorities believed immigrants would be easier to catch (Nevins, 2010). The result was an unanticipated rise in death rates (Eschbach et al., 1999; Nevins, 2007) and a waning of California destinations as newer destinations held better opportunities. While an estimated 63 percent of all Mexican migrants arriving between 1985 and 1990 went to California, between 1995 and 2000 that figure shrank to just 28 percent (Massey and Capoferro, 2008). Clearly, state immigration policies contributed, perhaps unintentionally, to the spatial dispersal of new immigrants—both documented and undocumented—to nontraditional states in the Midwest and Southeast.
However, the continuing dispersal of immigrants from older gateway states to new, emerging destinations is by no means inevitable. Before the Great Recession, new gateway destinations drew significant numbers of
foreign-born internal migrants as well as immigrants arriving directly from abroad. The recession and its aftermath tarnished the allure of new destinations (for both immigrants and the native born), as the economies in many emerging destinations were particularly hard hit (Ellis et al., 2014a).
Metropolitan Areas
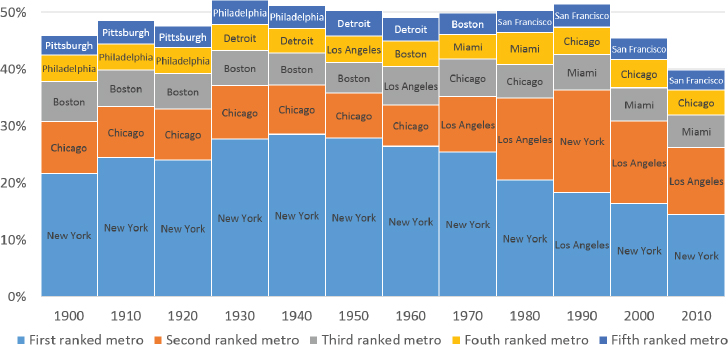
Immigrants overwhelmingly live in America’s largest metropolitan areas, which comprise cities and suburbs. In 2010, 85 percent of all immigrants lived in the 100 largest metropolitan areas, compared with 62 percent of the U.S.-born population (Singer, 2013, p. 81). The concentration of immigrants in metropolitan areas is not new. Immigrants historically have settled disproportionately in the nation’s largest cities. In 1900, for example, two-thirds of all immigrants lived in the nation’s largest 100 cities, compared to just 44 percent of the native-born population (Singer, 2013, p. 81). A significant proportion of immigrant settlement occurred then in just five metropolitan areas, and this has remained true for more than 100 years (see Figure 5-3).
In 2010, among the large metropolitan areas, 39 percent of Miami’s population was foreign-born. San Jose (37%) ranked second, followed by Los Angeles (34%), San Francisco (30%), and New York (29%). Among metropolitan areas with populations over 1 million, the five with the small-
SOURCE: Singer (2013, Fig. 1). Reprinted with permission.
est shares of immigrants in 2010 were Cincinnati, Cleveland, Pittsburgh, St. Louis, and Tulsa (Wilson and Singer, 2011).
Because the native-born population is predominantly white and the majority of immigrants are not, immigrants and their offspring are the main drivers of growing ethnic and racial diversity in the United States (Frey, 2015). Given the metropolitan orientation of U.S. immigration, this growing diversity is perhaps most often evident in cities and suburbs. All large metropolitan areas have become ethnically and racially more diverse since 1990 (Frey, 2015) and metropolitan areas with disproportionately large white populations are becoming a thing of the past: in 1990, 31 of the 53 largest metropolitan areas were 80 percent white, whereas in 2010, only 18 had populations more than 80 percent white. These changes are geographically uneven. In some metropolitan areas, especially those in the older industrial regions of the Northeast, whites remain numerically dominant, while other areas have rapidly diversified (Wright et al., 2013).
Immigrant-driven diversification itself is not uniform; different metropolitan areas have different immigrant and ethnic profiles. New York, for example, has a diverse set of immigrant populations, whereas immigrants from Asia, Central America, and Mexico are predominant in Los Angeles as well as major gateways such as Dallas-Fort Worth and Houston. Miami is also a major gateway, with more than 60 percent of Miami-Dade County residents claiming a Latino ethnicity, many of whom are foreign-born. Asian immigrants tend to concentrate in just three large immigrant gateways: San Francisco, Los Angeles, and New York. The metropolitan areas with the most immigrants from Africa (who make up about 4 percent of the total foreign-born population) are New York and Washington, D.C. Washington, D.C., is emerging as an important immigrant destination, but particularly for immigrants from Africa because Africans tend to perceive capital cities as centers for business, culture, and education—as they are in many of their home countries (Wilson and Habecker, 2008).
There is also geographic variation across metropolitan areas by legal status. For example, by mapping the undocumented share of the Mexican population, Hall and Stringfield (2014) showed that metropolitan areas that had had a longer history of Mexican settlement (in Southern California and Texas) had lower shares of undocumented immigrants than metropolitan areas in states with more recent Mexican immigration (e.g., Alabama, the Carolinas, Georgia, and Maryland).5
___________________
5 The Center for Migration Studies’ interactive website on the geography of the U.S. undocumented population adds further detail, see http://data.cmsny.org/ [August 2015].
Suburbs
What draws immigrants to different metropolitan areas has varied over time and is influenced by job opportunities (industrial restructuring and changing labor demand) in tandem with social networks. And where immigrants live within metropolitan areas also matters for their integration. Not only have immigrants found opportunities in many newer metropolitan destinations, they are no longer exclusively settling in inner-city neighborhoods of the largest metropolitan areas.
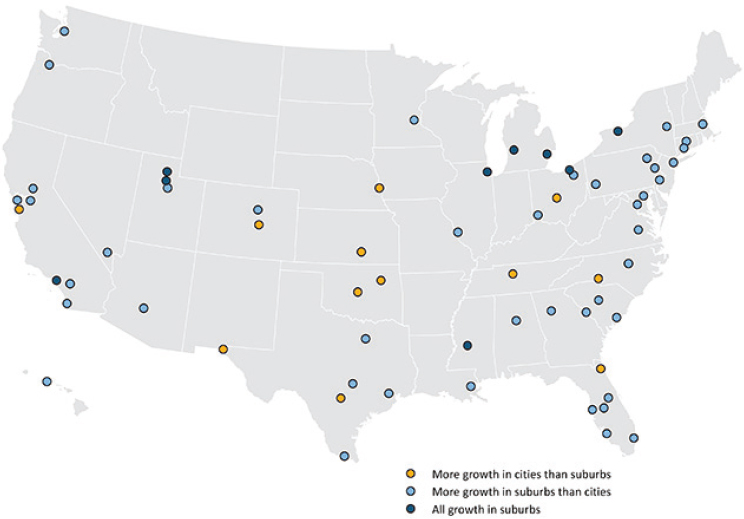
In 2010, 51 percent of all immigrants lived in the suburbs of the 95 largest metropolitan areas, while 33 percent lived within the city jurisdictions in those areas (Singer, 2013). As recently as 1980, similar shares lived in the cities and suburbs of the largest metros (41% and 43%, respectively). Overall trends in city and suburban settlements between 2000 and 2013 reveal that in the largest metropolitan areas, 76 percent of the growth in the immigrant populations occurred in the suburbs (Wilson and Svajlenka, 2014). In Chicago, Illinois; Cleveland, Ohio; Detroit and Grand Rapids, Michigan; Jackson, Mississippi; Los Angeles, California; Rochester, New York; and Ogden and Salt Lake City, Utah, virtually all of the metropolitan growth was in the suburbs (see Figure 5-4). These nine metropolitan
SOURCE: Wilson and Svajlenka (2014). Reprinted with permission.
areas reflect a mixture of former industrial powerhouses whose cities have been on the decline for decades and newer metropolitan areas, such as Salt Lake City, Ogden, and Jackson, where most of the population lives in suburbs. But Chicago and Los Angeles, which are well-established immigrant gateways, also saw all immigrant growth in the suburbs.
This suburban shift is partly related to the urban form of newer destinations that tend to be more suburban. In some suburban communities, it also reflects other metropolitan growth processes, such as out-migration and settlement shifts that include the native-born populations. In some cases, there is evidence of white flight from growing immigrant destination communities (Crowder et al., 2011). But another important factor is the restructuring of the U.S. economy: specifically, the decentralization of jobs and the rise of suburbs as the new locus of employment opportunity (Singer et al., 2008). Some metropolitan areas have developed strong knowledge-based industries, drawing high-skilled immigrants to the suburbs of Atlanta, Austin, Dallas, San Jose, Seattle, and Washington, D.C., where technology corporations are headquartered. During the economic expansion prior to the Great Recession, the growth of these industries also spawned housing and construction booms, drawing immigrant workers and making “the suburbs” more economically and racially diverse during the last immigration wave.
In some metropolitan areas, immigrant settlement is taking place almost entirely in the suburbs (Singer, 2013). Those areas with the highest shares of immigrants living in suburbs include places with small central cities, such as Atlanta (95% in suburbs) and Washington, D.C. (86% in suburbs), but also areas with central cities that have hemorrhaged population in recent years such as Detroit (87% in suburbs), Cleveland (86% in suburbs), and Dayton (83%). The newest immigrant destinations—mostly modest-sized metropolitan areas—have seen more than a doubling of the immigrant population in suburban areas. These places include Des Moines, Iowa; Indianapolis, Indiana; Jackson, Mississippi; Knoxville, Tennessee; Little Rock, Arkansas; and Louisville, Kentucky. Still, this is not a universal pattern. In 12 metro areas, including Asheville, North Carolina; Columbus, Ohio; Nashville, Tennessee; and Omaha, Nebraska, immigrant growth rates were faster in the city than in the suburbs. These are typically smaller metropolitan areas that have become new immigrant destinations over the past two decades.
The geography of job growth helps shape overall patterns of immigrant settlement. However, many of the fastest growing metropolitan immigrant destinations are places with small core cities and large suburbs, such as Atlanta and Washington, D.C. Others—including Austin, Texas; Charlotte, North Carolina; and Phoenix, Arizona—have large central cities developed through annexation and tend also to be sprawling, less dense communities
organized around automobile transportation. While the role of the city center and ethnic residential neighborhoods within that center has declined for immigrants, it is not immediately clear how suburban settlement affects the integration prospects for immigrants or for the communities in which they choose to live. Suburban places often lack institutional support services (e.g., nonprofit organizations, churches, and other government services) that help immigrants adjust to their new surroundings (Roth et al., 2015). Moreover, many suburban communities lack public transportation services, day care, or after-school programs that can accommodate the routine daily activities and work schedules of immigrants. Under these circumstances, it is not surprising that rates of poverty have grown most rapidly over the past decade in suburban areas that have become home for America’s new immigrant populations (Kneebone and Berube, 2013).
Neighborhoods
The impact of recent immigration into metropolitan areas is experienced first and foremost in the neighborhoods in which immigrants settle. Metropolitan areas with either large or fast-growing foreign-born populations have rapidly shifting patterns of immigrant concentrations and new forms of neighborhood racial and ethnic diversity (Holloway et al., 2012).6 Immigration since the 1970s has produced a shift from historical black-white segregation patterns toward more complex geographies in what have become multiethnic metropolitan regions (Fong and Shibuya, 2005; Frey, 2015).
Although many new immigrants still concentrate in particular neighborhoods, other immigrants and their offspring are what Logan and Zhang (2010, p. 1069) call “pioneer integrators” of previously all-white spaces. The result is that many neighborhoods are more diverse than they have been for decades (e.g., Holloway et al., 2012; Logan and Zhang, 2010). Rugh and Massey (2014) assessed these competing trends for aggregate racialized groups living in U.S. metropolitan areas between 1970 and 2010. Black segregation and isolation declined overall, but in those areas with longer histories of high levels of segregation, black hyper-segregation per-
___________________
6 See Mixed Metro U.S.: Mapping Diversity in the USA, a cooperative venture of the Departments of Geography at Dartmouth College, University of Georgia, and University of Washington at http://mixedmetro.us/ [August 2015].
sisted (Massey and Tannen, 2015).7 Latino segregation increased slightly while Latino isolation rose substantially in this 40-year period. Asian segregation started at moderate levels and changed little. Although Asian isolation increased, it remained at comparatively low levels. Rugh and Massey (2014) also found that whites remained “quite isolated from all three minority groups in metropolitan America, despite rising diversity and some shifts toward integration from the minority viewpoint.” The forces producing minority segregation and spatial isolation include density zoning ordinances that exclude low-income and minority populations (Rothwell and Massey, 2009, 2010), large or rising minority percentages, lagging minority socioeconomic status, and active expressions of anti-black and anti-Latino sentiment, especially in large metropolitan areas (Rugh and Massey, 2014). Places lacking these attributes are becoming more integrated, often relatively quickly (Rugh and Massey, 2014).
Immigrants generally tend to be more residentially segregated than their native-born counterparts, and segregation between immigrants and the native-born has increased since 1970 (Cutler et al., 2008). This suggests a lack of spatial assimilation, perhaps born of inequality in income, low levels of education, and cultural factors (e.g., poor English-language skills). One common empirical approach is to compare the patterns of neighborhood segregation of immigrants and immigrant groups with native-born whites. Iceland and Scopilliti (2008) measured residential segregation using the segregation index (on a scale from 0 for no segregation to 100 for complete segregation) across metropolitan areas.8 In 2000, the segregation index between the foreign-born population and native-born white population was 44.3. This means that 44.3 percent of immigrants would be required to move to other neighborhoods for immigrants to achieve the same distribution across neighborhoods as the native-born white population (Iceland and Scopilliti, 2008).
In general, the foreign-born gradually become less segregated from
___________________
7 Segregation is measured using two indices in the literature: dissimilarity and isolation. Segregation is measured using the Index of Dissimilarity (D). Dt is defined as

where mit and wit are the respective percentages of minorities and whites residing in census tract i at time t. This segregation index is based on pair-wise comparisons and varies from 0 (no segregation) to 100 (complete segregation). D indicates the percentage of minorities that would have to move to another neighborhood in order to achieve parity between minorities and whites in their percentage distributions across all neighborhoods. Isolation is a measure of the percentage of the population of a particular neighborhood or census tract who are of one racial or ethnic group. For example, an isolation index of 60 for Latinos means that Latinos, on average, live in neighborhoods that are 60 percent Latino.
8 In this report, the panel uses “segregation index” in place of “dissimilarity index.”
SOURCE: Data from Iceland and Scopilliti (2008). Reprinted with permission.
native-born whites and more dispersed across residential neighborhoods as length of residence increases (Iceland and Scopilliti, 2008; Wright et al., 2005). For example, recently arrived immigrants tend to have higher levels of segregation from whites than immigrants who have lived in the country for 10 or 20 years (Iceland and Scopilliti, 2008). Thus, the segregation index for all recently arrived (past 10 years) immigrants compared to whites was 52, in contrast to an index of 31 for all immigrants (compared to whites) who had been in the country at least 20 years. This result provides clear evidence of spatial assimilation, at least at the metropolitan neighborhood level, and supports the idea that immigrant integration is following the historical pattern of initial settlement in ethnic enclaves, followed by subsequent dispersal to more diverse and “better” neighborhoods (Alba and Nee, 2003).
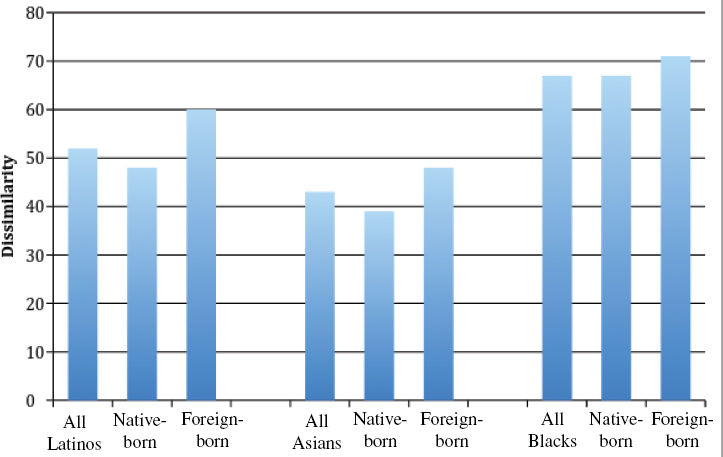
However, average segregation levels hide substantial heterogeneity by immigrant group. For example, Asian immigrants tend to be less segregated from native-born whites in metropolitan neighborhoods than are Hispanic or black immigrants (see Figure 5-5). According to Iceland and Scopilliti (2008), the segregation index for foreign-born Asians in 2000 was 47.7, compared with 59.9 among foreign-born Hispanics and 71.2 among foreign-born blacks. Segregation indices are lowest among foreign-born whites (D = 30.5). This racial hierarchy mirrors patterns of racial segrega-
tion nationally (Freeman, 2002; Logan et al., 2004), and highlights familiar patterns of black exceptionalism in integration processes. And, unlike the white, Hispanic, and Asian foreign-born populations, length of residence in the United States (as measured by year of arrival in the United States) was largely unrelated to foreign-born black-white declines in racial residential segregation (Iceland and Scopilliti, 2008; see also Wright et al., 2005). The implication for black immigrants is that improvements over time in socioeconomic status and other indicators of integration do not translate easily into spatial integration with native-born whites (or, by extension, into “better” neighborhoods).9
What accounts for these racialized patterns? The neighborhood has long been used as the starting point for understanding the integration process. Historical analysis and the research on recent immigration demonstrate that this process should not be measured in terms of years but rather decades or generations of immigrants (Brown, 2007). Even so, there is no simple one-to-one correspondence between immigrant social integration and segregation. Even considering just three aggregated racialized groups, patterns of immigrant concentration and the associated segregation from native-born whites varies by group (Figure 5-5). This reflects the long history of housing market discrimination against blacks in the United States that, along with poverty, has produced high levels of residential segregation (Massey and Denton, 1993). Immigrant blacks are not immune from these forces: foreign-born blacks are even more segregated from whites than are native-born blacks (Figure 5-5). The patterns for blacks are replicated for Latinos but with moderated levels of segregation from whites. Latinos also face housing market discrimination, historically and today (Turner et al., 2002). When these disadvantages are combined with low incomes, segregated residential patterns result. And heightened rates of residential segregation from whites are evident for foreign-born Latinos compared with native-born Latinos (Figure 5-5). In addition, Latinos of African origin (mostly from the Caribbean) are far more segregated than are white Latinos (Denton and Massey, 1989; Iceland and Nelson, 2008).
Yu and Myers (2007) also found differences by national origin when they tracked the residential assimilation of Chinese, Korean, and Mexican immigrants in Los Angeles. Each group exhibited a different trajectory and pace of assimilation. Chinese immigrants tended to rapidly enter into homeownership in predominantly suburban locations. Koreans were more likely than other immigrants to choose city residence and live in more
___________________
9 Estimates of the segregation index by generation or for 2010 are currently unavailable, in part because nativity status was not included in the 2010 Decennial Census and spatially disaggregated estimates based on the American Community Survey are subject to substantial sampling variability.
mixed white-and-Latino neighborhoods. In contrast, Mexican homeownership was more likely than the other groups to be associated with coethnic neighborhood residence (some implications of these patterns are discussed below).
In challenging the conventional narrative of dispersal and integration, another study found that the intermetropolitan dispersal of immigrants from traditional gateways was associated with heightened levels of immigrant segregation in new metropolitan and nonmetropolitan destinations (Lichter et al., 2010; Hall, 2013). Earnings, occupation, or time of arrival in the United States can account for some but not all of the high levels of immigrant segregation from natives. Immigrant legal status does, however, play a role. For instance, Hall and Stringfield (2014) found that while the presence of undocumented immigrants is correlated with higher levels of segregation between Mexicans and whites, it has the opposite effect on Mexican-black segregation—contributing to residential sharing among these groups.
Immigrants continue to face challenges to residential integration in both new and established areas of settlement, both for the above reasons and because the migration behaviors of the native-born exacerbate residential differences. Research examining how native-born white and black mobility relates to local immigrant concentrations, and how this relationship varies across metropolitan areas, indicates that as neighborhood immigrant populations grow, the likelihood of neighborhood out-migration by the native-born increases (Crowder et al., 2011; Hall and Crowder, 2014). This finding is independent of the sociodemographic characteristics of householders or the types of neighborhoods and metropolitan areas studied. Tellingly, this tendency to exit neighborhoods experiencing an influx of immigrants was most pronounced for the native-born who lived in metropolitan areas that were developing into notable immigrant gateway cities: that is, areas that were experiencing a rapid recent growth in foreign-born populations. The native-born in these areas who relocated tended to move to neighborhoods with smaller immigrant concentrations than the ones they left. This tendency was more pronounced in metropolitan areas that were developing into immigrant gateways than in other areas. Related research also reported growing immigrant neighborhood density produced native-born flight as well as slower housing price appreciation in immigrant-dense communities (Saiz and Wachter, 2011).
Despite changing attitudes toward racialized minorities and immigrants, the dynamics of neighborhood change retain some very familiar processes associated with the native-born wanting to literally distance themselves from relatively poor nonwhite immigrants, some of whom will be undocumented. Consequently, traditional gateways as well as emerging gateway metropolitan areas contain immigrant and second generation
neighborhoods lacking amenities. These neighborhoods provide limited opportunities for immigrant integration. If immigrants continue to arrive with low levels of human capital or from impoverished backgrounds, spatial integration may be delayed, perhaps occurring most rapidly between the second and third generations (Bean et al., 2015; Brown, 2007). Places with large concentrations of poor immigrant populations may become part of a more permanent settlement system, one where “the potential for neighborhood improvement is modest” (Alba et al., 2014).
The recent subprime mortgage crisis further highlights the precarious position of poor, and especially poor Latino, immigrants in residential housing markets. Rugh (2015) found that Latinos were more likely than other groups to have been subject to especially risky low- and no-documentation lending. The probability that Latino borrowers experienced foreclosure during this crisis was about the same as that for blacks prior to the crisis or in the Rust Belt. But after the crisis, Latinos were significantly more likely than blacks to lose their homes because they were concentrated in states where the recession was particularly acute (i.e., Arizona, California, Florida, and Nevada).
Nonmetropolitan and Rural Areas
Until recently, rural and small-town America had been largely excluded from discussions associated with immigration and integration. But that has changed over the past decade or so because of the widespread spatial dispersion of immigrants into new rural areas and small towns (Kandel and Cromartie, 2004; Marrow, 2011; Zuniga and Hernandez-Leon, 2006). Population growth in nonmetropolitan America over the past decade was a direct result of new Latino immigration and the second-order effects of high fertility (Johnson and Lichter, 2010; Lichter, 2012). Between 2000 and 2010, Latinos accounted for 58 percent of all nonmetropolitan population growth, yet represented only about 7 percent of total population in these areas. In addition, many hired farmworkers are foreign-born. Kandel (2008, Table 1) estimated that in 2006 one-third of farmhands were noncitizens; of those, almost 95 percent were Latino. Farmwork is tied less than in the past to seasonal farm jobs performed by migrant workers. Agricultural workers have increasingly put down roots; for example, on dairy farms or working on year-round agricultural operations.
New immigrant populations have been a lifeline for many “dying” small towns experiencing chronic out-migration, especially in America’s agricultural heartland (Carr et al., 2012). In a swath of counties from the Dakotas in the north to the Texas Panhandle in the south, the growth of the Latino immigrant population slowed overall population loss or overcame population loss of the native-born (Donato et al., 2008; Johnson and
Lichter, 2008). In the nonmetropolitan Midwest, for example, just 7 percent of counties accounted for 50 percent of Latinos (Lichter, 2012), many of whom are foreign-born. One consequence has been that the growth in some small rural communities has been extraordinary. As one example, Worthington, Minnesota experienced a Latino population increase from 392 in 1990 to 3,058 in the late 2000s.10 In 1990, Latinos accounted for only about 4 percent of Worthington’s population.11 In 2012, Latinos made up nearly one-third of Worthington’s population of nearly 13,000 people, and almost half were foreign-born.12
In nonmetropolitan areas, Latino growth and diversity have typically occurred in places where employment is linked to a few clearly defined industries (Parrado and Kandel, 2008). Some communities in the Midwest and Southeast with meat processing or meat packing plants now represent geographic “hot spots” for Latino growth (Gouveia et al., 2005; Griffith, 2005). Latino immigrants do the “dirty” and dangerous work that native workers apparently eschew. Latino growth is linked directly to rural industrial restructuring (especially in nondurable manufacturing, which include food processing) and, more generally, to the rapidly globalizing agro-food system. Recent studies found that, for Latino workers, relocating to small towns and rural areas has been a route to upward economic mobility, with few economic downsides for native-born workers (e.g., in the form of higher unemployment or lower wages), including low-wage, low-skilled black workers (Crowley et al., 2015; Turner, 2014).
New destinations are natural laboratories for studying highly located processes of social integration of immigrant communities. For instance, Massey and Capoferro (2008) showed that, between 1985 and 1990, only 10 percent of recently arrived immigrants from Mexico settled in new destinations (defined at the state level). However, a decade later during the 1995-2000 period, this percentage increased to 30 percent of Mexican immigrants.
The new growth of urban-origin Latino in-migrants into nonmetropolitan areas raises new integration challenges for many small towns unaccustomed to minority or foreign-born populations. Because of high Latino fertility (Lichter, 2012), and an aging-in-place native-born white population, generational strains have grown between older whites and the younger minority populations who often account for most new births and much of the school-age population. Schools may be less well equipped—in funding
___________________
10 Panel-derived estimates based on data from the 2005-2009 American Community Survey.
11 See http://www.census.gov/population/www/documentation/twps0029/twps0029.html [September 2015].
12 Panel analysis of data is from http://www.city-data.com/races/races-WorthingtonMinnesota.html [August 2015].
and personnel—to accommodate immigrant children who are disproportionately poor and who in many cases are being raised by parents who have little or no education and who may be undocumented (see Chapters 1 and 8). Large shares of undocumented rural immigrants are at risk of joining a permanent underclass that may prevent their children from moving ahead in American society (Green, 2003). Undocumented workers are overrepresented in the rural labor force, which arguably makes economic, political, and cultural incorporation more difficult (Kandel and Cromartie, 2004; Southern Poverty Law Center, 2010).
Rural immigrants risk becoming socially and culturally isolated from mainstream institutions, and often face strong anti-immigrant sentiment from natives (Maldonado, 2014; Southern Poverty Law Center, 2010). In Perry, Iowa, new Latino immigrants and migrants report becoming hyper-visible; that is, “a sense of ‘standing out’ associated with their physical presence as Latino-looking and Latino-sounding bodies moving in and through community spaces” (Maldonado, 2014, p. 1934). In this small town, Latino integration “is frail at best” (Maldonado, 2014, p. 1942).
Segregation indexes in new rural destinations in the 2000s remain high—rivaling rates found in metropolitan cities and suburbs (Parisi et al., 2011). In addition, Latino immigrants seem to be integrating more rapidly with blacks than whites, as measured by changes in small town segregation in the 1990s and 2000s. Segregation also seems to be especially high if immigrants lack authorization and legal recourse or a welfare safety net (Hall and Stringfield, 2014), and unauthorized immigrants are overrepresented in rural areas, where they often work at low pay in meat packing or other food processing plants, dairy farms, and agriculture. New immigrants from Mexico and Latin America, in particular, may face other hardships, including job discrimination and exploitation in the workforce. Anti-immigrant sentiment may be especially high in rural areas (e.g. Fennelly, 2008). Indeed, emerging evidence shows that native-born whites, especially those with school-age children, are exiting communities with growing immigrant populations (Crowder et al., 2011; Hall and Crowder, 2014). Research-based understanding of processes of immigrant integration and native reactions in rural Latino “boom towns” is clearly incomplete (Waters and Jiménez, 2005).
INTEGRATION “IN PLACE”
Immigrants work, go to school, worship, consume, recreate, and procreate in specific places—in big cities, suburban communities, and small rural towns. These places vary not only in population size but also in demographic makeup, labor force dynamics and job opportunities, and racial and ethnic diversity and relations. For the children of immigrants, the
context of reception affects the type and quality of schooling, peer group interactions, and avenues for upward mobility. Immigrant newcomers initially join friends and family in ethnic enclaves, segregated neighborhoods, or minority communities. There, they become exposed to local employment opportunities, housing markets, and customs and language. Some stay while others eventually disperse into the majority society as part of the integration process (Alba and Nee, 2003).
Where immigrant populations live often changes over time and across the generations (Goodwin-White, 2015; Kritz and Gurak, 2015). Immigrants are drawn to specific receiving areas for a variety of reasons, but they also invariably affect communities and neighborhoods in ways that ultimately reshape processes of social integration and incorporation. The key substantive question seems clear. What is it about specific places—contexts of reception—that attracts new immigrants and affects the pace of social integration, as measured by schooling, employment patterns, poverty, and the provision of social services? Which kinds of places successfully accommodate immigrants? Answers to these questions are incomplete. The relevant research literature is inchoate and ultimately unsatisfying, but it nevertheless provides some important and basic lessons about spatial integration of immigrants and their offspring.
For example, much of the relevant recent literature has focused on the question of whether the recent widespread movement of immigrants to “new destinations” reflects the positive selectivity of upwardly mobile immigrants, where migration represents an investment in human capital that is ultimately rewarded with better schools for their children, better jobs, and more affluent communities. In other words, does spatial mobility reinforce a process of integration that is already well under way (Hall, 2013)? Here the panel considers research on spatial variation in two key indicators of social integration—academic achievement and various economic outcomes (including access to jobs). The research literature is most mature on these topics. Other indicators of integration at the local level, such as political participation or intermarriage, have received much less research attention.
The fact that immigrant families often settle in economically disadvantaged communities and neighborhoods—where they can afford to live—also means that they are typically served by inadequately funded school districts and few institutional support services. For example, in their review, Perreira and colleages (2006) claimed that minority and immigrant youth living in disadvantaged neighborhoods complete fewer years of schooling, drop out of high school at higher rates, and perform poorly on math and reading achievement tests. Moreover, in ethnic enclaves, the competing obligations of strong kinship and peer networks may dampen academic aspirations and achievement. Perreira and colleagues (2006) in fact showed that immigrants living in segregated and racially mixed neighborhoods were
significantly more likely to drop out of school than their co-ethnics in less segregated neighborhoods. Much of the neighborhood effect was indirect, operating through other forms of cultural and social capital (e.g., neighborhood quality affects parenting styles, such as parental supervision, and the characteristics of schools).
More recently, attention has turned to new destinations and to questions such as whether out-migration from gateway states and cities to these new destinations is selective of more highly educated groups (a pattern consistent with the canonical model of spatial assimilation) or whether children in new destinations benefit or are harmed by relocating in nontraditional receiving areas (Fischer, 2010; Stamps and Bohon, 2006). On the question of immigrant educational selectivity among Hispanics, Lichter and Johnson (2009) found a clear educational gradient, with the least-educated Hispanics overrepresented in established gateways. In established areas, for example, the percentage of high school graduates among nonmovers was about 37 percent, compared with about 46 percent among out-migrants from these areas. The most educated group of Hispanics, regardless of migrant status, lived in ‘‘other’’ areas—neither in gateways nor new destinations but in areas that were composed of mostly non-Hispanics. These results provide some evidence of spatial assimilation. Still, there is little evidence on the question of whether the quality of life (variously measured) is “better” in new destinations than in the communities and neighborhoods from which out-migrants moved.
On the question of whether the children of immigrants actually benefit from moving to new destinations, there is likewise little scholarly consensus on empirical approach or findings. For example, Dondero and Muller (2012) showed that schools in new destinations generally provided more favorable educational opportunities for immigrant children, albeit with fewer linguistic support services than schools in established destinations. Yet they also reported larger within-school Latino versus non-Hispanic-white gaps in advanced math courses in new destinations than in established gateways. However, the differences between Latino students in new versus established destinations were small. Other research that is done at different levels of geography have drawn different conclusions. On one side, Potochnick (2014) found that 10th grade math and reading test scores among the children of immigrants were highest in the new high-immigration states. But Fischer (2010) reported that immigrant children in new destinations compared unfavorably with their counterparts in established destinations, where the children of immigrants were less likely to drop out of high school.
These studies are difficult to compare. They typically highlight generational differences in educational outcomes, but do not control for race and ethnicity and therefore short-circuit evidence of differences among immigrants from different national origin groups. A recent meta-analysis
by Duong and colleagues (2015) of 53 studies makes this point, emphasizing the substantial racial and ethnic variation in the context of immigrant reception, including the availability of community and school resources. The authors claimed that “Latino and Black children face greater risk for academic failure, as they are more likely to reside in neighborhoods with high rates of delinquency and community violence, face discrimination and racism, struggle against negative stereotypes regarding their academic ability, and encounter peer pressure for antischool attitudes” (Duong et al., 2015, p. 5).
The evidence and conclusions for Hispanic immigrants contrast sharply with the high educational achievement of Asian immigrant populations (see Chapter 6), where empirical studies have typically focused on culture (e.g., family and social capital, educational values and practices, and Confucianism) rather than on structural opportunities or deficits (e.g., impoverished neighborhoods or poorly resourced schools) that promote or limit educational success (Zhou et al., 2008; Zhou, 2009). Indeed, big-city Asian ethnic enclaves—Chinatowns and Koreatowns—often have well-established community resources (e.g., afterschool language programs and Saturday day schools) that foster upward mobility among these immigrant groups. Asian immigrants have “put down roots,” unlike many low-skilled transient Hispanic workers and their families, who must move to where the jobs are (i.e., in construction or food processing) or follow the harvest seasons. In their study of Chinese and Korean immigrants, Zhou and Kim (2006, p. 21) argued that “the cultural attributes of a group feed on the structural factors, particularly ethnic social structures that support community forces and social capital.”
Not unlike the evidence on school outcomes, studies of spatial heterogeneity in economic integration are similarly difficult to summarize neatly across diverse immigrant populations. By definition, immigrants seeking employment and higher wages tend to relocate or settle in local labor markets experiencing rapid population and job growth. Perhaps not surprisingly then, immigrants, on average, tend to have higher rates of employment than their native-born ethnic counterparts (see Chapter 6). But, even here, it is often difficult to separate evidence of positive community or neighborhood effects from the positive selectivity of new immigrants. Moreover, employment opportunities are played out unevenly over geographic space and national origin groups. They are shaped by the ebb and flow of local labor market conditions and the demand for low-skill labor.
Industrial restructuring in the meat packing industry provides a clear case in point (Kandel and Parrado, 2005). The growth in beef, pork, and poultry processing plants in rural areas reflects America’s changing meat consumption habits, energy technology, and marketing strategies (e.g., cutup meat products on site rather than by local butchers), new anti-union
management strategies designed to hire unorganized, poorly educated, and low-skilled workers (including new immigrants and undocumented workers in remote settings), and the realization of new savings on transportation costs from locating slaughter houses and processing plants closer to where the animals are raised. For the meat processing industry, Kandel and Parrado (2005) showed that the share of Hispanic workers increased from 8.5 to 28.5 percent between 1980 and 2000, while the shares of the foreign-born among Hispanic workers increased from 50 percent to 82 percent over the same period. About 70 percent of Hispanic workers had less than a high school education. This is a clear case of Hispanic immigrant labor following job growth in rural America. Hispanics are also following jobs in the dairy industry (e.g., in the agricultural Midwest and elsewhere) and in apple orchards, vineyards, and vegetable farms (Cross, 2006; Gozdziak and Bump, 2004).
The demographic and economic impacts of new immigration on rural America have been obvious. Many previously declining small towns have boomed since 1990, and Hispanic immigrants have generally benefited economically in comparison to their counterparts in Mexico and other parts of Latin America and in traditional urban gateways. For example, Donato and colleagues (2007) identified 59 nonmetropolitan counties that, between 1990 and 2000, experienced overall population growth but only because of the growth of the foreign-born population, thus offsetting population decline. Over the decade, the shares of foreign-born Mexicans in these “offset counties” who spoke English well declined, as did the shares with a high school diploma or more. Despite declines in human capital, poverty rates nevertheless declined over the decade, and median household income and wage rates increased.
But these relative economic gains may have been reversed as a result of the Great Recession in the late 2000s. In a recent study of Hispanic growth in the nonmetropolitan South over the 1990-2010 period, Crowley and colleagues (2015) showed significantly higher Hispanic employment rates in new destinations (71.1%) than in established gateways (61.6%). However, in 2010 poverty rates across different population groups (children, female heads of household, and others) tended to be significantly higher in new destinations than traditional gateways—a much different pattern from 2000, when differences were generally small and statistically insignificant. This finding speaks indirectly to the low and declining wages among Hispanic workers since 2000 in many new destination labor markets. Still, Hispanic homeownership increased, compared to the 2000s, as many immigrants “put down roots” and crowding (measured by persons per room) decreased. The test of integration will ultimately depend on whether places with fast-growing Hispanic populations can serve the children of immigrant families as launching points for upward mobility or whether those children
will become “trapped in place,” reproducing the economic circumstances and hardships of their parents. And what happens when boom goes bust in such areas?
Small rural labor markets, often dominated by a single industry, provide a suitable but incomplete venue for assessing the local economic incorporation of low-skill Hispanic immigrant populations. To be sure, the situation in many rural boom towns is decidedly different from the diverse economic experiences of immigrants in large metropolitan and suburban areas, where most Hispanic, Asian, and other refugee populations actually live and work. For example, suburbanization typically has connoted upward mobility and the attainment of the “American Dream.” This is still true today (especially among Asian immigrant groups), but with some important caveats. The first is that the term “suburbs” covers a diverse set of places regarding economic status, housing prices, access to transit, job growth, and proximity to central cities. The rise of poverty in the suburbs has accelerated, and although residents of central cities are more likely to be poorer than their suburban counterparts, there are now more persons living in poverty in the suburbs than in cities (Kneebone and Berube, 2013). The second caveat is that as suburbs have been changing both economically and racially, some of that change is attributable to immigrant settlement. Suburban job growth has been a factor, as low-wage workers have been drawn to live closer to their jobs. In addition, post-recession job loss, particularly in the construction and manufacturing sectors, hit the suburbs especially hard (Singer and Wilson, 2010). However, Suro and colleagues (2011) found that although immigrants accounted for almost a third (30 percent) of overall population growth in the suburbs in the 2000s, they contributed less than a fifth (17%) of the increase in the poor population.
For immigrants in the inner suburban ring and in exurbia, housing may be readily available and more affordable, but the institutional support services that have historically helped promote social integration in established gateways may be lacking (Allard and Roth, 2010). Indeed, access to public transportation is often a problem—to get to work, to shop, and to perform routine daily activities (e.g., drop the children off at preschool programs or daycare, go to the doctor, attend religious services, or participate in civic events) (Ray, 2003). Suburbanization under these circumstances arguably is less an indicator of social integration than of spatial and social isolation of new immigrant populations.
The problem is that the current literature lacks a clear or compelling narrative of the changing economic circumstances and social integration of immigrants living in the suburbs. Moreover, it is hard to distinguish selection from causation, namely, whether suburbs are attracting different socioeconomic profiles of immigrants or instead contributing positively (or
negatively) to economic integration. Are (some) immigrant populations becoming ghettoized in economically declining suburbs?
Other recent studies have focused on the lack of public transportation and its corollary: the “spatial mismatch” between where immigrants live and where good jobs are located. But recent studies typically have focused on specific metropolitan areas from which broad or compelling generalizations are difficult to draw (e.g., McKenzie, 2013; Painter et al., 2007). For example, Liu (2009) found that suburban residence in the Chicago, Los Angeles, and Washington, D.C., metropolitan areas was positively associated (compared with the central cities in their respective metropolitan areas) with employment rates among immigrant populations. She also observed positive enclave effects both in the city and suburbs. Large scale cross-city or comparative studies of the economic trajectories of suburban immigrants of different national origins are surprisingly rare. Other studies have found little or only mixed evidence in support of “enclave effects” on economic outcomes (see Xie and Gough, 2011).
Virtually all of the recent literature on new destinations has focused on disadvantaged Hispanic populations. An exception is a recent study by Flippen and Kim (2015), who focused on the relationship between Asian settlement patterns in new and traditional destinations and socioeconomic attainment (earnings and occupational status) in metropolitan areas. Their analysis revealed higher socioeconomic status among some Asian populations (Chinese, Filipinos, Indians, and Japanese) in new destinations vis-àvis established gateways. For other Asian populations (i.e., Koreans and Vietnamese), the reverse was true (Flippen and Kim, 2015).
The panel’s review of this research raises many more questions than it answers. Simple or straightforward generalizations are difficult to identify or neatly summarize, because just as “immigrants” do not represent a group with a uniform set of characteristics, “the suburbs,” cities, and other geographies where they reside are not monolithic; the opportunity structures vary from one location to another. As America’s immigrant populations disperse spatially and put down roots, it will become increasingly important to monitor local processes of integration for different national origin groups. Evidence of integrational mobility among immigrant populations is key; social integration will be played out at the local level and in emerging patterns of geographic mobility. This will also require up-to-date and longitudinal data at the community and neighborhood level (see Chapter 10). The current literature is developing rapidly but is still immature.
STATE AND LOCAL CONTEXTS AND POLICY RESPONSES
One of the most significant trends of the last decade has been the effort by some state and local governments to wrest control over immigration
from federal authority and develop legislation on immigration and immigrants within their borders (see Chapter 2). Since 2000, new trends in immigrant settlement have stirred social conflict and anxiety over job competition and the costs of providing publicly funded services such as health care and schooling to undocumented immigrants and their children. These trends, combined with the frustration of state and local officials with the lack of efforts by Congress to take up comprehensive immigration reform, have produced a rash of local legislation. The result, discussed in detail in Chapter 2, has been a type of federalism around policies that affect immigrants, as states and localities pursue their own management and control over immigration. Thus, since the early 2000s, immigration policy activism across state and local jurisdictions has produced policies and programs that exclude and expel immigrants in some places but welcome immigrants and support their integration in other places.
For instance, many states, cities, and counties have responded to federal inaction to change immigration policy and have proposed or passed laws intended to exclude or deflect immigrants. These actions include laws that penalize employers who knowingly employ immigrants who are unauthorized to work; laws that forbid landlords from renting to undocumented immigrants; laws that do not allow immigrants to congregate in informal day labor sites; and laws that prevent undocumented residents from getting state-issued driver’s licenses, business licenses, and in-state tuition and scholarships (Varsanyi, 2010; Walker, 2015). In addition to state and local measures, new federal policies require coordination with policing at the local level, and the variable response of local police forces to these policies have produced what scholars have labeled a “multilayered jurisdictional patchwork” of immigration enforcement—a landscape complicated by varying and overlapping responsibilities of local authorities (Varsanyi et al., 2012; Walker, 2015).
However, President Obama’s Executive actions in November 2014 changed the enforcement system by re-prioritizing categories of undocumented immigrants that are to be removed (with the aim of targeting the more serious threats to public safety) and replacing the Secure Communities Program with a new more tailored Priority Enforcement Program (PEP) (Rosenblum, 2015). Because the Secure Communities Program engendered considerable resistance in many communities, including some that refused to participate, the Department of Homeland security will, under PEP, work with individual communities “to develop protocols that stipulate agreed-upon enforcement practices” (Rosenblum, 2015).
While it is difficult to assess the effectiveness of such policies, one can reasonably assume that they will not serve to further the integration of immigrants, especially if immigrants flee from areas perceived as pursuing enforcement more stringently. Arizona has been ground zero in efforts to
expel immigrants, and some evidence exists that Arizona’s laws worked. As noted in Chapter 2, SB 1070, passed in 2010, made it a crime to be present in the state without legal status and authorized local police to check the immigration status of anyone the police suspected of being in the country without authorization. Two years earlier, Arizona enacted the Legal Arizona Worker’s Act (LAWA), making it the first state that required all public and private employers to authenticate the legal status of their workers using the federal employment verification system known as E-Verify. While laws like LAWA and local restrictions target undocumented immigrants, most of whom are from Latin America, other immigrants experience the laws’ effects, such as those living in mixed status households.
Although the Supreme Court pulled much of the teeth from SB 1070 (Chamber of Commerce of the United States v. Whiting, 131 S. Ct. 1968, 2011; see Table 2-2 in Chapter 2) and similar legislation in other states, the message conveyed by SB 1070 and LAWA that Arizona had become intolerant of undocumented immigrants created fear and anxiety among immigrants and their families (see Chapter 3). As noted in Chapter 2, LAWA likely prompted some Latinos to move to other states (Bohn et al., 2014; Lofstrom et al., 2011). In addition, Ellis and colleagues (2014b) found that after LAWA, noncitizen foreign-born Latinos exited Arizona at higher rates relative to other states. They found weaker evidence of outmigration for other Latino groups who might experience fear, or resent LAWA’s requirements: U.S.-born Latinos did leave Arizona at higher rates in 2008 but naturalized Latinos did not. Nevertheless, the results suggest that state-level immigration policy can alter the settlement geography and integration experience of the foreign-born.
These differing orientations to local immigrant integration have led to a jumble of policies and practices across local jurisdictions. While demographic, economic, and political contexts are important for understanding both settlement patterns and immigrant integration, measuring such contexts is difficult across places and time (see Gelatt et al., 2015, for a good discussion of efforts to measure and describe the range of state and local policy contexts).
There are several potential explanations for the differing approaches to “managing” immigration at the local level. While there are case studies of local anti-immigrant policy activism (see for example Varsanyi, 2008), it seems likely that a range of factors, including population change, local politics, and economic conditions, are needed to explain how particular places move toward more-restrictive or less-restrictive policies. For example, Hazleton, Pennsylvania, was the first municipality that instituted an ordinance that penalized landlords who knowingly rented property to undocumented immigrants (Flores, 2014). Places with rapidly growing foreign-born populations and with a relatively high percentage of owner-
occupied housing have been more likely to introduce such exclusionary policies. In contrast, municipalities with better-educated populations have been more likely to adopt inclusionary policies (Walker and Leitner, 2011). Region matters also, as exclusionary policies are often associated with sudden and rapid immigrant growth. Municipalities in the South and outside central cities also tend to impose exclusionary policies (Walker and Leitner, 2011).13
Ramakrishnan and Wong (2007) found that the factors compelling local action include the size and growth of the Latino population; the attendant challenges to schools, housing, and neighborhoods; unease or prejudice among resident populations; and the presence of partisanship and politicization of immigration at the local level. A case study of Prince William County, Virginia in suburban Washington, D.C. (DeRenzis et al., 2009), concluded that the confluence of several factors, including swift population change and growth of the immigrant population, local activism and discourse around the problems of undocumented workers and residents, and unseasoned local government, coupled with the lack of an immigrant service and advocacy infrastructure. These factors combined with upcoming election pressures to heighten the issue’s importance, resulting in an enforcement regime that was the most stringent in the country at the time of its passage (Singer et al., 2008).
On the other end of the spectrum of local responses, places that have developed pro-immigrant integration policies or have local (nongovernmental) programs appear to fall into two types. The first type comprises those localities that have long-established, large immigrant and refugee populations, well-developed supportive services, and strong identities as immigrant gateways, such as San Francisco and New York. In these places, deep infrastructure supports programs for immigrants, aimed at helping to alleviate poverty and providing adult education, language training, credentialing, civic engagement, and legal services. The second type comprises places with low levels of immigration and slow or declining population growth that aspire to receive and retain more immigrants as a way to stem population loss and increase economic activity. For example, a group of 20 Midwestern cities has created a network with the mission: “to strengthen the work, maximize the impact, and sustain the efforts of local economic and community development initiatives across the region that welcome, retain, and empower immigrant communities as valued contributors to the region’s shared prosperity.” These initiatives seek to retain international students, facilitate entrepreneurship, and support the credentialing
___________________
13Flores (2015) found that proposals of anti-immigrant legislation are correlated with increased gun sales across counties in Pennsylvania and South Carolina, perhaps reflecting political rhetoric linking immigrants to crime and social disorder.
of highly skilled immigrants who were trained outside the United States. These contexts are important for understanding how a locality develops pro- or anti-immigrant policies, yet there are no definitive studies providing evidence across places.14
Ramakrishnan and Gulasekaram (2014) argued that the tide has turned against local restrictive efforts. They cited as evidence the growing number of places passing laws that aid in integration and limit cooperation with federal authorities seeking to enforce deportation orders and the Supreme Court ruling (Arizona v United States 567 U.S., 2012), in which the majority of justices voted for the reassertion of federal authority over state actions to control immigration. They also cited the 2012 Presidential election, in which Republican candidate Mitt Romney, whose immigration platform centered on “attrition through enforcement” to promote self-deportation of undocumented immigrants, lost to President Barack Obama by record margins among Latino and Asian American voters. Moreover, as discussed in Chapter 4, research indicates that immigrants are more likely to naturalize in places where the context of reception is relatively welcoming. However, election cycles matter, and immigration policy appears to be an increasingly vocal and contentious issue for the November 2016 elections.
It is difficult to measure the direct impact that state and local policies have on the integration of immigrants, both as first- and second-order consequences. Additionally, policy stances can shift quickly over time, making it difficult to collect and measure the dynamic policy landscape (Gelatt et al., 2015). However, the panel concludes, from the evidence cited above, that place matters in ways that are directly tied to the policies, programs, and service infrastructure in particular localities.
SUMMARY AND CONCLUSION
The spatial integration of immigrants and racial and ethnic minority populations arguably is an increasingly important indicator of integration into American society. Where immigrants live reflects and reinforces social integration and shapes access to good schools, safe neighborhoods, and good jobs. Moreover, different national origin groups have differing distributions in geographic space and face different and often unequal access to society’s rewards and different community responses from the native-born populations residing in the same locality. For much of the 20th century, the majority of immigrants concentrated overwhelmingly in a small number of gateway states and large metropolitan areas. Today, growing opportuni-
___________________
14 An exception is the study by Flores (2015), mentioned in the preceding footnote, on the association among anti-immigrant attitudes, political rhetoric claiming a link between immigrants and crime, and increased gun sales counties of Pennsylvania and South Carolina.
ties outside traditional gateways have attracted immigrants to what have become known as “new immigrant destinations,” which include many suburbs and rural areas as well as urban areas that have little or no recent history of immigration. Immigration—and social integration—has become a national issue as recent immigrants have spread throughout the nation.
The local context of reception shapes immigrant integration into American society. This issue is perhaps more important than ever as America’s immigrant population has grown and dispersed spatially. Indeed, the migration of America’s foreign-born population to “new destinations” has upended conventional interpretations of the link between spatial and social mobility. Yet new patterns of spatial dispersal are occurring at the same time that individual immigrant groups (by source country) are concentrating in particular locations. Are some immigrants increasingly “trapped” in economically declining areas, joining a minority underclass, or do immigrant gateways (still) represent landing and launching pads for something better in new destinations—for both the first generation immigrants and their children? It is much too early to tell, especially in the new destinations now dominated by recently arrived immigrants and their growing children.
As a result, the panel’s review yielded incomplete and rather mixed messages about place-to-place patterns of social integration. Today’s widespread spatial diffusion of immigrants implies greater spatial integration, but there is also evidence of important variations by race and national origin with respect to neighborhood segregation.
Conclusion 5-1 Neighborhoods are more diverse than they have ever been, and the number of all-white census tracts has fallen. Yet racial segregation is still quite prevalent throughout the country, with black immigrants experiencing the most residential segregation from non-Hispanic whites, followed by Hispanic immigrants and then Asian immigrants. Spatial integration is mediated by race, and improvements over time in socioeconomic status and other indicators of integration (e.g., education or earnings) do not translate easily into spatial integration with native-born whites (or, by extension, into “better” neighborhoods), particularly for black immigrants.
National portraits of immigration and immigrant integration—in its myriad forms—may also increasingly mask idiosyncratic patterns that are shaped mostly by local social, economic, and political conditions. New destinations in particular provide natural laboratories for better understanding how immigrant integration is shaped by the context of reception, the presence of other co-ethnics, good job opportunities, residential segregation, anti-immigrant sentiment, and inclusively or exclusionary public policies. There is much more work to be done to understand the day-to-day experi-
ences of immigrants and their descendants in different places and facing diverse contexts of reception.
REFERENCES
Alba, R., and Foner, N. (2015) Strangers No More: Immigration and the Challenges of Integration in North America and Western Europe. Princeton, NJ: Princeton University Press.
Alba, R., and Nee, V. (2003). Remaking the American Mainstream: Assimilation and Contemporary Immigration. Cambridge, MA: Harvard University Press.
Alba, R., Deane, G., Denton, N., Disha, I., McKenzie, B., and Napierala, J. (2014). The role of immigrant enclaves for Latino residential inequalities. Journal of Ethnic and Migration Studies, 40(1), 1-20.
Allard, S.W., and Roth, B. (2010). Strained Suburbs: The Social Service Challenges of Rising Suburban Poverty. Washington, DC: Brookings Institution Press. Available: http://www.brookings.edu/~/media/research/files/reports/2010/10/07-suburban-poverty-allardroth/1007_suburban_poverty_allard_roth.pdf [August 2015]
Bean, F.D., Brown, S.K., and Bachmeier, J.D. (2015). Parents Without Papers: The Progress and Pitfalls of Mexican American Integration. New York: Russell Sage Foundation.
Bohn, S., Lofstrom, M., and Raphael, S. (2014). Did the 2007 Legal Arizona Workers Act reduce the state’s unauthorized immigrant population? The Review of Economics and Statistics, 96(2), 258-269.
Brown, S.K. (2007). Delayed spatial assimilation: Multigenerational incorporation of the Mexican-origin population in Los Angeles. City & Community, 6, 193-209.
Burt, L., and Batalova, J. (2014). Refugees and Asylees in the United States. Washington, DC: Migration Information Source. Available: http://www.migrationpolicy.org/article/refugees-and-asylees-united-states [March 2015].
Card, D., and Lewis, E.G. (2007). The diffusion of Mexican immigrants during the 1990s: Explanations and impacts. In G.J. Borjas (Ed.), Mexican Immigration to the U.S. (pp. 193-227). Chicago, IL: University of Chicago Press.
Carr, P.J., Lichter, D.T., and Kefalas, M.J. (2012). Can immigration save small-town America? Hispanic boomtowns and the uneasy path to renewal. The ANNALS of the American Academy of Political and Social Science, 641(1), 38-57.
Center for Migration Studies. (2015). 2013 U.S. Unauthorized Population. New York: Author. Available: http://cmsny.org/researchprojects/democratizingdata/us/unauthorizedtables/#table1a [March 2015].
Cross, J.A. (2006). Restructuring America’s dairy farms. Geographical Review, 96(1), 1-23.
Crowder, K., Hall, M., and Tolnay, S.E. (2011). Neighborhood immigration and native out-migration. American Sociological Review, 76(1), 25-47.
Crowley, M., Lichter, D.T., and Turner, R.N. (2015). Diverging fortunes? Economic well-being of Latinos and African Americans in new rural destinations. Social Science Research, 51, 77-92.
Cutler, D.M., Glaeser, E.L., and Vigdor, J.L. (2008). Is the melting pot still hot? Explaining the resurgence of immigrant segregation. The Review of Economics and Statistics, 90(3), 478-497.
Denton, N.A., and Massey, D.S. (1989). Racial identity among Caribbean Hispanics: The effect of double minority status on residential segregation. American Sociological Review, 54, 790-808.
DeRenzis, B., Singer, A., and Wilson, J. (2009). Prince William County Case Study: Immigrants, Politics, and Local Response in Suburban Washington. Washington, DC: Brookings Institution Press. Available: http://www.brookings.edu/research/reports/2009/02/25-immi-gration-singer [September 2015].
Donato, K.M., Tolbert, C.M., Nucci, A., and Kawano, Y. (2007). Recent immigrant settlement in the nonmetropolitan United States: Evidence from internal census data. Rural Sociology, 72(4), 537-559.
Donato, K.M., Tolbert, C., Nucci, A., and Kawano, Y. (2008). Changing faces/changing places: The emergence of nonmetropolitan immigrant gateways. In D.S. Massey (Ed.), New Faces in New Places: The Changing Geography of American Immigration (pp. 75-98). New York: Russell Sage Foundation.
Dondero, M., and Muller, C. (2012).School stratification in new and established Latino destinations. Social Forces, 91(2), 477-502.
Duong, M.T., Badaly, D., Liu, F.F., Schwartz, D., and McCarty, C.A. (2015). Generational differences in academic achievement among immigrant youths: A meta-analytic review. Review of Educational Research, XX(X), 1-39. Available: http://rer.sagepub.com/content/early/2015/03/30/0034654315577680.full.pdf+html [September 2015].
Ellis, M., and Almgren, G. (2009). Local contexts of immigrant and second-generation integration in the United States. Journal of Ethnic and Migration Studies, 35(7), 1059-1076.
Ellis, M., Wright, R., and Townley, M. (2014a). The great recession and the allure of new immigrant destinations in the United States. International Migration Review, 48(1), 3-33.
Ellis, M., Wright, R., Townley, M., and Copeland, K. (2014b). The migration response to the Legal Arizona Workers Act. Political Geography, 42, 46-56.
Eschbach, K., Hagan, J., Rodriguez, N., Hernandez-Leon, R., and Bailey, S. (1999). Death at the border. International Migration Review, 33(2), 430-454.
Fennelly, K. (2008). Prejudice toward immigrants in the Midwest. In D. Massey (Ed.), New Faces in New Places: The Changing Geography of American Immigration (pp. 151-178). New York: Russell Sage Foundation.
Fischer, M.J. (2010). Immigrant educational outcomes in new destinations: An exploration of high school attrition. Social Science Research, 39(4), 627-641.
Flippen, C., and Kim, E. (2015). Immigrant context and opportunity: New destinations and socioeconomic attainment among Asians in the United States. The ANNALS of the American Academy of Political and Social Science, 660(1), 175-198.
Flores, R.D. (2014). Living in the eye of the storm: How did Hazleton’s restrictive immigration ordinance affect local interethnic relations? American Behavioral Scientist, 58(13), 1743-1763.
Flores, R.D. (2015). Taking the law into their own hands: Do local anti-immigrant ordinances increase gun sales? Social Problems, 62(3). Available: http://socpro.oxfordjournals.org/content/62/3/363 [September 2015].
Fong, E., and Shibuya, K. (2005). Multiethnic cities in North America. Annual Review of Sociology, 285-304.
Freeman, L. (2002). Does spatial assimilation work for black immigrants in the U.S.? Urban Studies, 39(11), 1983-2003.
Frey, W. (2015). Diversity Explosion: How New Racial Demographics are Remaking America. Washington, DC: Brookings Institution Press.
Gelatt, J., Bernstein, H., and Koball, H. (2015). Uniting the Patchwork: Measuring State and Local Immigrant Contexts. Washington DC: Urban Institute.
Goodwin-White, J. (2015). Is Social Mobility Spatial? Characteristics of Immigrant Metros and Second Generation Outcomes: 1940-1970 and 1970-2000. California Center for Population Research On-Line Working Paper Series. Available: http://papers.ccpr.ucla.edu/papers/PWP-CCPR-2015-001/PWP-CCPR-2015-001.pdf [September 2015].
Gouveia, L., Carranza, M.A., and Cogua, J. (2005). The Great Plains migration: Mexicanos and Latinos in Nebraska. In V. Zúñiga and R. Hernández-León (Eds.), New Destinations: Mexican Immigration in the United States (pp. 23-49). New York: Russell Sage Foundation.
Gozdziak, E.M., and Bump, M.N. (2004). Poultry, apples, and new immigrants in the rural communities of the Shenandoah Valley: An ethnographic case study. International Migration, 42(1), 149-164.
Green, P.E. (2003). The undocumented: Educating the children of migrant workers in America. Bilingual Research Journal, 27(1), 51-71.
Grieco, E.M., Trevelyan, E., Larsen, L., Acosta, Y.D., Gambino, C., de la Cruz, P., Gryn, T., and Walters, N. (2012). The Size, Place of Birth, and Geographic Distribution of the Foreign-Born Population in the United States: 1960 to 2010. Working Paper No. 96. Washington, DC: U.S. Census Bureau, Population Division.
Griffith, D.C. (2005). Rural industry and Mexican immigration and settlement in North Carolina. In V. Zúñiga and R. Hernández-León (Eds.), New Destinations: Mexican Immigration in the United States (pp. 50-75). New York: Russell Sage Foundation.
Hall, M. (2013). Residential integration on the new frontier: Immigrant segregation in established and new destinations. Demography, 50(5), 1873-1896.
Hall, M., and Crowder, K. (2014). Native out-migration and neighborhood immigration in new destinations. Demography, 51(6), 2179-2202.
Hall, M., and Stringfield, J. (2014). Undocumented migration and the residential segregation of Mexicans in new destinations. Social Science Research, 47(1), 61-78.
Holloway, S., Wright, R., and Ellis, M. (2012). The racially fragmented city? Neighborhood racial segregation and diversity jointly considered. The Professional Geographer, 63(4), 1-20.
Humes, K.R., Jones, N.A., and Ramirez, R.R. (2011). Overview of Race and Hispanic Origin: 2010. 2010 Census Briefs. Washington, DC: U.S. Census Bureau. Available: http://www.census.gov/prod/cen2010/briefs/c2010br-02.pdf [August 2015].
Iceland, J., and Nelson, K. A. (2008). Hispanic segregation in metropolitan America: Exploring the multiple forms of spatial assimilation. American Sociological Review, 73(5), 741-765.
Iceland, J., and Scopilliti, M. (2008). Immigrant residential segregation in U.S. metropolitan areas, 1990–2000. Demography, 45(1), 79-94.
Jang, W., and Yao, X. (2014). Tracking ethnically divided commuting patterns over time: A case study of Atlanta. The Professional Geographer, 66(2), 274-283.
Johnson, K.M., and Lichter, D.T. (2008). Natural increase: A new source of population growth in emerging Hispanic destinations in the United States. Population and Development Review, 34(2), 327-346.
Johnson, K.M., and Lichter, D.T. (2010). Growing diversity among America’s children and youth: Spatial and temporal dimensions. Population and Development Review, 36(1), 151-176.
Johnson, K.M., and Lichter, D.T. (2012). Rural natural increase in the new century: America’s third demographic transition. In International Handbook of Rural Demography (pp. 17-34). Dordrecht, Netherlands: Springer.
Kandel, W. (2008). Profile of Hired Farmworkers: A 2008 Update. ERS Report EER-60. Washington, DC: U.S. Department of Agriculture, Economic Research Service. Available: http://www.ers.usda.gov/publications/err-economic-research-report/err60.aspx [August 2015].
Kandel, W., and Cromartie, J. (2004). New Patterns of Hispanic Settlement in Rural America. Washington, DC: U.S. Department Agriculture, Economic Research Service.
Kandel, W., and Parrado, E.A. (2005). Restructuring of the U.S. meat processing industry and new Hispanic migrant destinations. Population and Development Review, 31(3), 447-471.
Kasnitz, P., Mollenkopf, J.H., Waters, M.C., and Holdaway, J. (2009). Inheriting the City: The Children of Immigrants Come of Age. New York: Russell Sage Foundation.
Kneebone, E., and Berube, A. (2013). Confronting Suburban Poverty in America. Washington, DC: Brookings Institution Press.
Kritz, M.M., and Gurak, D.T. (2015). U.S. immigrants in dispersed and traditional settlements: National origin heterogeneity. International Migration Review, 49(1), 106-141.
Lee, B.A., Iceland, J., and Farrell, C.R. (2014). Is ethno-racial residential integration on the rise? Evidence for metropolitan and micropolitan America since 1980. In J. Logan (Ed.), Diversity and Disparities: America Enters a New Century (pp. 415-456). New York: Russell Sage Foundation. Available: https://www.russellsage.org/sites/all/files/logan/logan_diversity_chapter13.pdf [July 2015].
Lichter, D.T. (2012). Immigration and the new racial diversity in rural America. Rural Sociology, 77(1), 3-35.
Lichter, D.T., and Johnson, K. M. (2009). Immigrant Gateways and Hispanic Migration to New Destinations1. International Migration Review, 43(3), 496-518.
Lichter, D.T., Parisi, D., Taquino, M.C., and Grice, S.M. (2010). Residential segregation in new Hispanic destinations: Cities, suburbs, and rural communities compared. Social Science Research, 39(2), 215-230.
Lichter, D.T., Parisi, D., and Taquino, M.C. (2015). Spatial assimilation in U.S. cities and communities? Emerging patterns of Hispanic segregation from blacks and whites. The ANNALS of the American Academy of Political and Social Science, 660(1), 36-56.
Light, I. (2008). Deflecting Immigration. New York: Russell Sage Foundation.
Liu, C.Y. (2009). Ethnic enclave residence, employment, and commuting of Latino workers. Journal of Policy Analysis and Management, 28(4), 600-625.
Lofstrom, M., Bohn, S., and Raphael, S. (2011). Lessons from the 2007 Legal Arizona Workers Act. San Francisco: Public Policy Institute of California.
Logan, J.R., and Zhang, C. (2010). Global neighborhoods: New pathways to diversity and separation. American Journal of Sociology, 115(4), 1069-1109.
Logan, J.R., Stults, B.J., and Farley, R. (2004). Segregation of minorities in the metropolis: Two decades of change. Demography, 41(1), 1-22.
Maldonado, M.M. (2014). Latino incorporation and racialized border politics in the Heartland: Interior enforcement and policeability in an English-only state. American Behavioral Scientist, 58(14), 1927-1945.
Marrow, H.B. (2011). New Destination Dreaming: Immigration, Race, and Legal Status in the Rural American South. Stanford, CA: Stanford University Press.
Massey, D.S. (2008). New Faces in New Places: The Changing Geography of American Immigration. New York: Russell Sage Foundation.
Massey, D.S., and Capoferro, C. (2008). The geographic diversification of American immigration. In D.S. Massey (Ed.), New Faces in New Places: The Changing Geography of American Immigration (pp. 25-50). New York: Russell Sage Foundation.
Massey, D.S., and Tannen, J. (2015). A research note on trends in black hypersegregation. Demography, 52, 1025-1034.
Massey, D.S., Rothwell, J., and Domina, T. (2009). The changing bases of segregation in the United States. The ANNALS of the American Academy of Political and Social Science, 626, 74-90.
McKenzie, B.S. (2013). Neighborhood access to transit by race, ethnicity, and poverty in Portland, Oregon. City & Community, 12(2), 134-155.
Nevins, J. (2007). Dying for a cup of coffee? Migrant deaths in US Mexico border region in a neoliberal age. Geopolitics, 12(2), 228-247.
Nevins, J. (2010). Operation Gatekeeper and Beyond: The War On “Illegals” and the Remaking of the U.S. New York: Routledge.
Painter, G., Liu, C. Yang, and Zhuang, D. (2007). Immigrants and the spatial mismatch hypothesis: Employment outcomes among immigrant youth in Los Angeles. Urban Studies, 44(13), 2627-2649.
Parisi, D., Lichter, D.T., and Taquino, M.C. (2011). Multi-scale residential segregation: Black exceptionalism and America’s changing color line. Social Forces, 89(3), 829-852.
Parrado, E.A., and Kandel, W. (2008). New Hispanic migrant destinations: A tale of two industries. In D.S. Massey (Ed.), New Faces in New Places: The Changing Geography of American Immigration (pp. 99-123). New York: Russell Sage Foundation.
Perreira, K.M., Mullan Harris, K., and Lee, D. (2006). Making it in America: High school completion by immigrant and native youth. Demography, 43(3), 511-536.
Potochnick, S. (2014). The academic adaptation of children of immigrants in new and established settlement states: The role of family, schools, and neighborhoods. Population Research and Policy Review, 33(3), 335-364.
Ramakrishnan, S.K., and Gulasekaram, P. (2014). Understanding Immigration Federalism in the United States. Washington, DC: Center for American Progress.
Ramakrishnan, S.K., and Wong, T. (2007). Immigration Policies Go Local: The Varying Responses of Local Governments to Undocumented Immigration. Unpublished paper, University of California, Riverside.
Ray, B. (2003). The role of cities in immigrant integration. Migration Information Source (feature article, October). Available: http://www.migrationpolicy.org/article/role-cities-immigrant-integration [September 2015].
Rosenblum, M. (2015). Understanding the Potential Impact of Executive Action on Immigration Enforcement. Washington DC: Migration Policy Institute.
Roth, B.J., Gonzales, R.G., and Lesniewski, J (2015). Building a stronger safety net: Local organizations and the challenges of serving immigrants in the suburbs. Human Service Organizations: Management, Leadership & Governance, 39(4), 348-361.
Rothwell, J., and Massey, D.S. (2009). The effect of density zoning on racial segregation in U.S. urban areas. Urban Affairs Review, 44, 799-806.
Rothwell, J., and Massey, D.S. (2010). Density zoning and class segregation in U.S. metropolitan areas. Social Science Quarterly, 91(5), 1123-1143.
Rugh, J.S. (2015). Double jeopardy: Why Latinos were hit hardest by the U.S. foreclosure crisis. Social Forces, 93(3), 1139-1184.
Rugh, J.S., and Massey, D.S. (2014). Segregation in post-civil rights America: Stalled integration or end of the segregated century? DuBois Review: Social Science Research on Race, 11(2), 205-232.
Saiz, A., and Wachter, S. (2011). Immigration and the neighborhood. American Economic Journal: Economic Policy, 3(2), 169-188.
Singer, A. (2013). Contemporary immigrant gateways in historical perspective. Daedalus, 142(3), 76-91.
Singer, A., and Wilson, J.H. (2006). From “There” to “Here”: Refugee Resettlement in Metropolitan America. Washington, DC: Brookings Metropolitan Policy Program.
Singer, A., Hardwick, S., and Brettell, C. (2008). Suburban Immigrant Gateways: Immigration and Incorporation in New U.S. Metropolitan Destinations. Washington, DC: Brookings Institution Press.
Southern Poverty Law Center. (2010). Injustice on Our Plates. SPLC Report. Montgomery, AL: Author. Available: https://www.splcenter.org/20101108/injustice-our-plates [August 2015.]
Stamps, K., and Bohon, S.A. (2006). Educational attainment in new and established Latino metropolitan destinations. Social Science Quarterly, 87(5), 1225-1240.
Suro, R., Wilson, J.H., and Singer, A. (2011). Immigration and Poverty in America’s Suburbs. Washington, DC: Brookings Metropolitan Policy Program.
Turner, M.A., Ross, S., Galster, G.C., and Yinger, J. (2002). Discrimination in Metropolitan Housing Markets: National Results from Phase 1 of the Housing Discrimination Study (HDS). Submitted to U.S. Department of Housing and Urban Development. Available: http://www.huduser.gov/portal/Publications/pdf/Phase1_Report.pdf [September 2015].
Turner, R.N. (2014). Occupational stratification of Hispanics, whites, and blacks in Southern rural destinations: A quantitative analysis. Population Research and Policy Review, 33(5), 717-746.
U.S. Census Bureau. (1993). 1990 Census of Population: Social and Economic Characteristics, Minnesota. Washington, DC: U.S. Department of Commerce Economics and Statistics Administration.
Varsanyi, M.W. (2008). Immigration policing through the backdoor: City ordinances, the “right to the city,” and the exclusion of undocumented day laborers. Urban Geography, 29(1), 29-52.
Varsanyi, M.W. (2010). Taking Local Control: Immigration Policy Activism in U.S. Cities and States. Stanford, CA: Stanford University Press.
Varsanyi, M.W., Lewis, P.G., Provine, D.M., and Decker, S. (2012). A multilayered jurisdictional patchwork: Immigration federalism in the United States. Law & Policy, 34, 138-158.
Walker, K.E. (2015). The spatiality of local immigration policies in the United States. Tijdschrift voor Economische en Sociale Geografie, 106(4), 486-498.
Walker, K.E., and Leitner, H. (2011). The variegated landscape of local immigration policies in the U.S. Urban Geography, 32, 156-178.
Waters, M.C., and Jiménez, T.R. (2005). Assessing immigrant assimilation: New empirical and theoretical challenges. Annual Review of Sociology, 105-125.
Waters, M.C., Kasnitz, P., and Asad, A. (2014). Immigrants and African Americans. Annual Review of Sociology, 40, 369-390.
Wilson, J.H., and Habecker, S. (2008). The lure of the capital city: An anthro-geographical analysis of recent African immigration to Washington, D.C. Population, Space, and Place, 14, 433-448.
Wilson, J.H., and Singer, A. (2011). Immigrants in 2010 Metropolitan America: A Decade of Change. Washington, DC: Brookings Institution Press.
Wilson, J.H., and Svaljenka, N.P. (2014). Immigrants Continue to Disperse, with Fastest Growth in the Suburbs. Washington, DC: Brookings Institution Press. Available: http://www.brookings.edu/research/papers/2014/10/29-immigrants-disperse-suburbs-wilson-svajlenka [July 2015].
Wright, R., Ellis, M., and Parks, V. (2005). Re-placing whiteness in spatial assimilation research. City and Community, 4(2), 111-135.
Wright, R., Ellis, M., Holloway, S., and Wong, S. (2013). Patterns of racial segregation and diversity in the United States: 1990-2010. The Professional Geographer, 66(2), 173-182.
Xie, Y., and Gough, M. (2011). Ethnic enclaves and the earnings of immigrants. Demography, 48(4), 1293-1315.
Yu, Z., and Myers, D. (2007). Convergence or divergence in Los Angeles: Three distinctive ethnic patterns of immigrant residential assimilation. Social Science Research, 36(1), 254-285.
Zhou, M. (2009). Contemporary Chinese America: Immigration, Ethnicity, and Community Transformation. Philadelphia, PA: Temple University Press.
Zhou, M., and Kim, K. (2006). Community forces, social capital, and educational achievement: The case of supplementary education in the Chinese and Korean immigrant communities. Harvard Educational Review, 76(1), 1-29.
Zhou, M., Lee, J., Vallejo, J. A., Tafoya-Estrada, R., and Sao Xiong, Y. (2008). Success attained, deterred, and denied: Divergent pathways to social mobility in Los Angeles’s new second generation. The ANNALS of the American Academy of Political and Social Science, 620(1), 37-61.
Zuniga, V., and Hernández-León, R. (2006). New Destinations: Mexican Immigration in the United States. New York: Russell Sage Foundation.
This page intentionally left blank.


