
1
Introduction
The United States is a country that has been populated, built, and transformed by successive waves of migration from almost every part of the world. This reality is widely recognized in the familiar image of the United States as a “nation of immigrants” and by the great majority of Americans, who fondly trace their family histories to Asia, Africa, or Europe or to a mix of origins that often includes an ancestry from one or more of the many indigenous peoples of the Americas. The American national mosaic is one of long standing. In the 18th century, Jean de Crèvecoeur (1981 [1782]) observed that in America, “individuals of all nations are melted into a new race of men.” More than two centuries later, the American experiment of E Pluribus Unum continues with one of the most generous immigration policies in the world, one that includes provisions for diversity, refugees, family reunification, and workers who bring scarce employment skills. The United States is home to almost one-fifth of the world’s international migrants, including 23 million who arrived from 1990 to 2013 (United Nations Population Division, 2013). This figure (23 million net immigrants) is three times larger than the number of immigrants received by any other country during that period.
The successful integration of immigrants and their children contributes to the nation’s economic vitality and its vibrant and ever-changing culture. The United States has offered opportunities to immigrants and their children to better themselves and to be fully incorporated into this society; in exchange “immigrants” have become “Americans”—embracing an American identity and citizenship, protecting the United States through service in
its military, building its cities, harvesting its crops, and enriching everything from the nation’s cuisine to its universities, music, and art.
This has not always been a smooth process, and Americans have sometimes failed to live up to ideals of full inclusion and equality of opportunity for immigrants. Many descendants of immigrants who are fully integrated into U.S. society remember the success of their immigrant parents and grandparents but forget the resistance they encountered—the riots where Italians were killed, the branding of the Irish as criminals who were taken away in “paddy wagons,” the anti-Semitism that targeted Jewish immigrants, the racist denial of citizenship to Chinese immigrants, and the shameful internment of Japanese American citizens. This historical amnesia contributes to the tendency to celebrate the nation’s success in integrating past immigrants and to worry that somehow the most recent immigrants will not integrate and instead pose a threat to American society and civic life.
2015 was the 50th anniversary of the passage in 1965 of the Hart Celler Act, which amended the Immigration and Nationality Act of 1952 (INA) and began the most recent period of mass immigration to the United States. These amendments abolished the restrictive quota system of the 1920s and opened up legal immigration to all countries in the world, setting the stage for a dramatic increase in immigration from Asia and Africa. At the same time, they limited the numbers of legal immigrants permitted from countries in the Western Hemisphere, establishing restrictions on immigrants across the U.S. southern border and setting the stage for the rise in undocumented border crossers.
Today, the approximately 41 million immigrants in the United States represent 13.1 percent of the U.S. population, which is slightly lower than it was 100 years ago. An estimated 11.3 million of these immigrants—over 25 percent—are undocumented. The U.S.-born children of immigrants, the second generation (see Box 1-1), represent another 37.1 million people, 12 percent of the population. Together, the first and second generations account for one of every four members of the U.S. population.
The numbers of immigrants coming to the United States, the racial and ethnic diversity of new immigrants, and the complex and politically fraught issue of undocumented immigrants have raised questions about whether the nation is being as successful in absorbing current immigrants and their descendants as it has been in the past. Are new immigrants and their children being well integrated into American society? Do current policies and practices facilitate their integration? How is American society being transformed by the millions of immigrants who have arrived in recent decades?
To address these issues, the Panel on the Integration of Immigrants into American Society was tasked with responding to the following questions:
- What has been the demographic impact of immigration, in terms of the size and age, sex, and racial/ethnic composition of the U.S. population from 1970 to 2010? What are the likely changes in the future?
- What have been the effects of recent immigration on the educational outcomes, employment, and earnings of the native-born population?1
- How has the social and spatial mobility of immigrants and the second generation changed over the last 45 years?
___________________
1 The native-born population includes the second and third generation descendants of foreign-born immigrants. For more information about how the panel uses “generations” in this report, see Box 1-1.
- How has the residential integration (or segregation) of immigrants and their descendants changed over the last 45 years? How has immigration affected residential segregation patterns within native-born racial and ethnic communities?
- How rapidly are recent immigrants and their descendants integrating into American society, as measured by competency in English language, educational attainment, rate of naturalization, degree of intermarriage, maintenance of ethnic identity, health outcomes, and other dimensions?
- How has immigration affected American institutions, including civil society, and economic and political organizations? What role do mediating institutions play in the integration process? How responsive are these institutions to the needs of immigrants and their descendants?
- How has immigration affected the stock and growth of scientific and technological skills in universities, research organizations, and private businesses? Is it possible to measure the impact of immigration on the pace of technological change and innovation?
- What are the general attitudes and public perceptions of native-born Americans toward (a) legal and illegal immigration and (b) how immigrants shape American society? How do these perceptions compare with the statistical record?
- How does legal status affect immigrants’ and their descendants’ ability to integrate across various dimensions?
- For each of these questions, how do outcomes vary by gender, race and ethnicity, social class, geography, and other social categories?
- What additional data are needed for research on the role and impact of immigration on American society?
In the sections below, the panel sets up the context for answering these questions. First, we lay out the definition of integration we will use throughout the report. Second, we address the question of demographic changes in the United States since 1970. Third, we discuss demographic projections for the U.S. population based on current and predicted immigration trends. Fourth, we examine native-born attitudes toward immigration and immigrants themselves. Finally, we discuss the implications of these conditions for immigrant integration. The final section outlines the rest of the report.
INTEGRATION
“Integration”2 is the term the panel uses to describe the changes that both immigrants and their descendants—and the society they have joined—undergo in response to migration. The panel defines integration as the process by which members of immigrant groups and host societies come to resemble one another (Brown and Bean, 2006). That process, which has both economic and sociocultural dimensions, begins with the immigrant generation and continues through the second generation and beyond (Brown and Bean, 2006). The process of integration depends upon the participation of immigrants and their descendants in major social institutions such as schools and the labor market, as well as their social acceptance by other Americans (Alba et al., 2012). Greater integration implies parity of critical life chances with the native-born American majority. This would include reductions in differences between immigrants or their descendants vis-a-vis the general population of native-born over time in indicators such as socioeconomic inequality, residential segregation, and political participation and representation. Used in this way, the term “integration” has gained near-universal acceptance in the international literature on the position of immigrants and their descendants within the society receiving them, during the contemporary era of mass international migration.
Integration is a two-fold process: it happens both because immigrants experience change once they arrive and because native-born Americans change in response to immigration. The process of integration takes time, and the panel considers the process in two ways: for the first generation, by examining what happens in the time since arrival; for the second and third generations—the children and grandchildren of immigrants—by comparisons across generations.
Integration may make immigrants and their children better off and in a better position to fully contribute to their communities, which is no doubt a major objective for the immigrants themselves. If immigrants come to the United States with very little education and become more like native-born Americans by getting more education, one would say they are more integrated. And they would also probably be viewed as being better off, because more education improves their well-being. But immigrants also, on average, come to the United States with better health than native-born Americans. As they become more like native-born Americans they become less healthy. They become more integrated and their well-being declines. So, to the extent that available data allow, the panel measured two separate
___________________
2 “Assimilation” is another term widely used for the processes of incorporation of immigrants and their children and the decline of ethnic distinctions in equality of opportunity and life chances. For this report, “integration” is used as a synonym for “assimilation” as defined by Alba and Nee (2003).
dimensions of change: integration and well-being. The first asks whether immigrants and the native-born become more like one another; the second asks whether immigrants are better or worse off over time.
This report investigates whether immigrants and their children are becoming more like the general population of native-born Americans across a wide range of indicators: attitudes toward social issues, citizenship, crime, education, family structure, health, income, language, occupations, political participation, religion, and residence. Of course this is a complicated process to measure, in part because immigrants are very diverse themselves and have very different starting points in all of these domains when they arrive and because immigrants change at different paces across domains and individuals, but also because Americans are also changing. The convergence between immigrants and later generation Americans may happen because immigrants change once they get here, because native-born Americans change in response to immigration, or both. There is no presumption that change is happening in one direction only.
Indeed, bidirectional change is often easier to see in hindsight than in real time. Looking back, one can now see how the absorption of immigrants in the 19th and 20th centuries changed American culture. Many foods, celebrations, and artistic forms considered quintessentially American today originated in immigrant homelands. Current immigrants continue to contribute to the vibrancy and innovation of American culture as artists, engineers, and entrepeneurs. One-fourth of the American Nobel Prize winners since 2004, and a similar proportion of MacArthur “Genius” Awardees (which are given to people in a range of fields including the arts) have been immigrants to the United States. The foreign-born (see Box 1-2) are also overrepresented among authors of highly cited scientific papers and holders of patents (Smith and Edmonston, 1997, p. 385; Chellaraj et al., 2008; Stephan and Levin, 2001, 2007; Hunt and Gauthier-Loiselle, 2010; Kerr, 2008). To the extent that one can document changes among the native-born in the 21st century due to immigration, the panel attempts to do so, but we also suspect that many of the changes happening right now will only be visible to future historians as they look back.
Examining integration involves assessing the extent to which different groups, across generations or over time within the same generation, come to approximate the status of the general native-born population. Equality between immigrants and the native-born should not be expected in the first generation because immigrants have different background characteristics: they are younger, their education may not have been in American schools, and they may initially lack proficiency in English. But one can measure progress toward that equality among immigrants and their descendants. To measure equality of opportunity between the native-born and immigrant generations, the report employs conditional probabilities and other means to measure the likelihood of outcomes net of prior characteristics. (For in-
stance, does an immigrant from China with a college degree earn as much as a native-born white with a college degree?) These conditional probabilities are typically estimated for different generations of an immigrant-origin group, with statistical controls for differences from the general native-born population in demographic characteristics and skill levels.
DEMOGRAPHIC CHANGES IN THE FOREIGN-BORN POPULATION SINCE 1970
The demographic make-up of the United States in the early 21st century is incredibly diverse compared to mid-20th century America. In many ways, the composition of the contemporary United States is more similar to the polyglot nation of the early 20th century, when major waves of immigrants were drawn by greater economic and political opportunities in the United States than were available in their countries of origin. The desire for religious freedom, flight from persecution, and family ties are also important factors spurring migration (Massey, 1999; Portes and Rumbaut, 2014; Grasmuck and Pessar, 1991). Today as in the past, nearly one in seven Americans is foreign-born. But today’s immigrants are more likely to come from Latin America or Asia than from Europe, are more likely to be female, are much less likely to be white, and are more geographically dispersed than the immigrants who arrived at the turn of the 20th century. Meanwhile, the development of federal immigration law since that era (discussed in Chapter 2) has led to the rapid growth of an undocumented-immigrant population whose experiences differ from immigrants with legal status in fundamental ways (see Chapter 3).
In this section, the panel reviews the demographic changes among the foreign-born since 1970. We discuss both flows and stocks of immigrants. Flows are the numbers of arrivals and departures each year or in a designated period (e.g., decades). Stock refers to the number of foreign-born in the population at a point in time, usually based on counts in the census or other surveys such as the Current Population Survey. Both flows and stocks have measurement problems. For example, flows of immigrants as measured by administrative data of the U.S. Citizenship and Immigration Services of the Department of Homeland Security include only those immigrants who lawfully enter the United States with a visa of some kind, either permanent or temporary. The panel had less information on how many people leave the United States. Another substantial problem is that these flow data do not count those who enter without inspection, as undocumented immigrants. The stock data are based on the foreign-born as measured in censuses and surveys, but they include anyone residing in the United States, including those who do not plan to stay and do not consider themselves immigrants. Nevertheless, stock and flow data do provide different but complementary perspectives on the composition of the foreign-born population. Flow data represent the recent history of immigration. Stock data provide a snapshot of the current and future composition of the foreign-born.
The next section begins by discussing the rapid growth of immigration in recent decades and then examines the ways in which these immigrants
are different from previous waves of immigrants, how they differ from the native-born, and how they are changing the overall demographics of the United States.
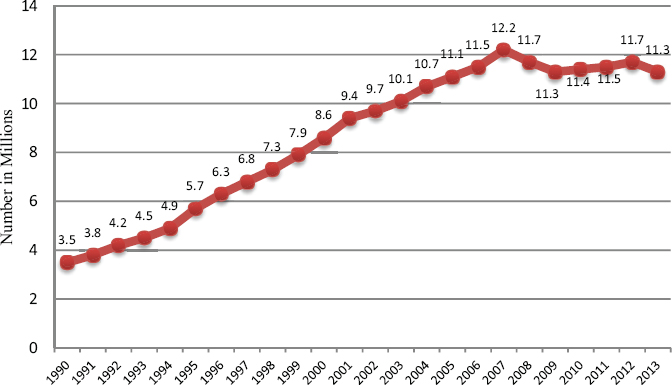
In the 50 years since the 1965 amendments to the INA passed, the demographics of immigration—and in consequence, the demographics of the United States—have changed dramatically. Before that law passed, the number of Americans who were foreign-born had declined steadily, shrinking from over 14 million in 1930 to less than 10 million in 1970 (see Figure 1-1). As a share of the total population, the foreign-born peaked at almost 15 percent at the turn of the 20th century and declined to less than 5 percent in 1970. After 1970, the number of foreign-born increased rapidly, doubling by 1990 to 19.9 million and doubling again by 2007 to 40.5 million.
Since the beginning of the Great Recession in 2007, net immigration to the United States appears to have plateaued and undocumented immigra-
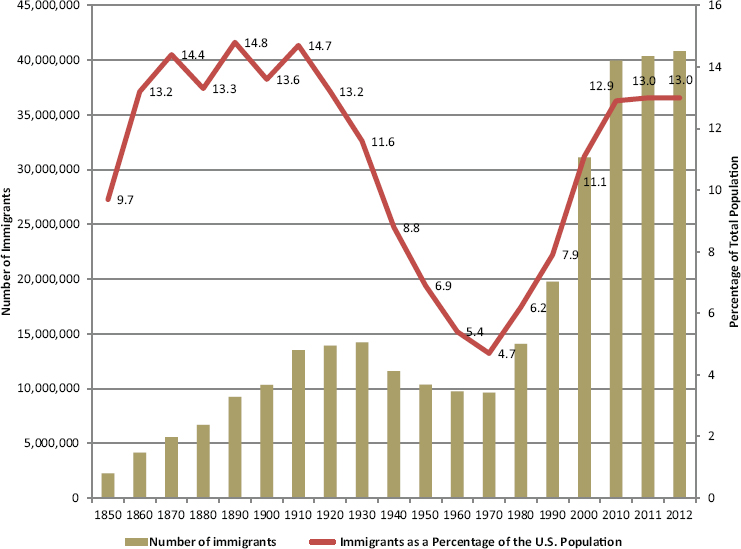
SOURCE: Original figure based on U.S. Census Bureau data.
tion appears to have declined, at least temporarily. In 2012, there were 41.7 million foreign-born in the United States, a relatively small 5-year increase compared to the rapid growth over the previous two decades. Today, 13 percent of the U.S. population is foreign-born, a proportion that is actually slightly lower than it was 100 years ago (Figure 1-1).
Regions and Countries of Origin
The vast majority of immigrants in 1900 arrived from Europe; today, the majority come from Latin America and Asia. In 1960, over 60 percent of immigrants were from Europe (see Figure 1-2), and the top five countries of birth among the foreign-born were Canada, Germany, Italy, Poland, and the United Kingdom.3 By 1970, Europeans comprised less than 50 percent of the foreign-born, and that percentage declined rapidly in the following decades. Meanwhile the share of foreign-born from Latin America and Asia has grown rapidly. Forty-four percent of the foreign-born in the United States in 2011 were from Latin America, and 28.6 percent were from Asian countries. The top five countries of birth among the foreign-born in 2010 were China, India, Mexico, the Philippines, and Vietnam. And while immigration from Africa is proportionately much smaller, the number of immigrants from that continent has also increased steadily since 1970.
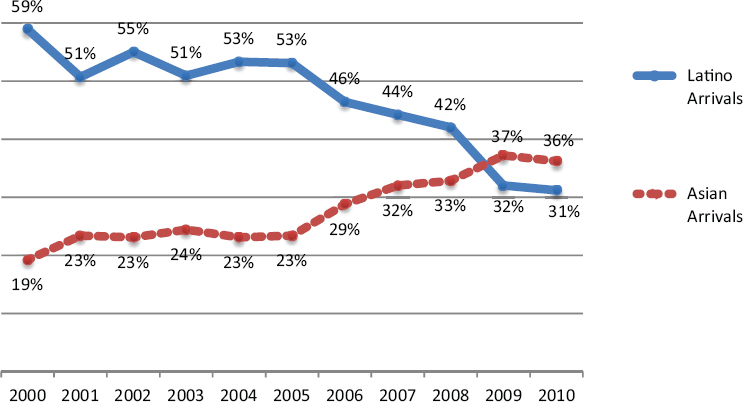
Mexican immigration has been the driver for the dramatic growth in migration from Latin America since 1970. Today, almost one-third of the foreign-born are from Mexico (see Figure 1-3). Immigration from other parts of Latin America also increased: since 1990, the number of Central American immigrants in the United States has nearly tripled (Stoney and Batalova, 2013). However, a major demographic shift in migration flows is occurring as Mexican immigration, in particular, has slowed and Asian immigration has increased. Between 2008 and 2009, Asian arrivals began to outpace immigration from Latin America; and in 2010, 36 percent of immigrants arrived from Asian countries, versus 31 percent from Latin America (see Figure 1-4). In 2013, China replaced Mexico as the top sending country for immigrants to the United States (Jensen, 2015).
Race and Ethnicity
The United States has a long history of counting and classifying its population by race and ethnicity, beginning with the first Decennial Census in 1790 (Prewitt, 2013). However, the categories of race and their interpretation have changed over time—in no small part due to immigration and the absorption of people from different parts of the world. The meaning of
___________________
3 See https://www.census.gov/how/pdf//Foreign-Born--50-Years-Growth.pdf [September 2015].
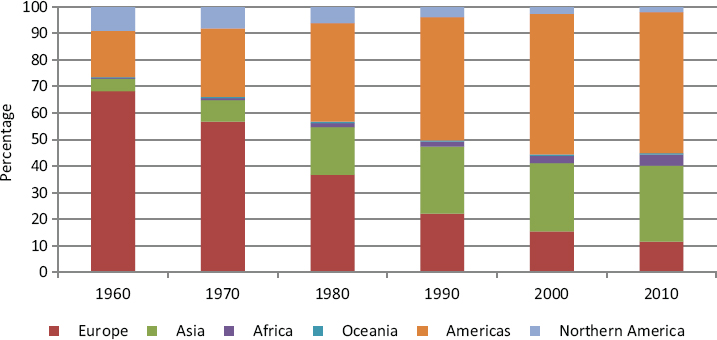
SOURCE: Original figure based on U.S. Census Bureau data.
SOURCE: Data are from Jeffrey Passel (Pew Research Center) presentation to the Panel on the Integration of Immigrants into American Society on January 16, 2014.
SOURCE: Data are from Jeffrey Passel (Pew Research Center) presentation to the Panel on the Integration of Immigrants into American Society on January 16, 2014.
the term “race” itself has also changed. At the height of immigration from Europe, different national-origin groups such as the Irish, Poles, and Italians were considered “races” in popular understanding and by many social scientists, although these beliefs were not formalized in the official census classifications (Snipp, 2003; Perez and Hirschman, 2009).
This report uses the federal (as defined by the Office of Management and Budget) race and ethnic categories, with Hispanics as an independent category alongside the major race groups (see Box 1-3). The panel uses the terms “race and ethnicity” and “ethnoracial categories” to refer to this classification scheme. For example, we report on the ethnoracial categories—white non-Hispanic, black non-Hispanic, Asian non-Hispanic, American Indian non-Hispanic, and Hispanic—when we are reporting on race and ethnic characteristics of the population. We use the terms “Hispanic” and “Latino” interchangeably to refer to the same group, as these terms are used to varying degrees in different parts of the country or are preferred by different individuals.
The racial and ethnic categorizations of the population are a good example of how immigration changes American society and American society changes immigrants. Census and survey data on race and ethnicity are based on the subjective identities (self-reports) of respondents who complete written forms or respond to interviewer questions, and respondents are free to check any listed category or to write in any group identity that
is not listed. Many immigrants remark that they learn their “official” ethnoracial identity soon after they arrive and are asked about it constantly: on government forms, when they register their children for school, on employment applications, etc. Many come to understand and identify with a racial or ethnic category that was often unfamiliar or meaningless before they immigrated. Black immigrants from Africa or the Caribbean had not thought of themselves as African Americans before immigrating to the United States, and the category “Asian” is often new to many people who had thought of themselves as Chinese or Pakistani before their arrival. In this sense, one can speak of people being “racialized” as they come to the United States. They may also face racial discrimination, based on neither their identity as immigrants nor their national origin identity but rather on their new “racial identity.”
The shift from European to Latin American and Asian migration has also significantly changed the racial and ethnic make-up of the United States (see Figures 1-5 and 1-6). In 1970, 83 percent of Americans were non-Hispanic white; today, that proportion is 62.4 percent. In 1970, Lati-
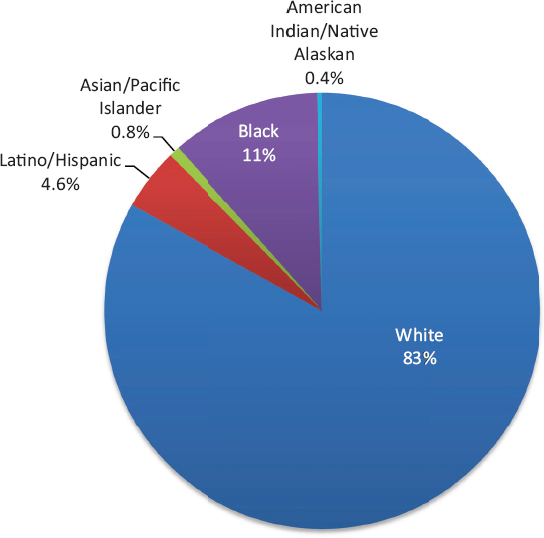
SOURCE: Data from U.S. Census Bureau Decennial Census, 1970. Also see Gibson and Jung (2002).
nos were approximately 4.6 percent of the total U.S. population.4 In 2013, Latinos made up 17 percent of the U.S. population, with foreign-born Latinos accounting for 6 percent of the population, or about one-third of all Latinos.5 Since 2000, the native-born Latino population grew at a faster rate than the foreign-born because of both a decline in migration from Mexico and an increasing number of native-born children of Latino immigrants. Overall, Latino population growth between 2000 and 2010 accounted for more than half of the nation’s population growth (Passel et al., 2011).
Asians, meanwhile, have become the fastest-growing racial group in
___________________
4 The 1970 Decennial Census marked the Bureau’s first attempt to collect data for the entire Hispanic/Latino population. However, there were problems with data collection. For further discussion, see http://www.pewsocialtrends.org/2010/03/03/census-history-countinghispanics-2/ [September 2015].
5 See http://www.pewhispanic.org/2014/04/29/statistical-portrait-of-hispanics-in-the-unitedstates-2012/, Table 1 [September 2015].
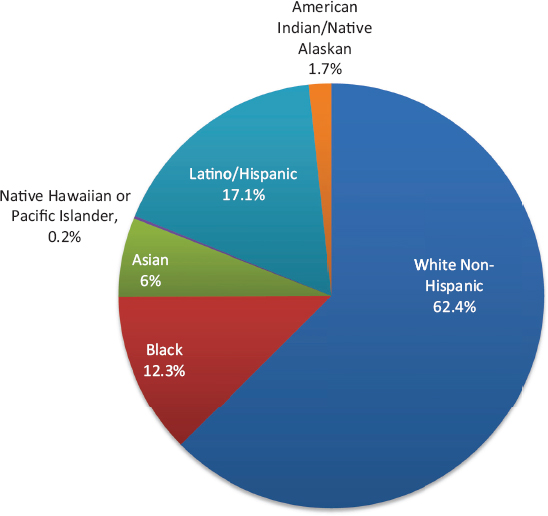
SOURCE: Data from American Community Survey, 2013. Available: http://www.census.gov/acs/www/ [October 2015].
the United States (Passel, 2013). In 1970 Asians accounted for less than 1 percent of the U.S. population, a reflection of long-term discriminatory regulations that banned most Asian immigration (see Chapter 2). In 2010, they made up almost 6 percent of the U.S. population, and 74 percent of them were foreign-born (Passel, 2013).
The proportion of foreign-born among blacks in the United States is much smaller: only 9 percent in 2013. However, the number of black immigrants has increased steadily since 1970,6 and immigrants accounted for at least 20 percent of the growth of the black population between 2000 and 2006 (Kent, 2007).
Overall, racial and ethnic minorities accounted for 91.7 percent of the nation’s population growth between 2000 and 2010 (Passel et al., 2011). Non-Hispanic whites are now a minority of all births, while fertility rates for Latinos, in particular, remain relatively high (Monte and Ellis, 2014).7 Today, there are four states where the majority of the population
___________________
6 See http://www.census.gov/newsroom/press-releases/2014/cb14-184.html [September 2015].
7 See https://www.census.gov/newsroom/press-releases/2015/cb15-113.html [September 2015].
is “minority”—California, Hawaii, New Mexico, and Texas—plus the District of Columbia (Desilver, 2015). It is not a coincidence that most of these states also have large immigrant populations. As discussed further below, the United States will be even more racially and ethnically diverse in the future, due to immigration, intermarriage, and fertility trends.
Age
The foreign-born population is now much younger than it was 50 years ago (Grieco et al., 2012).8 The median age for the foreign-born declined dramatically after the 1965 amendments to the INA, dropping from 51.8 years in 1970 to 39.9 in 1980.9 Before 1970, over half of all foreign-born in the United States were over the age of 50 (see Figure 1-7) and the foreign-born were mostly European immigrants who arrived during the earlier wave at the turn of the 20th century. By 2000, only 20 percent were in this age category, while 70 percent were between the ages of 18 and 54. However, after bottoming out at 37.2 years in 1990, the median age of the foreign-born began to creep upward as the proportion under the age of 18 declined. In 2012, the median age of the foreign-born was 41.4 years, compared to 35.9 years among the native-born.10,11
Part of the explanation for the higher median age of the foreign-born is the large number of second generation Americans under the age of 18, which pulls down the median age of the native-born (see Figure 1-8). The vast majority of immigrants are of child-bearing age, and immigrants generally have higher fertility rates than the native-born (see Figure 1-9). In 2013, 37.1 million Americans, or about 12 percent of the population, were members of the second generation, and one-fourth of all children in the United States (17.4 million) had at least one foreign-born parent.12 This has particular significance for the future racial and ethnic composition of the country because so many of the second generation are racial and ethnic minorities. The panel discusses the implications of this increasing diversity
___________________
8 The median age for foreign-born from Mexico and Central America is the lowest at 38, while the median age for foreign-born from the Caribbean is the highest at 47. See http://www.pewhispanic.org/2013/01/29/statistical-portrait-of-the-foreign-born-population-in-the-unitedstates-2011/ [September 2015].
9 See http://www.census.gov/content/dam/Census/library/working-papers/2012/demo/POPtwps0096.pdf [September 2015].
10 See http://www.migrationpolicy.org/article/frequently-requested-statistics-immigrants-and-immigration-united-states [September 2015].
11 Since the children of immigrants born in the United States count as native-born, and the majority of those immigrating are adults, the median age for immigrants is generally higher than it is for the native-born.
12 See https://www.census.gov/population/foreign/files/cps2010/T4.2010.pdf [September 2015].
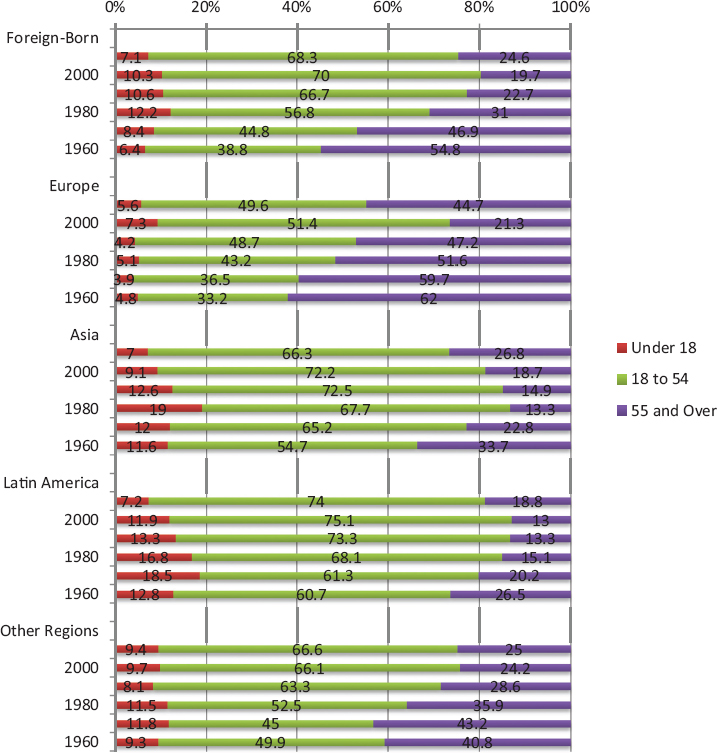
SOURCE: Data from U.S. Census Bureau Decennial Census 1960-2000 and American Community Survey, 2010. Also see Grieco et al. (2012).
among the native-born in the population projections below and in the chapters that follow.
Gender
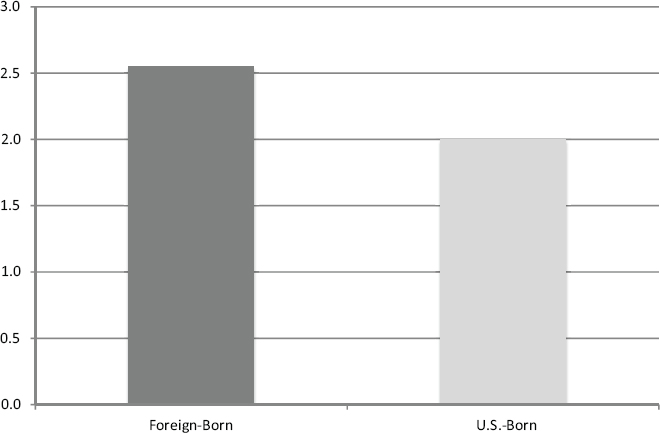
The gender ratio for the foreign-born is generally balanced, with 101 males for every 100 females (see Table 1-1).13 The native-born population, on the other hand, skews toward more females, with a gender ratio of 95
___________________
13 See http://www.migrationpolicy.org/article/sex-ratios-foreign-born-united-states [September 2015].
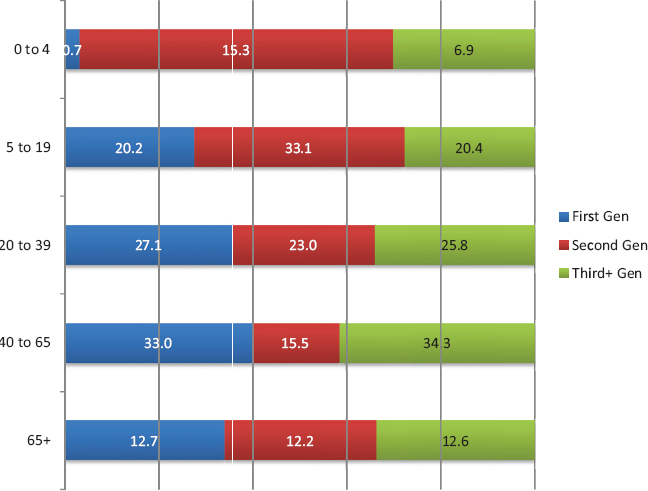
SOURCE: Data from Current Population Survey, 2010. Available: https://www.census.gov/population/foreign/files/cps2010/T4.2010.pdf [October 2015].
SOURCE: Data from 2008-2012 American Community Survey.
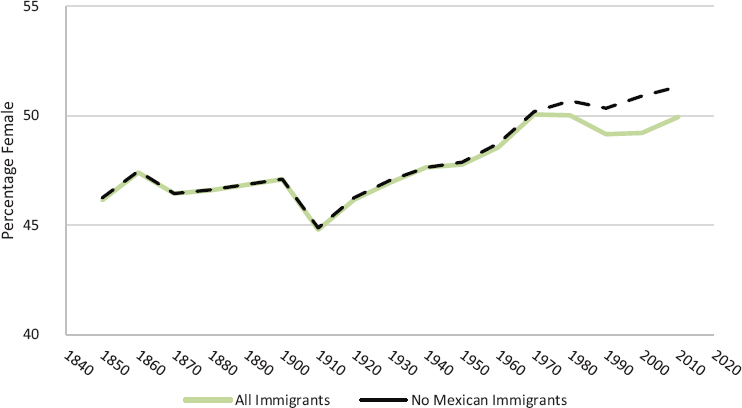
males per 100 females. As the ratios by age in Table-1-1 show, these ratios vary by age because women live longer than men and because the age structure of migrants is concentrated in the young-adult working ages. Thus, a better measure is to examine gender ratios that have been age standardized. Donato and Gabaccia (2015, p. 154) created age-standardized gender ratios for the years 1850-2010, and these are plotted in Figure 1-10.
Gender ratios for all of the foreign-born have varied over time, with the percentage of women among immigrants growing. The gender composition among immigrants shifted from male dominated toward gender balanced in the 1930s and was gender balanced by the 1970s. Unstandardized rates show women at above 50 percent of the stock of immigrants beginning in 1970; standardized rates indicate a gender balanced stock where women comprise about 50 percent of the foreign-born after 1970 (Donato et.al., 2011).
As Donato and colleagues (2011, 2015) point out, because Mexicans are such a large percentage of recent immigrant flows after 1970 and because they are a much more male-dominated migration stream, it is useful to separate the gender ratio for all immigrants from the gender ratio for Mexican migrants (Figure 1-10). The lines diverge beginning in 1970 when men were predominant among the Mexican foreign-born, whereas among the rest of the foreign-born women’s share continued to grow. By 2010 the percentage of females was 50 percent for all the foreign-born in the United States and was slightly higher at 51 percent when Mexicans are excluded.
Nonetheless, the gender ratios for specific source countries vary widely. India (138 males per 100 females) and Mexico (124 per 100) have male-to-female gender ratios well above the median, as do El Salvador (110 males per 100 females) and Haiti (109 per 100). Germany (64 males per 100 females), South Korea (65 per 100), the Dominican Republic (68 per 100), the Philippines (71 per 100), and Japan (74 per 100) all have much lower ratios of males to females, indicating that more females than males may be immigrating from those countries but also reflecting the age structures of the different immigrant populations (older populations in source countries such as Germany and Japan will reflect the demographic that women live longer than men in those countries).
The gender-balanced immigrant population of today reflects a complex mix of factors including shifts in labor demand, civil strife around the world leading to more refugees, and increased state regulation of migration (Donato and Gabaccia, 2015, p. 178; Oishi, 2005). Many women immigrate and work. No matter how they enter—on a family preference visa, as a close relative exempt from numerical limitations, without legal documents, or with an H-1B or other employment worker visa—most are employed in the United States after entering and are therefore meeting market demands for labor. The increasing percentage of women among immigrants
TABLE 1-1 Male to Female Ratio among Immigrants to the United States, 1870-2000
| Males per 100 Females among U.S. Immigrants | ||||||||||||||
|---|---|---|---|---|---|---|---|---|---|---|---|---|---|---|
| 1870 | 1880 | 1890 | 1900 | 1910 | 1920 | 1930 | 1940 | 1950 | 1960 | 1970 | 1980 | 1990 | 2000 | |
| Total | 117.4 | 119.1 | 121.2 | 119.5 | 131.1 | 122.9 | 116.6 | 111.8 | 103.3 | 95.6 | 84.4 | 87.8 | 95.8 | 99.0 |
| Under 15 years | 103.5 | 102.0 | 103.1 | 101.9 | 102.2 | 102.0 | 102.0 | 102.1 | 104.1 | 102.5 | 102.7 | 104.7 | 106.0 | 104.6 |
| 15 to 64 years | 119.1 | 117.5 | 120.8 | 121.7 | 133.9 | 124.7 | 117.3 | 112.7 | 103.7 | 92.9 | 83.8 | 91.9 | 101.6 | 103.9 |
| 15 to 44 years | 114.3 | 115.7 | 122.5 | 121.8 | 137.2 | 123.3 | 114.6 | 99.5 | 89.4 | 83.5 | 80.8 | 97.6 | 109.6 | 110.2 |
| 15 to 24 years | 101.5 | 102.2 | 104.1 | 98.3 | 126.6 | 97.0 | 96.4 | 93.9 | 82.5 | 86.2 | 88.1 | 110.2 | 121.9 | 121.3 |
| 25 to 44 years | 119.3 | 120.2 | 130.5 | 131.0 | 141.3 | 130.5 | 118.5 | 100.1 | 90.5 | 82.7 | 78.4 | 92.5 | 105.6 | 106.9 |
| 45 to 64 years | 134.7 | 121.2 | 117.2 | 121.4 | 126.5 | 127.4 | 121.4 | 123.0 | 111.3 | 99.7 | 87.8 | 80.4 | 83.3 | 89.9 |
| 65 years and older | 111.4 | 109.8 | 112.2 | 108.5 | 105.3 | 104.7 | 107.7 | 104.9 | 102.3 | 100.0 | 82.4 | 69.7 | 64.1 | 65.6 |
SOURCE: Data from U.S. Census Bureau Decennial Census. Also see Gibson and Jung (2006), Hobbs and Stoops (2002), and Ruggles et al. (2010).
SOURCE: Donato and Gabaccia (2015). Reprinted with permission.
thus reflects a much stronger demand for labor in a variety of occupations such as domestic service, child care, health care, factory assembly work, and food processing/production. The gender imbalance in deportations may also contribute to the feminization of Latino immigration, in particular (Mexican Migration Monitor, 2012). The increase in human trafficking in the United States and globally also contributes to the feminization of immigration (Pettman, 1996).
Geographic Dispersal
A key component of the story of recent immigration is the significant geographic dispersal of immigrants across the United States. Historically, immigrants tended to cluster in a handful of traditional gateway cities or states, such as California, Illinois, New York, and Texas. Although these states are still the most popular destinations and have the largest numbers of foreign-born, recent years have seen immigration to states that had not previously witnessed a large influx of foreign-born. The panel discusses this geographic dispersal in further detail in Chapter 5, but we highlight some of the most important trends here.
Six states—California, Florida, Illinois, New Jersey, New York, and Texas—attract the largest proportion of the foreign-born, but that share has
declined in recent years, from 73 percent in 1990 to 64 percent in 2012.14 The states with the fastest growth in immigrants today are in the South and West: Alabama, Arkansas, Georgia, Kentucky, Nebraska, Nevada, North Carolina, South Carolina, Tennessee, Utah, and Virginia. Although the numbers in many of these states are still relatively small, some saw more than 400 percent growth in their foreign-born population since 1990. The rapid growth of immigration in the South and Midwest and in the Mountain States has been dramatic in the last few decades. Many of these receiving communities were either all white or contained a mix of black and white residents but had virtually no Latino or Asian residents. The sudden influx of Latino and Asian immigrants, many of whom are undocumented, has challenged long-established racial and social hierarchies, has posed new problems for school systems who had not previously dealt with children in need of instruction in English as a second language, and sometimes has led to negative attitudes and anti-immigrant backlash. Other communities, particularly declining rural areas, have welcomed the new influx as a way to revitalize small communities that were experiencing long-term population decline.
Immigration has also broadened from traditional gateway cities, such as Chicago, Los Angeles, and New York City, to other metropolitan areas—including Atlanta, Dallas, Las Vegas, and Washington, D.C. Many immigrants to these metro areas are finding homes in the suburbs.15 And while overall immigration to rural areas is relatively small, some rural counties have witnessed a surge in Latino immigration, particularly in places where meat processing plants are major employers.16 This influx of immigrants has created new challenges for communities and local institutions that have not previously had to create or maintain integrative services (see Chapter 5).
Education
The European immigrants who arrived at the turn of the 20th century had less formal schooling than the native-born; on average, immigrants from southern, eastern, and central Europe had a little more than 4 years of education versus 8 years for the native-born (Perlmann, 2005). Rates of illiteracy in 1910 were less than 10 percent among immigrants from northwestern Europe and about 20 to 50 percent among immigrants from eastern and southern Europe (Lieberson, 1963, pp. 72-73). By 1920, with rising educational levels
___________________
14 Data are from Jeffrey Passel, Pew Research Center, presentation to the Panel on the Integration of Immigrants into American Society on January 16, 2014.
15 See http://www.migrationpolicy.org/article/twenty-first-century-gateways-immigrants-suburban-america [August 2015].
16 See http://www.ers.usda.gov/topics/in-the-news/immigration-and-the-rural-workforce.aspx#Foreign [August 2015].
SOURCE: Data from American Community Survey, 2013, 1-year estimates. Available: http://www.census.gov/acs/www/ [October 2015].
in Europe and the imposition of a literacy test in 1917, illiteracy was generally less than 2 to 3 percent for most immigrant streams from all European countries. The educational attainment of the second generation from European immigration generally matched the larger native-born population, demonstrating large strides in just one generation (Perlmann, 2005).
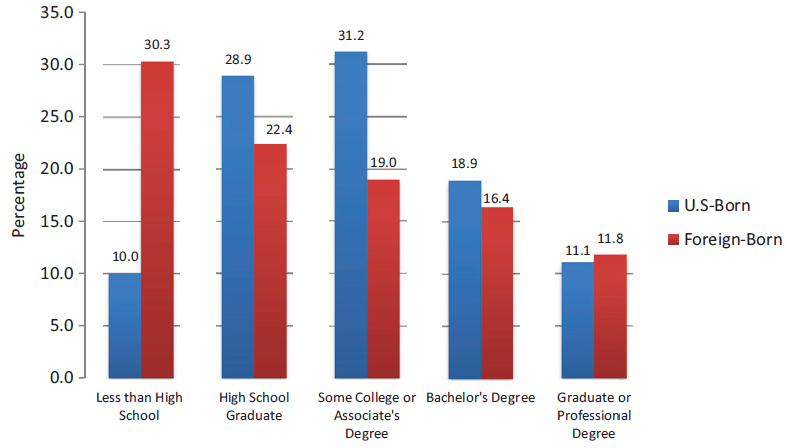
Since 1970, although immigrants’ education level has increased, either before arrival or after they have reached the United States, immigrants are still overrepresented among the least educated: 31.7 percent have less than a high school degree, compared to 11 percent of the native-born.17 However, the educational attainment of immigrants has risen since 1980 (Hall et al., 2011). In 2013, 28 percent had a bachelor’s degree or higher, and a slightly higher proportion of immigrants than native-born had advanced degrees (see Figure 1-11). Meanwhile the largest proportion of the foreign-born are actually in the middle range of educational achievement: more than 40 percent have a high school diploma and/or some college.
Educational attainment varies a great deal in relation to immigrants’ regions of origin. Despite some national variations, Asians and Europeans are generally as highly educated or more highly educated than native-born Americans. Almost 50 percent of the foreign-born from Asia and 39.1 percent from Europe have a bachelor’s degree or higher, versus 27.9 percent of the U.S.-born population. But only 12.3 percent of Latin American immigrants have a bachelor’s degree, and immigrants from Mexico and
___________________
17 See http://www.census.gov/prod/2012pubs/acs-19.pdf [May 2015].
Central America, in particular, are much more likely to have very low levels of education. However, there is evidence that second generation Latinos make great strides in education, despite their parents’ relatively low socioeconomic status. The panel discusses this further in Chapter 6.
Income
In addition to lower levels of education, European immigrants at the turn of the last century also earned less than their native-born counterparts (Perlmann, 2005). Immigrants from southern, eastern, and central Europe in particular tended to work in low-skilled jobs where wages were particularly low. However, wage inequalities between immigrants and the native-born declined over time, and the second generation nearly closed the wage gap, earning within 10 percent of the children of native-born Americans (Perlmann, 2005).
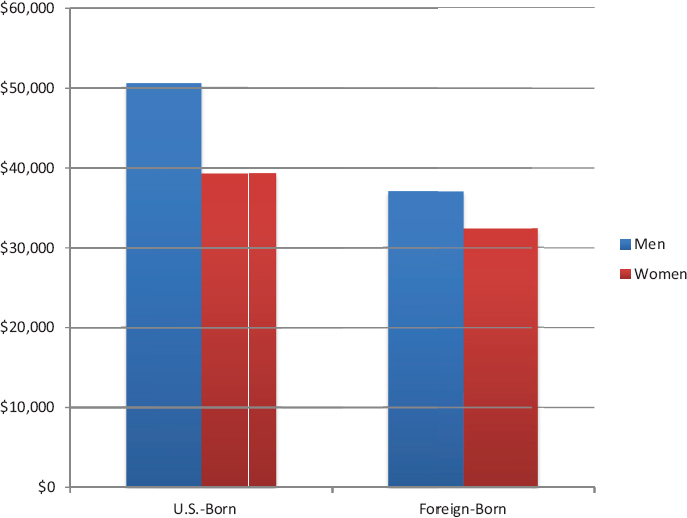
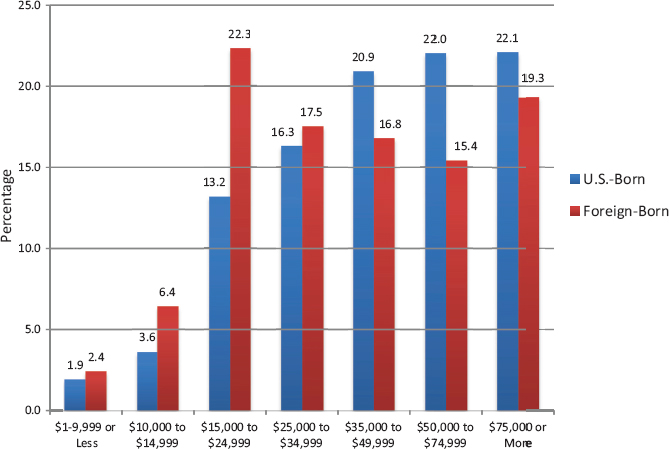
A similar pattern of intergenerational change over time occurs in earnings and household income when one examines changes between the first and second generation (see Chapter 6). Among the present-day first generation, the earnings of foreign-born workers are still generally lower than earnings of the native-born, and the gap is particularly large for men. The median income for full-time, year-round, native-born male workers is $50,534, compared to just $36,960 for foreign-born men (for comparisons for both men and women, see Figure 1-12). The income gap for foreign-born versus native-born is wider for men than for women. Nearly one-third of the foreign-born make less than $25,000 per year, compared to 19 percent of the native-born, and although almost 20 percent of immigrants make over $75,000, the native-born outpace them in every income category above $35,000 (see Figure 1-13).
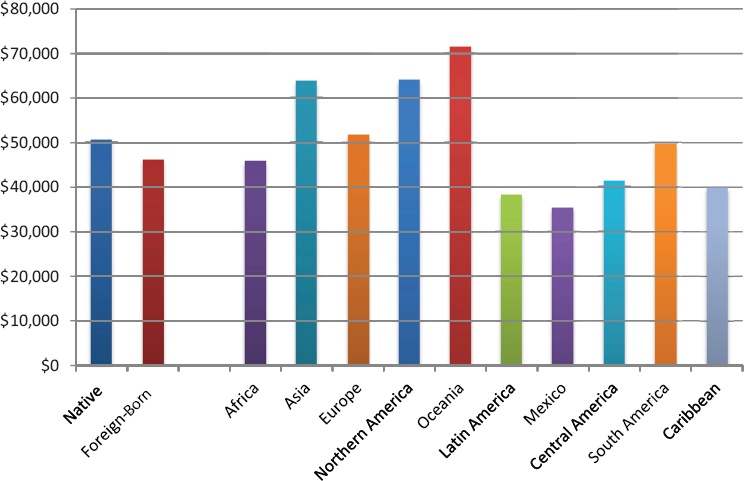
Not surprisingly, native-born head of households also have higher incomes than those headed by the foreign-born. Overall, the average household income of the foreign-born was $48,137 in 2013, compared to $53,997 in native-born households. However, as with education, there is variation based on immigrants’ region of origin. As Figure 1-14 shows, the median household incomes for immigrants from Asia, Canada, Europe, and Oceania (the region including Australia, Fiji, and New Zealand) are higher than native-born median household income, while the median immigrant household from Latin America had a much lower income than the median native-born household. Part of the explanation for this variation is the bimodal nature of the labor market and different immigrant groups’ representation in particular types of occupations, as described below.
SOURCE: Data from American Community Survey, 2013, 1-year estimates. Available: http://www.census.gov/acs/www/ [October 2015].
SOURCE: Data from American Community Survey, 2013, 1-year estimates. Available: http://www.census.gov/acs/www/ [October 2015].
SOURCE: Data from American Community Survey, 2010. Available: http://www.census.gov/prod/2012pubs/acs-19.pdf [October 2015].
Occupation
A common perception of immigrant labor force participation is the concentration of immigrants in occupational niches. In fact, immigrants do not dominate in any single occupation, although there is geographical variation in the extent to which they are represented among agricultural workers, for instance, or health care workers. There are important variations by region of origin, however. Asian immigrants, particularly those from China and India, are overrepresented in professional occupations, including those in health care, engineering, and information technology. Immigrants from Latin America, meanwhile, are more concentrated in lower-skilled, lower-paying occupations in construction and in the service and retail industries (see Chapter 6 for further discussion).
Poverty
In recent decades, as immigration has been high, the U.S. poverty rate has also been stubbornly high. Rising income inequality and the declining wages of those with low education since the 1970s likely hit immigrants and their families particularly hard, as they are overrepresented among
lower-educated workers. Unlike earlier European immigrants and their descendants, who benefited from the decline in income inequality and the growth in wages among those at the bottom of the labor market in the period beginning in the 1930s, current immigrants are entering a U.S. economy that sees declining fortunes at the bottom of the income distribution. Real wages for those without a college degree have fallen 26 percent since 1970, and for males without a high school degree they have fallen a remarkable 38 percent (Greenstone and Looney, 2011). Chapter 6 discusses intergenerational trends in poverty, which do show some progress over time. However, this progress begins at a low level, as the foreign-born are more likely than the native-born to be poor.
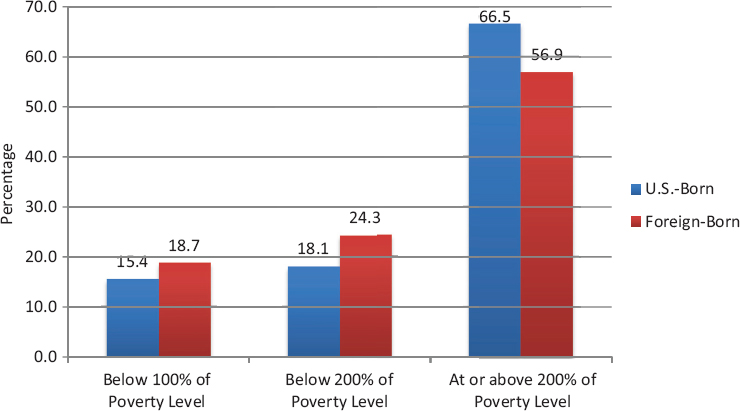
The poverty rate for immigrants is a cause for particular concern because many immigrants are barred from participation in social welfare programs that aid the impoverished. As Figure 1-15 illustrates, 18.7 percent of the foreign-born are impoverished, compared to 15.4 percent of the native-born, a difference of just over 3 percentage points, while the proportion of immigrants living within 200 percent of the poverty level is 6 percentage points higher than it is for the native-born. Considering that the poverty threshold for a family of four is $23,850 and 30 percent of immigrants make less than $25,000 a year, the higher proportion of immigrant households at or near poverty is unsurprising.
The differences in houshold income distribution relative to the poverty
SOURCE: Data from American Community Survey, 2013, 1-year estimates. Available: http://www.census.gov/acs/www/ [October 2015].
SOURCE: Data from American Community Survey, 2013, 1-year estimates. Available: http://www.census.gov/acs/www/ [October 2015].
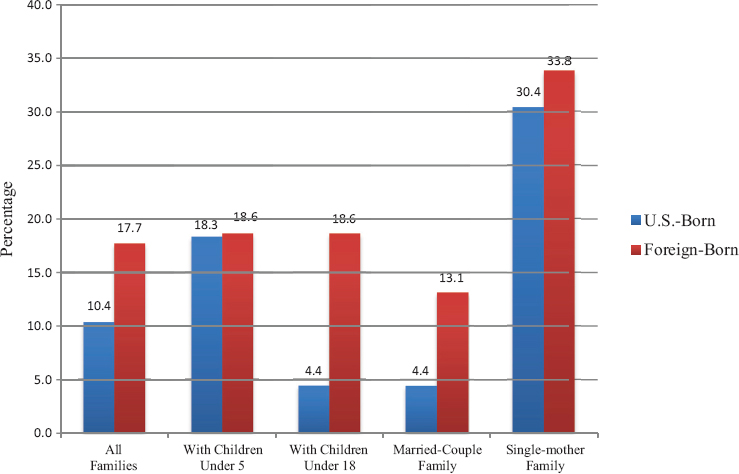
level becomes even more alarming for families with children. While 1 in 10 native-born families are impoverished, almost 18 percent of foreign-born families live below the poverty level (see Figure 1-16). The differences are particularly stark for families in which a married couple has children. Only 4.4 percent of native-born families with two parents are impoverished, but over 13 percent of foreign-born two-parent families live in poverty. This means a much larger proportion of children of foreign-born parents are living in poverty, even in cases where there is an intact household and both parents may be working. Although many of these children are U.S. citizens themselves, and some social welfare programs for children are available regardless of nativity (e.g., the Women, Infants, and Children Supplemental Nutrition Program of the Food and Nutrition Service; free and reduced school meals), the fact that their parents are often prevented from accessing social welfare programs makes these families’ financial situations even more precarious (Yoshikawa, 2011).
Legal Status
A key finding in this report is the importance of legal status and its impact on immigrants’ integration prospects. Although some distinctions
in status existed in the past, the complicated system of statuses that exists today is unprecedented in U.S. history.
As discussed in detail in Chapter 2, an unintended consequence of the 1965 amendments to the INA and the immigration legislation that followed was to dramatically increase both legal and undocumented immigration to the United States. In response, rather than initiating overarching reform, the federal government has been reactive, creating piecemeal changes that grant certain groups or persons in specific situations various legal statuses. Some of these statuses provide clear pathways to lawful permanent residence and citizenship, but many are explicitly designed to be temporary and discourage permanent settlement in the United States. Meanwhile, federal, state, and local legislation has increasingly used legal status as a dividing line between those who can access various social services and those who are excluded from portions of the social safety net.
Chapter 3 outlines the current major legal statuses and examines how these statuses may aid or hinder immigrant integration. Legal status provides a continuum of integrative potential, with naturalized citizenship at one end and undocumented status at the other. However, many immigrants move back and forth along that continuum, gaining or losing statuses during the course of their residence in the United States. And despite the inherent uncertainty of temporary or undocumented statuses, it is important to understand that as long as immigrants reside in the United States, regardless of their legal status, immigrants are starting families, sending their children to schools, working in the labor market, paying taxes, attending churches, and participating in civic organizations. They interact on a daily basis across a variety of social environments with the native-born population. In effect, they are integrating into American society and culture.
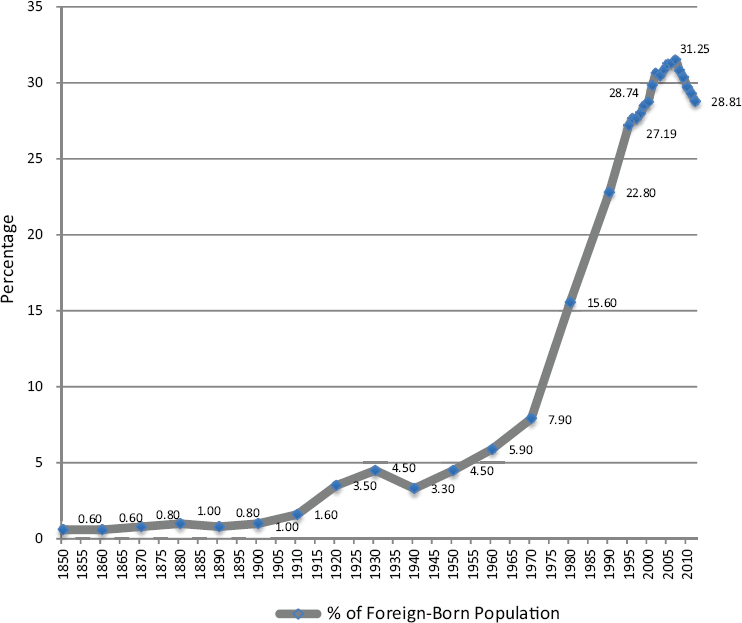
Particularly important to the discussion of legal status and immigrant integration is the undocumented population. Between 1990 and 2007, the number of undocumented immigrants in the United States tripled (see Figure 1-17). Although unauthorized immigration declined somewhat after 2007 in response to the Great Recession, there are currently an estimated 11.3 million undocumented immigrants living in the United States (Passel et al., 2014). As noted above, this situation is unprecedented because, during the last great wave of immigration, there were relatively few obstacles to entry. The social and legal challenges facing undocumented immigrants create significant barriers to integration, a consequence discussed in detail in Chapter 3 and referred to throughout this report.
DEMOGRAPHIC PROJECTIONS
The increase in immigration since 1970 has its primary impact on the growth of the foreign-born population. But immigration also has secondary
SOURCE: Data are from Jeffrey Passel (Pew Research Center) presentation to the Panel on the Integration of Immigrants into American Society on January 16, 2014. Also see Passel et al. (2014).
effects through the children and subsequent descendant of the foreign-born. The children of immigrants (or the second generation) are native-born and are American citizens at birth but can be considered as part of the broadly defined immigrant community. The second generation is generally reared within the culture and community of their immigrant parents, and their first language is often their parents’ mother tongue, even as they usually make great strides in integrating into the American mainstream.
In 1970, the second generation population was about twice the size of the foreign-born population—almost 24 million. The large second generation population in the 1960s and 1970s was the product of the early 20th century immigrant wave from eastern and southern Europe. Almost all were adults and many were elderly. By the first decade of the 21st century, there was a new second generation population: the children of the post-1965 wave of immigrants from Latin America and Asia. Currently about one-quarter of all U.S. children are first generation or second generation immigrants.
Recent immigrants and their descendants will continue to affect the demography of the United States for many years to come. In late 2014 and early 2015, the U.S. Census Bureau released a new update of population projections from 2015 to 2060, with a primary emphasis on the impact
of immigration on population growth, composition, and diversity (U.S. Census Bureau 2014a; Colby and Ortman, 2015). Historically, projections of net immigration to the United States were little more than conjectures based on recent trends and ad hoc assumptions. In recent years, the Census Bureau has adopted a new methodology based on a predictive model of future emigration rates from major sending countries and regions, informed by recent trends in immigration (U.S. Census Bureau, 2014b).
The Census Bureau projects that the number of foreign-born persons residing in the United States will increase from just over 41 million to more than 78 million between 2013 and 2060, with their population share rising from 13.1 percent to 18.8 percent (see Figure 1-18). Although the Census Bureau projects a slowing trend in the relative growth rate of the foreign-born population (from more than 2% to less than 1%) and a decline in absolute numbers of immigrants per year (from over 900,000 to less than 600,000), most of the growth of the U.S. population in the coming decades will be due to immigration, including both the increase from the immigrants themselves and the increase from their higher fertility rates. Fertility-related increase is projected to decline even faster as the population ages, and much of the projected natural increase of the native-born population is also due
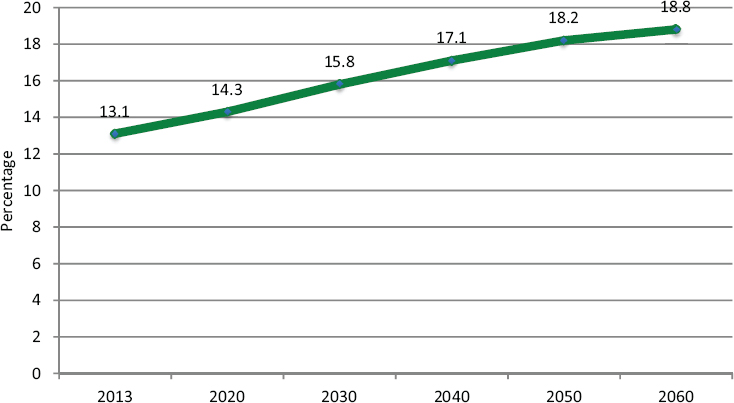
SOURCE: Data from U.S. Census Bureau, 2014 Population Projections. Available: http://www.census.gov/population/projections/data/national/2014/summarytables.html [October 2015].
to immigration. The Census Bureau projects that over 20 percent of the births in the United States between now and 2060 will be to foreign-born mothers (Colby and Ortman, 2015). Without new immigrants and their children, the United States is projected to experience population decline in the coming years.
The most controversial aspects of the new population projections are the impact of immigration on population diversity and the prediction that the U.S. population will become a majority minority population; that is, non-Hispanic whites will be less than half of the total population by the middle of the 21st century (Colby and Ortman, 2015, Table 2). However, a significant share of this change is due to the changes in the measurement of race and ethnicity in recent years.
There is little doubt that the massive wave of immigration of recent decades has changed the composition of the American population. In 2010, almost 15 million Americans claimed an Asian American identity and over 50 million reported themselves to be Hispanic (Humes et al., 2011). These numbers and future projections must be understood in light of a complex system of measurement of race and ethnicity in federal statistics, discussed above. As noted earlier, Hispanic ethnicity is measured on a separate census/survey question from race, so Hispanics may be of any race. In 2010, more than half (53%) of Hispanics reported that they were “white” on the race question, a little more than a third (36.7%) chose “Some Other Race” (many wrote in a Latin American national origin), and 6 percent chose multiracial (mostly “Some Other Race” and “white”). Multiple race reporting was only 2 to 3 percent in the 2000 and 2010 censuses, but it is projected to increase in the coming decades, perhaps to 6 percent, or 26 million Americans, in 2060 (Colby and Ortman, 2015, Table 2).
The Census Bureau projects that 28.6 percent of Americans will be Hispanic in 2060, 14.3 to 17.9 percent will be black, 9.3 to 11.7 percent will be Asian, 1.3 to 2.4 percent will be American Indian or Alaskan Native, and 0.3 to 0.7 percent will be Native Hawaiian or Pacific Islander. The range of uncertainty in these projections depends on how persons who claim multiple racial identities (“race alone or in combination” in census terminology) are counted. “One race” non-Hispanic whites are projected to be 43.6 percent of all Americans in 2060 (Colby and Ortman 2015, Table 2). However, all whites (including Hispanic whites and all multiracial persons who checked “white”) are projected to be 74.3 percent of the American population in 2060 (Colby and Ortman 2015, Table 2).
It is impossible to predict the future ethnoracial population of the United States with numerical precision, but general trends are foreseeable. There will be more persons with diverse heritage, including a very large number of persons with ancestry from Latin America: likely more than a quarter of all Americans in 2060. Among the less predictable consequences
are whether these ancestral origins will be important in terms of language, culture, residential location, or choice of marital partners.
AMERICAN ATTITUDES ABOUT IMMIGRATION
An important but misunderstood component of immigrant integration is native-born attitudes toward immigration and immigrants. Immigration has been hotly debated in American elections and in the media, and based on these debates, one might think that Americans are deeply concerned with the issue and that many, perhaps even the majority, are opposed to immigration. Polling data suggest that this is not the case: most Americans assess immigration positively. Figure 1-19 shows the results of a poll question, asked from 2001 to 2014, on Americans’ overall assessment about whether “Immigration is a good thing or a bad thing for this country today.” In every year of the polling period, a majority of Americans say that immigration is a good thing, reaching a high of 72 percent in 2013 before falling to 63 percent in 2014.
Polling results also show that an increasing number of Americans (57% in 2005, up from 37% in 1993) think that immigrants contribute to the United States, and one-half feel that immigrants pay their fair share of taxes. Yet this is counterbalanced by the significant proportion, 42 percent, who think immigrants cost taxpayers too much (Segovia and Defever, 2010, pp. 380-381). The majority of Americans do not believe that recent immigrants take jobs away from U.S. citizens, and they believe that the jobs immigrants take are ones that Americans do not want (Segovia and Defever, 2010, p. 383). When asked specifically about immigration and whether
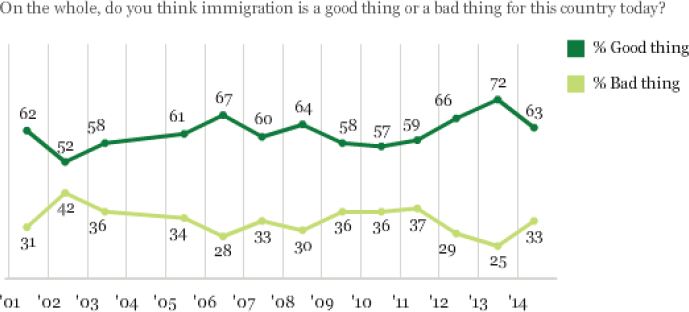
SOURCE: Saad (2014). Reprinted with permission.
illegal or legal immigration is a bigger problem, respondents in a 2006 Pew survey were much more likely to say that it was illegal immigration (60%) than legal immigration (4%), with 22 percent saying both were of equal importance and 11 percent saying neither (Pew Research Center, 2006; Segovia and Defever, 2010, p. 379).
Opinion polls since 1964 have asked questions to solicit respondents’ assessment of their ideal level of immigration (Segovia and Defever, 2010; Saad, 2014). For example, “Should immigration be kept at the present level, increased, or decreased?” These opinions do not necessarily match the actions that Congress takes. In 1964, for example, just before the passage of the 1965 Immigration Act that vastly increased immigration to the United States, almost one-half of respondents (48%) liked the present level of immigration and 38 percent wanted a reduction (Lapinski et al., 1997, pp. 360-361).
More recent polling data from 1999-2014 show that the dominant view of the public about the desired level of immigration is for a decrease, followed closely by maintaining it at current levels (Saad, 2014). However, support for increasing immigration levels has been rising over the last 15 years. There has been a doubling of the percentage who said that the level should be increased, from 10 percent in 1999 to 22 percent in 2014. Not surprisingly, immigrants are more favorable toward maintaining current levels of immigration than are the native-born. Only 17 percent of the foreign-born, compared to 60 percent of the native-born, told pollsters in 2014 that immigrant levels should be decreased. Urban residents and the highly educated are more supportive of expanding immigration than are those in rural areas and those with less than a college education. (Saad, 2014, p. 5).
While Americans have generally preferred to decrease the number of immigrants coming to the United States, they have also tended to resist mass deportation as the solution to the problem of unauthorized immigration. For example, in the CBS/New York Times Poll in 2006 and 2007, the proportion favoring legalization was consistent at around 62 percent,18 while the proportion favoring deportation was considerably lower, at around 33 percent.19 In later years, the New York Times Poll split the legalization option into two possibilities: for immigrants to either (1) stay in the United States and eventually apply for citizenship or (2) stay but not qualify for
___________________
18 Support for legalization was 62 percent in May 2006, 60 percent in March 2007, 61 percent in May 2007, and 65 percent in June 2007. See http://www.cbsnews.com/htdocs/pdf/poll_bush_050906.pdf, http://www.cbsnews.com/htdocs/pdf/052407_immigration.pdf, and http://www.cbsnews.com/htdocs/pdf/062807_immigration.pdf [September 2015].
19 Support for deportation was 33 percent in May 2006, 36 percent in March 2007, 35 percent and 28 percent in May 2007. Sources: CBS News Poll webpages cited in the preceding footnote.
citizenship.20 Less than a third of respondents preferred deportation over legalization, while nearly one-half supported legalization with a pathway to citizenship. Only about 19 percent favored legalization without the possibility of citizenship.
In general, most Americans do not think immigration is as important as many other issues facing the country. From 1994 to 2014, immigration is mentioned as the most important issue facing the country today by only about 1 percent to 3 percent of Americans. By contrast, the economy, unemployment, and health care consistently receive higher mentions.21 Even at times when immigration reform is very much in the news and high on legislators’ agenda; it is not the top issue for the vast majority of Americans.
Attitudes on immigration have recently become decoupled from strictly economic concerns. While restrictive attitudes on immigration tended to go up significantly during recessions and periods of high unemployment in the 1980s and 1990s (Lapinski et al., 1997), there is no clear relationship among aggregate economic output, unemployment, and immigration attitudes after 2001. Furthermore, observational and experimental studies of immigration opinion have found that personal economic circumstances bear little or no relationship to restrictive attitudes on immigration (Citrin et al., 1997; Hainmuller and Hiscox, 2010). There also is not a fixed relationship between local demographic composition and concentration of immigrants and attitudes toward immigrants. Rather, the broader political context (whether immigration is nationally salient and being widely debated and reported on) interacts with local demographics. Hopkins (2010) found that when immigration is nationally salient, a growing population of immigrants is associated with more restrictionist views, but demography does not predict attitudes when immigration is not nationally salient.
So even though immigration is rarely mentioned as an important policy issue by the American public, and despite consistent majority support for legalization of the undocumented, immigration remains a contentious topic. As past research has shown, this level of heightened attention and polarization on immigration is evident more among party activists than among the general electorate (Skocpol and Williamson, 2012; Parker and Barreto, 2014) and is often the result of agenda-setting and mobilization by key media personalities and political actors, rather than emerging from widespread popular sentiment (Hopkins, 2010; Gulasekaram and Ramakrishnan, 2015).
Concern about immigration is also fueled by misconceptions about
___________________
20 See http://s3.documentcloud.org/documents/1302290/sept14b-politics-trn.pdf [September 2015].
21 Panel’s analysis of Gallup toplines obtained from Roper Center Public Opinion Archives, University of Connecticut, see http://www.ropercenter.uconn.edu/ [September 2015].
immigrants and the process of integration. Americans have been found to overestimate the size of the nonwhite population (Wong, 2007), to erroneously believe that immigrants commit more crime than natives (Simes and Waters, 2013), and to worry that immigrants and their children are not learning English (Hopkins et al., 2014). A sense of cultural threat to national identity and culture, rooted in a worry about integration, therefore seems to underly many Americans’ worries about immigration (Hainmueller and Hopkins, 2014).
IMPLICATIONS
The United States has witnessed major changes in the demographic make-up of immigrants since 1970. Prior to the passage of the 1965 amendments to the INA, the majority of immigration to the United States originated from Europe. After 1965, the United States witnessed a surge of immigration from Latin America and Asia, creating a much more racially and ethnically diverse society. This new wave of immigration is more balanced in terms of gender ratios but varies in terms of skills and education, both from earlier immigration patterns and by region of origin. Immigrants are more geographically dispersed throughout the country than ever before. And since 1990 in particular, the United States has witnessed an enormous influx of undocumented immigrants, a legal category that was barely recognized 100 years ago.22
The demographic trends described above have broad implications for immigrant integration that cut across the various social dimensions discussed in this report. Just as in the past, American society is adjusting to the fact that a high proportion of the population is composed of immigrants and their descendants. But the differences between earlier waves of immigrants and more recent arrivals present new challenges to integration.
One key issue is the role of racial discrimination in the integration of immigrants and their descendants. Scholars debate how much racial and ethnic discrimination is directed toward immigrants and their children, whether immigration and the complexity it brings to our racial and ethnic classification system will ultimately lead to a blurring or hardening of the boundaries separating groups, what kinds of racial and ethnic distinctions that we see now will persist into the future, and what kinds will become less socially meaningful (for recent reviews, see Lee and Bean, 2012; Alba and Nee, 2009). Sometimes these questions are framed as a debate about
___________________
22 Many scholars have described Chinese immigrants who arrived after the Chinese Exclusion Act of 1882 as the first “illegal aliens.” Ngai (2004) describes the evolution of the term as having roots in the experiences of these Chinese immigrants and then being more broadly applied after the 1920s.
where the “color line” will be drawn in the 21st century. Will immigrants and their children who are Asian and Latino remain distinct, or will their relatively high intermarriage rates with whites lead to a blurring of the line separating the groups, similar in many ways to what happened to groups of European origin, who developed optional or voluntary ethnicities that no longer affect their life chances (Alba and Nee, 2003; Waters, 1990)? This debate also focuses on African Americans and the historically durable line separating them from whites, one enforced until recently by the legal prohibition on intermarriage between blacks and whites and the norm of the one-drop rule, which defined any racially mixed person as black (Lee and Bean, 2012).
There is evidence on both sides of this debate. High intermarriage rates of both Asians and Latinos with whites, as well as patterns of racial integration in some neighborhoods, point to possible future blurring of the boundaries separating these groups (see Chapter 8). The association between Latinos and undocumented immigration, however, may be leading to a pattern of heightened discrimination against Latinos. The negative framing of undocumented immigrants as illegal criminals, alien invaders, and terrorists, along with the conflation of undocumented and documented migrants in public discourse, contributes to the racialization of Latinos as a despised out-group. Discrimination against Hispanics may have been exacerbated by the criminalization of undocumented hiring and the imposition of employer sanctions under the Immigration Reform and Control Act of 1986, which encouraged employers either to avoid Latino immigrants who “looked Hispanic” (Lowell et al., 1995) or to pay lower wages to compensate themselves for the risk of hiring undocumented foreigners (Lowell and Jing 1994; Sorensen and Bean 1994; Fry et al., 1995; Cobb-Clark et al., 1995).
To the extent that immigrants today are racialized, they can be expected to be subject to systematic discrimination and exclusion, thus compromising their integration into U.S. society. Immigrants with darker skin earn significantly less than those with lighter skin in U.S. labor markets (Frank et al., 2010; Hersch, 2008; 2011). And stereotypical markers of Hispanic origin such as indigenous features and brown skin, have come to trigger discrimination and exclusion within American society (Chavez, 2008; Lee and Fiske, 2006; Massey, 2007, 2014; Massey and Denton, 1992; Massey and Sanchez, 2010; Turner et al., 2002).
Discrimination, skin color, and socioeconomic status may interact to particularly affect ethnoracial self-identification among Latin American immigrants, who come from a region where race is more often seen as a continuum than a dichotomy. For instance, upon arrival, many Latin American immigrants select “other” when asked about their race, corresponding to a racially mixed identity. However, with rising socioeconomic status, they
are more likely to become familiar with U.S. racial taxonomies and select “white” as their racial identity (Duncan and Trejo, 2011; Pulido and Pastor, 2013). Investigators studying immigrant integration must therefore remember that self-identifications are both causes and consequences of integration and socioeconomic mobility, sometimes making it difficult to measure such mobility over time (discussed further in Chapter 6). Chapter 10 describes the kinds of longitudinal data on immigrants and their children that would enable much more accurate measurement of this change.
The ubiquity and the vagaries of racial and ethnic categorization in American society, along with the scarcity of data on immigration and especially on the second generation, means that there is often conceptual confusion in interpreting trends and statistics not only on racial and ethnic inequality but also on immigrant integration. For example, the gap between Hispanic and white graduation rates in the United States is sometimes interpreted to mean a deep crisis exists in our education system. But Latino graduation rates include about one-third of people who are foreign-born, many of whom completed their schooling in countries such as Mexico, with a much lower overall educational distribution. Throughout the report, the panel tries to specify the intersection between national origin and generation to analyze change over time among immigrants and their descendants. This careful attention to specifying the groups we are analyzing is made difficult by the scarcity of data sources containing the relevant variables. The most glaring problem is that the Decennial Census and American Community Survey do not contain a question on parental birthplace. We return to this issue in Chapter 10 when we discuss data recommendations.
The implications of this debate about the role of racial discrimination in limiting opportunities for immigrants and their children are profound. One out of four children today are the children of immigrants, and the question of whether their ethnoracial identity will hold them back from full and equal participation in our society is an open one. Throughout the report, the panel presents reasons for optimism about the ability of U.S. society to move beyond discrimination and prejudice, as well as particular reasons for concern that discrimination and prejudice will affect immigrants and their descendants negatively. While the panel cannot provide a definitive answer at this time, we do include the best evidence on both sides of this question.
REPORT ORGANIZATION
In the following chapters, the panel surveys the empirical evidence on how immigrant and generational status has been and continues to be predictive of integration into American society. In Chapter 2, we review the legal and institutional context for immigrant integration, including the
historical construction of the U.S. immigration system, the emergence of the current system of legal statuses, and the tensions inherent in the uniquely American brand of “immigration federalism.” Chapter 3 discusses the central role legal status plays in the integration of both immigrants and their descendants and examines the largest and most important legal statuses in detail. Chapter 4 details the political and civic dimensions of integration with a focus on naturalization. Chapter 5 focuses on the spatial dimensions of integration at each level of geography, emphasizing the importance of place and contexts of reception. Chapter 6 examines the socioeconomic dimensions of immigrant integration, including education, income, and occupation. Chapter 7 discusses sociocultural aspects of integration, including language, religion, attitudes of both immigrants and the native-born, and crime. Family dimensions, including intermarriage, fertility, and family form, are the focus of Chapter 8. Chapter 9 outlines the health dimensions of integration, including the apparent immigrant health paradox. Finally, in Chapter 10 the panel assesses the available data for studying immigrant integration and makes recommendations for improving available data sources.
REFERENCES
Alba, R., and Nee, V. (2003). Remaking the American Mainstream: Assimilation and Contemporary Immigration. Cambridge, MA: Harvard University Press.
Alba, R., Reitz, J.G., and Simon, P. (2012). National conceptions of assimilation, integration, and cohesion. In M. Crul and J. Mollenkopf (Eds.), The Changing Face of World Cities: Young Adult Children of Immigrants in Europe and the United States (pp. 41-61). New York: Russell Sage Foundation.
Brown, S.K., and Bean, F.D. (2006). Assimilation models, old and new: Explaining a long-term process. Migration Information Source, 3-41.
Chavez, C. (2008). Conceptualizing from the inside: Advantages, complications, and demands on insider positionality. The Qualitative Report, 13(3), 474-494.
Chellaraj, G., Maskus, K.E., and Mattoo, A. (2008). The contribution of international graduate students to U.S. innovation. Review of International Economics, 16, 444-462.
Choldin, H.M. (1986). Statistics and politics: The “Hispanic issue” in the 1980 census. Demography, 23(3), 403-418.
Citrin, J., Green, D.P., Muste, C., and Wong, C. (1997). Public opinion toward immigration reform: The role of economic motivations. The Journal of Politics, 59(03), 858-881.
Cobb-Clark, D.A., Shiells, C.R., and Lowell, B.L. (1995). Immigration reform: The effects of employer sanctions and legalization on wages. Journal of Labor Economics, 472-498.
Colby, S.L., and Ortman, J.M. (2015). Projections of the Size and Composition of the U.S. Population: 2014 to 2060. Current Population Reports, P25-1143. Washington, DC: U.S. Census Bureau. Available: https://www.census.gov/content/dam/Census/library/publications/2015/demo/p25-1143.pdf [May 2015].
de Crèvecoeur, J. Hector St. John (1782). Letters from an American Farmer and Sketches of Eighteenth-Century America. London, UK: Davies & Davis.
Desilver, D. (2015). Share of Counties Where Whites Are a Minority Has Doubled since 1980. Washington, DC: Pew Research Center. Available: http://www.pewresearch.org/facttank/2015/07/01/share-of-counties-where-whites-are-a-minority-has-doubled-since-1980/ [July 2015].
Donato, K.M., and Gabaccia, D. (2015). Gender and International Migration. New York: Russell Sage Foundation.
Donato, K.M., Alexander, J.T., Gabaccia, D.R., and Leinonen, J. (2011). Variations in the gender composition of immigrant populations: How they matter. International Migration Review, 45(3), 495-526.
Duncan, B., and Trejo, S.J. (2011). Tracking intergenerational progress for immigrant groups: The problem of ethnic attrition. American Economic Review: Papers and Proceedings, 101(3), 603-608.
Frank, R., Akresh, I.R., and Lu, B. (2010). Latino immigrants and the U.S. racial order how and where do they fit in? American Sociological Review, 75(3), 378-401.
Fry, R., Lowell, B.L., and Haghighat, E. (1995). The impact of employer sanctions on metropolitan wage rates. Industrial Relations: A Journal of Economy and Society, 34(3), 464-484.
Gibson, C., and Jung, K. (2006). Historical Census Statistics on the Foreign-Born Population of the United States: 1850-2000. Population Division Working Paper No. 81. Washington, DC: U.S. Census Bureau.
Grasmuck, S., and Pessar, P.R. (1991). Between Two Islands: Dominican International Migration. Oakland: University of California Press.
Greenstone, M., and Looney, A. (2011). Trends: Reduced earnings for men in America. The Milken Institute Review, Third Quarter, 8-16. Available: http://www.hamiltonproject.org/files/downloads_and_links/07_milken_greenstone_looney.pdf [May 2015].
Grieco, E.M., Acosta, Y.D., de la Cruz, G.P., Gambino, C., Gryb, T., Larsen, L.J., Trevelyan, E.N., and Walters, N.P. (2012). The Foreign-Born Population in the United States: 2010. Washington, DC: U.S. Census Bureau. Available: https://www.census.gov/prod/2012pubs/acs-19.pdf [August 2015].
Gulasekaram, P., and Ramakrishnan, S.K. (2015). The New Immigration Federalism. Cambridge, UK: Cambridge University Press.
Hainmueller, J., and Hiscox, M.J. (2010). Attitudes toward highly skilled and low-skilled immigration: Evidence from a survey experiment. American Political Science Review, 104(01), 61-84.
Hall, M., Singer, A., De Jong, G.F., and Graefe, D.R. (2011). The Geography of Immigrant Skills: Educational Profiles of Metropolitan Areas. Washington, DC: Brookings Institution Press. Available:_http://www.brookings.edu/~/media/research/files/papers/2011/6/immigrants-singer/06_immigrants_singer.pdf [May 2015].
Hainmueller, J., and Hopkins, D. (2014). Public attitudes toward immigration. Annual Review of Political Science, 17, 225-249.
Hersch, J. (2008). Profiling the new immigrant worker: The effects of skin color and height. Journal of Labor Economics, 26, 345-386.
Hersch, J. (2011). The persistence of skin color discrimination for immigrants. Social Science Research, 40, 1337-1349.
Hobbs, F., and Stoops, N. (2002). Demographic Trends in the 20th Century. Census 2000 Special Reports, CENSR-4. Washington, DC: US Census Bureau.
Hopkins, D.J. (2010) Politicized places: Explaining where and when immigrants provoke local opposition. American Political Science Review, 104(01), 40-60.
Hopkins, D.J., Tran, V.C., and Williamson, A.F. (2014). See no Spanish: Language, local context, and attitudes toward immigration. Politics, Groups, and Identities, 2(1), 35-51.
Humes, K.R., Jones, N.A., and Ramirez, R.R. (2011). Overview of Race and Hispanic Origin: 2010. 2010 Census Briefs, C2010BR-02. Washington, DC: U.S. Census Bureau. Available: http://www.census.gov/prod/cen2010/briefs/c2010br-02.pdf [August 2015].
Hunt, J., and Gauthier-Loisellem, M. (2010). How much does immigration boost innovation? American Economic Journal: Macroeconomics, 2(April), 31-56.
Jensen, E. (2015). China Replaces Mexico as the Top Sending Country for Immigrants to the United States. Washington, DC: U.S. Census Bureau. Available: http://researchmatters.blogs.census.gov/2015/05/01/china-replaces-mexico-as-the-top-sending-country-forimmigrants-to-the-united-states/ [July 2015].
Kent, M.M. (2007). Immigration and America’s black population. Population Bulletin, 62(4). Available: http://www.prb.org/pdf07/62.4immigration.pdf [September 2015].
Kerr, W.R. (2008). Ethnic scientific communities and international technology diffusion. The Review of Economics and Statistics, 90(3), 518-537.
Lapinski, J.S., Peltola, P., Shaw, G., and Yang, A. (1997). Trends: Immigrants and immigration. Public Opinion Quarterly, 356-383.
Lee, J., and Bean, F.D. (2012). A postracial society or a diversity paradox? Du Bois Review: Social Science Research on Race, 9(02), 419-437.
Lee, T.L., and Fiske, S.T. (2006). Not an outgroup, not yet an ingroup: Immigrants in the stereotype content model. International Journal of Intercultural Relations, 30(6), 751-768.
Lieberson, S. (1963). Ethnic Patterns in American Cities. New York: Free Press of Glencoe.
Lowell, B.L., and Jing, Z. (1994). Unauthorized workers and immigration reform: What can we ascertain from employers? International Migration Review, 427-448.
Lowell, B.L., Teachman, J., and Jing, Z. (1995). Unintended consequences of immigration reform: Discrimination and Hispanic employment. Demography, 32(4), 617-628.
Massey, D.S. (1999). Why does immigration occur?: A theoretical synthesis. In C. Hirschman, P. Kasinitz, and J. DeWind (Eds.), The Handbook of International Migration (pp. 34-52). New York: Russell Sage Foundation.
Massey, D.S. (2007). Categorically Unequal: The American Stratification System. New York: Russell Sage Foundation.
Massey, D.S. (2014). The racialization of Latinos in the United States. In S.M. Bucerius and M. Tonry (Eds.), The Oxford Handbook on Ethnicity, Crime, and Immigration (pp. 21-40). New York: Oxford University Press.
Massey, D.S., and Denton, N.A. (1992). Racial identity and the spatial assimilation of Mexicans in the United States. Social Science Research, 21(3), 235-260.
Massey, D.S., and Sánchez, M. (2010). Brokered Boundaries: Immigrant Identity in Anti-Immigrant Times. New York: Russell Sage Foundation.
Mexican Migration Monitor. (2012). Hitting Homes: The Impact of Immigration Enforcement. Los Angeles: Universit of Southern California Tomas Rivera Policy Institute and Colegio de la Frontera Norte.
Monte, L.M., and Ellis, R.R. (2014). Fertility of Women in the United States: 2012. Washington, DC: U.S. Census Bureau. Available: https://www.census.gov/content/dam/Census/library/publications/2014/demo/p20-575.pdf [August 2015].
Ngai, M.M. (2004). Impossible Subjects: Illegal Aliens and the Making of Modern America. Princeton, NJ: Princeton University Press.
Office of Management and Budget. (1997a). Recommendations from the Interagency Committee for the Review of the Race and Ethnic Standards to the Office of Management and Budget concerning changes to the standards for the classification of federal data on race and ethnicity. Federal Register, 62(131), 36874-36946.
Office of Management and Budget. (1997b). Revisions to the standards for the classification of federal data on race and ethnicity. Federal Register, 62(210), 58782-58790.
Oishi, N. (2005) Women in Motion: Globalization, State Policies and Labor Migration in Asia. Stanford, CA: Stanford University Press.
Parker, C.S., and Barreto, M.A. (2014). Change They Can’t Believe in: The Tea Party and Reactionary Politics in America. Princeton, NJ: Princeton University Press.
Passel, J. (2013). The Rise of Asian Americans. Washington, DC: Pew Research Center. Available: http://www.pewsocialtrends.org/files/2013/04/Asian-Americans-new-fullreport-04-2013.pdf [August 2015].
Passel, J., and Cohn, D. (2011). Unauthorized Immigrant Population: National and State Trends, 2010. Washington, DC: Pew Research Center. Available: http://www.pewhispanic.org/2011/02/01/unauthorized-immigrant-population-brnational-and-state-trends-2010/ [August 2015].
Passel, J., Cohn, D., and Lopez, M.H. (2011). Hispanics Account for More than Half of Nation’s Growth in Past Decade. Washington, DC: Pew Research Center. Available: http://www.pewhispanic.org/2011/03/24/hispanics-account-for-more-than-half-of-nationsgrowth-in-past-decade/ [August 2015].
Passel, J., Cohn, D., Krogstad, J.M., and Gonzalez-Barrera, A. (2014). As Growth Stalls, Unauthorized Immigrant Population Becomes More Settled. Available: http://www.pewhispanic.org/2014/09/03/as-growth-stalls-unauthorized-immigrant-population-becomes-more-settled/ [September 2015].
Perez, A.D., and Hirschman, C. (2009). The changing racial and ethnic composition of the U.S. population: Emerging American identities. Population and Development Review, 35, 1-51.
Perlmann, J. (2005). Italians Then, Mexicans Now: Immigrant Origins and the Second-Generation Progress, 1890-2000. New York: Russell Sage Foundation.
Pettman, J.J. (1996). Worlding Women: A Feminist International Politics. London, UK: Routledge.
Pew Research Center. (2006). America’s Immigration Quandary. Washington, DC: Pew Research Center for the People and the Press and Pew Hispanic Center. Available: http://www.people-press.org/files/legacy-pdf/274.pdf [July 2015].
Portes, A., and Rumbaut, R.G. (2001). Legacies: The Story of the Immigrant Second Generation. Berkeley: University of California Press.
Portes, A., and Rumbaut, R.G. (2006). Immigrant America: A Portrait. Berkeley: University of California Press.
Portes, A., and Rumbaut, R.G. (2014). Immigrant America. 4th Edition. Berkeley: University of California Press.
Prewitt, K. (2013). What is Your Race?: The Census and Our Flawed Efforts to Classify Americans. Princeton, NJ: Princeton University Press.
Pulido, L., and Pastor, M. (2013). Where in the world is Juan and what color is he? The geography of Latina/o racial subjectivity in Southern California. American Quarterly, 65(2), 309-341. Available: http://muse.jhu.edu/login?auth=0&type=summary&url=/journals/american_quarterly/v065/65.2.pulido.pdf [September 2015].
Ruggles, S., Alexander, J.T., Genadek, K., Goeken, R., Schroeder, M.B., and Sobek, M. (2010). Integrated Public Use Microdata Series: Version 5.0 [Machine-readable database]. Minneapolis: University of Minnesota.
Saad, L. (2014). More in U.S. Would Decrease Immigration than Increase. Available: http://www.gallup.com/poll/171962/decrease-immigration-increase.aspx [August 2015].
Segovia, F., and Defever, R. (2010). The polls—trends: American public opinions on immigrants and immigration policy. Public Opinion Quarterly, 24(3) 375-394.
Simes, J.T., and Waters, M.C. (2013). The politics of immigration and crime. In S.M. Bucerius and M. Tonry (Eds.), The Oxford Handbook on Ethnicity, Crime, and Immigration (pp. 457-483). New York: Oxford University Press.
Skocpol, T., and Williamson, V. (2012). The Tea Party and the Remaking of Republican Conservatism. New York: Oxford University Press.
Smith, J.P., and Edmonston, B. (1997). The New Americans: Economic, Demographic, and Fiscal Effects of Immigration. Washington, DC: National Academy Press.
Snipp, C.M. (2003). Racial measurement in the American census: Past practices and implications for the future. Annual Review of Sociology, 29, 563-588.
Sorensen, E., and Bean, F.D. (1994). The Immigration Reform and Control Act and the wages of Mexican origin workers: Evidence from Current Population Surveys. Social Science Quarterly, 75(1), 1-17.
Stephan, P.E., and Levin, S.G. (2001).Exceptional contributions to U.S. science by the foreign-born and foreign-educated. Population Research and Policy Review, 20(1-2), 59-79.
Stephan, P.E., and Levin, S.G. (2007). Foreign scholars in the U.S.: Contributions and costs. In P.E. Stephan and R.G. Ehrenberg (Eds.), Science and the University (pp. 150-173). Madison: University of Wisconsin.
Stoney, S., and Batalova, J. (2013). Central American immigrants in the United States. Migration Information Source, March. Available: http://www.migrationpolicy.org/article/central-american-immigrants-united-states/ [August 2015].
Telles, E.E., and Ortiz, V. (2008) Generations of Exclusion: Mexican Americans, Assimilation, and Race. New York: Russell Sage Foundation.
Turner, M.A., Ross, S., Galster, G.C., and Yinger, J. (2002). Discrimination in Metropolitan Housing Markets: National Results from Phase 1 of the Housing Discrimination Study. Available: http://www.huduser.gov/portal/Publications/pdf/Phase1_Report.pdf [September 2015].
United Nations Population Division. (2013). The number of international migrants worldwide reaches 232 million. Population Facts, 2103/2. Available: http://esa.un.org/unmigration/documents/The_number_of_international_migrants.pdf [September 2015].
U.S. Census Bureau. (2014a). Data on Population Projections: 2014 to 2060. Population projections based on Census 2010. Available: https://www.census.gov/population/projections/data/national/ [September 2015].
U.S. Census Bureau. (2014b). Methodology, Assumptions, and Inputs for the 2014 National Projections. Available: https://www.census.gov/population/projections/files/methodology/methodstatement14.pdf [September 2015].
Waters, M.C. (1990). Ethnic Options: Choosing Identities in America. Berkeley: University of California Press.
Waters, M.C. (2014). Defining difference: The role of immigrant generation and race in American and British immigration studies. Ethnic and Racial Studies, 37(1), 10-26.
Wong, C.J. (2007). Little and big pictures in our heads about local context and innumeracy about racial groups in the United States. Public Opinion Quarterly, 71(3), 392-412.
Yoshikawa, H. (2011). Immigrants Raising Citizens: Undocumented Parents of Young Children. New York: Russell Sage Foundation.


