National Academies Press: OpenBook

Funding and Managing the U.S. Inland Waterways System: What Policy Makers Need to Know: What Policy Makers Need to Know (2015)

Chapter: Appendix E Illustrations of Delay and Possible Metrics by Major River System

« Previous: Appendix D Age Detail for Infrastructure on Each Major River System
Page 185
Suggested Citation:"Appendix E Illustrations of Delay and Possible Metrics by Major River System." National Academies of Sciences, Engineering, and Medicine. 2015. Funding and Managing the U.S. Inland Waterways System: What Policy Makers Need to Know: What Policy Makers Need to Know. Washington, DC: The National Academies Press. doi: 10.17226/21763.
×

APPENDIX E

img

Illustrations of Delay and Possible Metrics by Major River System

This appendix illustrates possible performance metrics by using data from the U.S. Army Corps of Engineers Lock Performance Monitoring System.1 For these illustrations, the lock and dam facilities are ordered from upstream to downstream. Data from 2000 to 2013 are summarized for the Ohio River system (Ohio, Allegheny, and Monongahela locks), the Mississippi River system (where locks are on the Upper Mississippi River), the Illinois River, the Columbia River, and the Arkansas River. The figures compare lock infrastructure for a given river system with regard to long-run demand (cargo transported, vessels, and lockages) and chronic lost service (hours of delay and hours of unavailability). Because the data are averaged over 13 years, such influences as short-term economic downturns are minimized.

In Figure E-1a, most of the commodities are moved on the Ohio River, with less tonnage moved on the Monongahela and much less on the Allegheny. Similar traffic and lockages are seen across most locks on the Ohio River and about half the locks on the Monongahela (the lower sets of locks adjacent to the Ohio); the red and green bars indicate between 4,000 and 10,000 lockages on average. Figure E-1a also shows that downstream locks on the Ohio River handle more cargo than upstream locks, even though numbers of lockages are similar.

With regard to lost service, Figure E-1b shows that delays are correlated with tonnage handled, which suggests that larger tows and longer processing time for a given vessel transit may result in queuing delays for other vessels; this is shown as the increasing blue segments of the stacked bar chart. Three locks on the Ohio River have greater

________________

1 Lock Use, Performance, and Characteristics, http://www.navigationdatacenter.us/lpms/lpms.htm, Locks by Waterway, Tons Locked by Commodity Group, Calendar Years 1993–2013; Locks by Waterway, Lock Usage, Calendar Years 1993–2013; and Locks by Waterway, Locks Unavailability, Calendar Years 1993–2013. Accessed July 2014.

Page 186
Suggested Citation:"Appendix E Illustrations of Delay and Possible Metrics by Major River System." National Academies of Sciences, Engineering, and Medicine. 2015. Funding and Managing the U.S. Inland Waterways System: What Policy Makers Need to Know: What Policy Makers Need to Know. Washington, DC: The National Academies Press. doi: 10.17226/21763.
×

img

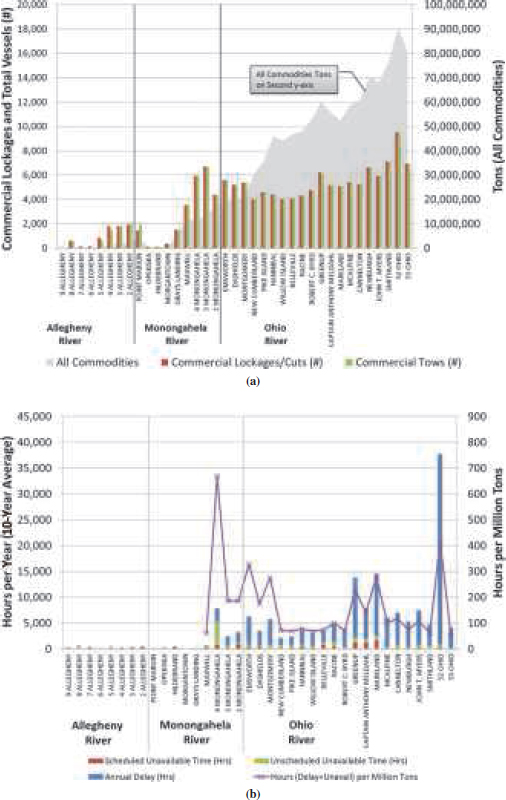
FIGURE E-1 Ohio River system comparison, by facility, of (a) commodities moved, commercial lockages, and vessel counts and (b) nonproductive time per year due to delays and unavailabilities (scheduled and unscheduled).

Page 187
Suggested Citation:"Appendix E Illustrations of Delay and Possible Metrics by Major River System." National Academies of Sciences, Engineering, and Medicine. 2015. Funding and Managing the U.S. Inland Waterways System: What Policy Makers Need to Know: What Policy Makers Need to Know. Washington, DC: The National Academies Press. doi: 10.17226/21763.
×

hours of scheduled unavailabilities (red segments of the stacked bar chart for Greenup, Captain Anthony Meldahl, and Markland). Finally, average statistics for Monongahela Lock 4 suggest that it was out of service for unscheduled unavailabilities much more than the other Ohio River locks.

To assess the impact of delay, an index can be considered, such as the long-run annual hours of lost service (sum of hours of delay and hours of unavailability) per million tons of cargo that transit a facility. This is shown in the purple line graph of Figure E-1b, referenced to the secondary (right-hand) axis. The weighting of the hours lost by the cargo moved (million tons) in the line graph indicates lock facilities where mitigation of delay or unavailabilities might be most helpful in terms of tonnage and thus where investment in reliability or performance may merit increased attention. The average lost service for the Ohio River system is approximately 166 hours per million tons, with about 415 hours per million tons lost at Ohio Lock 52, about 330 hours per million tons lost at Emsworth, and about 670 hours per million tons lost at Monongahela Lock 4. New construction for the Olmsted infrastructure will replace Ohio Locks 52 and 53. This should improve service for the overall river corridor, not least by reducing the approximately 415 hours per million tons lost at Ohio Lock 52.

Figure E-2a indicates that more vessels are operating on the upstream parts of the Mississippi and that the downstream infrastructure is handling fewer numbers of vessels (the green bars trend). Typical vessel counts at Mississippi River locks range between 3,000 and 10,000, with an average of 5,000 vessels transiting these locks. Lockages generally increase from the upstream to the downstream facilities, from approximately 1,000 lockages per year at Lock 1 to as many as 6,000 to 8,000 lockages at Lock 27 and the Melvin Price locks. As in the Ohio River system, commodity volumes moving through downstream locks are greater than those moving through upstream locks. Finally, in view of the fact that Mississippi locks are on upper river regions while the Lower Mississippi River does not have fixed lock and dam infrastructure, the figure should be interpreted as showing river cargo and vessel transits associated with the Upper Mississippi lock infrastructure rather than total Mississippi River activity.

Page 188
Suggested Citation:"Appendix E Illustrations of Delay and Possible Metrics by Major River System." National Academies of Sciences, Engineering, and Medicine. 2015. Funding and Managing the U.S. Inland Waterways System: What Policy Makers Need to Know: What Policy Makers Need to Know. Washington, DC: The National Academies Press. doi: 10.17226/21763.
×

img

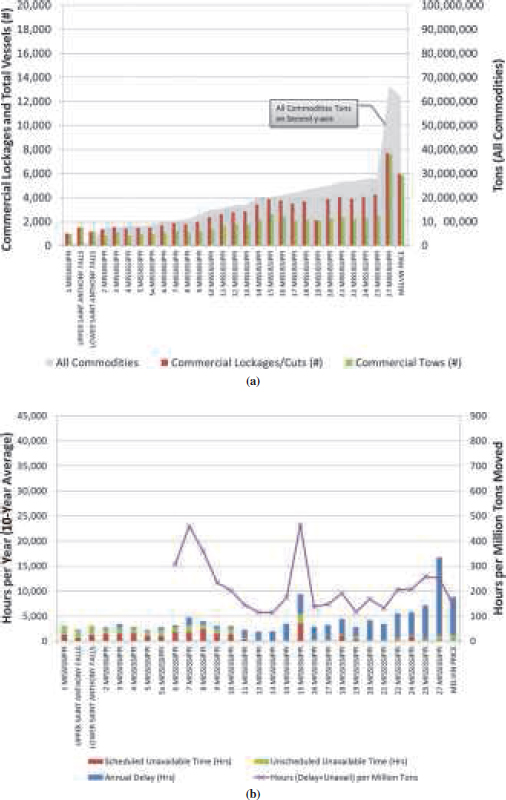
FIGURE E-2 Mississippi River comparison, by facility, of (a) commodities moved, commercial lockages, and vessel counts and (b) nonproductive time per year due to delays and unavailabilities (scheduled and unscheduled).

Page 189
Suggested Citation:"Appendix E Illustrations of Delay and Possible Metrics by Major River System." National Academies of Sciences, Engineering, and Medicine. 2015. Funding and Managing the U.S. Inland Waterways System: What Policy Makers Need to Know: What Policy Makers Need to Know. Washington, DC: The National Academies Press. doi: 10.17226/21763.
×

Figure E-2b illustrates a pattern of delay associated with increasing cargo volumes along downstream segments, similar to that of the Ohio River system in Figure E-1b. Mississippi Locks 1 through 10 and Lock 15 have longer-term patterns of scheduled downtime and are among the locks with more unscheduled unavailabilities. Lock 27 and Melvin Price also experience more hours of unscheduled unavailabilities than do other downstream locks.

For the Illinois River, Figure E-3a shows similar but less dramatic increases in commodity volumes handled downriver and correlations between vessels and lockages similar to those of the Mississippi River. Lock unavailabilities across the Illinois River, both scheduled and unscheduled, are much fewer. This may be related to the lower effective age of the infrastructure; all the Illinois River locks were rehabilitated in the 1990s. (A full analysis of the relationships between lock rehabilitation and lock unavailability has not been undertaken to confirm this apparent correlation throughout the system.)

For the Columbia River system, Figure E-4a indicates a positive relationship between the downstream commodities moved, vessels transited, and lockages. Delays are greater at downstream locks with a notable exception at the Bonneville facility (Figure E-4b), where average delays are still substantial but much lower than for the Dalles and John Day locks. [This may be related to the 1993 construction that reduced the fill and empty times for Bonneville to 9 to 13 minutes from the 15 to 25 minutes associated with the original 1938 construction (see http://www.nwp.usace.army.mil/Portals/24/docs/locations/bonneville/Bonneville_FS.pdf). The John Day lock requires 39 minutes to fill and 15 minutes to empty (see http://www.nwp.usace.army.mil/Media/FactSheets/FactSheetArticleView/tabid/2043/Article/492594/john-day-lock-and-dam.aspx). The Dalles requires 20 minutes to fill and empty (see http://www.nwp.usace.army.mil/Media/FactSheets/FactSheetArticleView/tabid/2043/Article/492595/the-dalles-lock-and-dam.aspx).]

For the Arkansas River, the situation is somewhat different. Figure E-5a indicates similar commodity volumes, vessel transits, and lockages across the Arkansas River lock and dam infrastructure. However, delays are greater in the upstream facilities, as shown

Page 190
Suggested Citation:"Appendix E Illustrations of Delay and Possible Metrics by Major River System." National Academies of Sciences, Engineering, and Medicine. 2015. Funding and Managing the U.S. Inland Waterways System: What Policy Makers Need to Know: What Policy Makers Need to Know. Washington, DC: The National Academies Press. doi: 10.17226/21763.
×

img

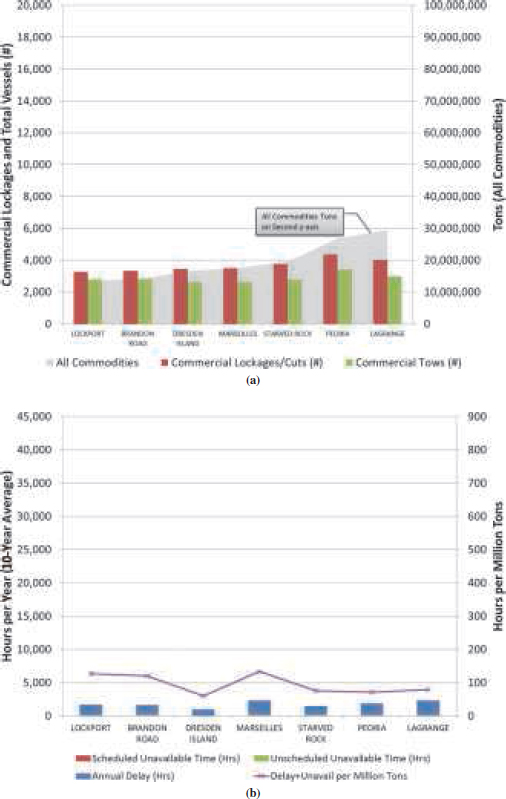
FIGURE E-3 Illinois River comparison, by facility, of (a) commodities moved, commercial lockages, and vessel counts and (b) nonproductive time per year due to delays and unavailabilities (scheduled and unscheduled).

Page 191
Suggested Citation:"Appendix E Illustrations of Delay and Possible Metrics by Major River System." National Academies of Sciences, Engineering, and Medicine. 2015. Funding and Managing the U.S. Inland Waterways System: What Policy Makers Need to Know: What Policy Makers Need to Know. Washington, DC: The National Academies Press. doi: 10.17226/21763.
×

img

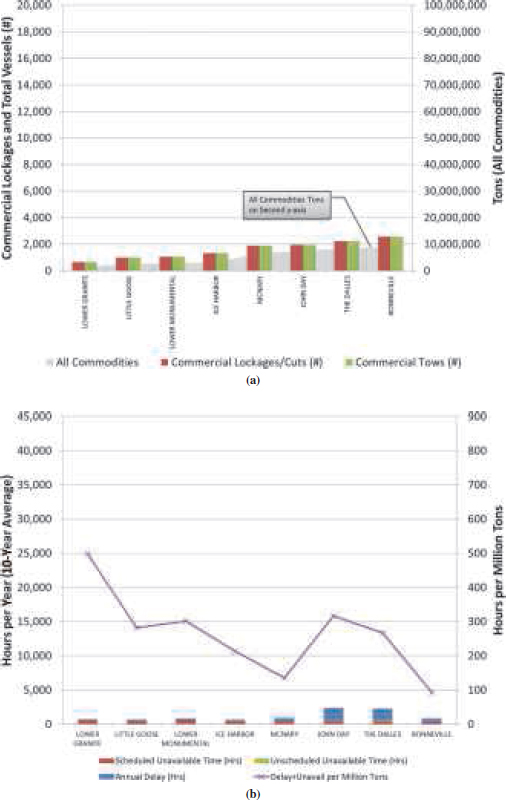
FIGURE E-4 Columbia River comparison, by facility, of (a) commodities moved, commercial lockages, and vessel counts and (b) nonproductive time per year due to delays and unavailabilities (scheduled and unscheduled).

Page 192
Suggested Citation:"Appendix E Illustrations of Delay and Possible Metrics by Major River System." National Academies of Sciences, Engineering, and Medicine. 2015. Funding and Managing the U.S. Inland Waterways System: What Policy Makers Need to Know: What Policy Makers Need to Know. Washington, DC: The National Academies Press. doi: 10.17226/21763.
×

img

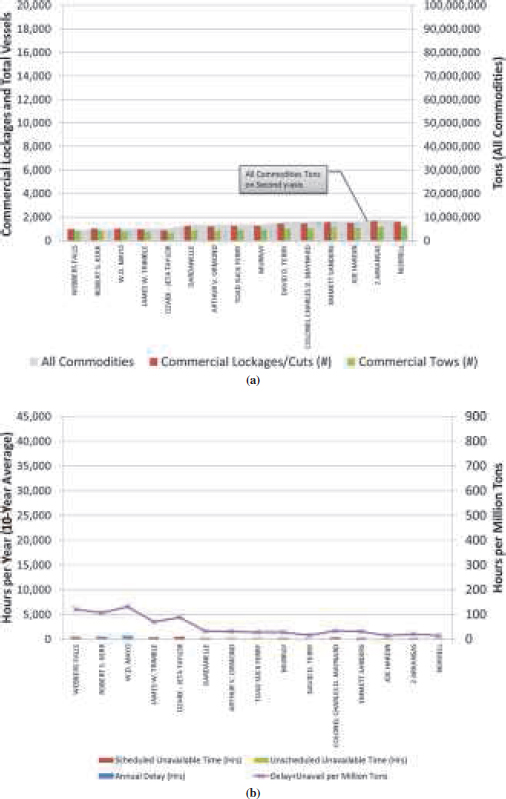
FIGURE E-5 Arkansas River comparison, by facility, of (a) commodities moved, commercial lockages, and vessel counts and (b) nonproductive time per year due to delays and unavailabilities (scheduled and unscheduled).

Page 193
Suggested Citation:"Appendix E Illustrations of Delay and Possible Metrics by Major River System." National Academies of Sciences, Engineering, and Medicine. 2015. Funding and Managing the U.S. Inland Waterways System: What Policy Makers Need to Know: What Policy Makers Need to Know. Washington, DC: The National Academies Press. doi: 10.17226/21763.
×

in Figure E-5b. Scheduled unavailabilities tend to dominate the lost service time due to outages, and they are focused on five lock facilities.

[Figures E-1 through E-5 all use the same y-axis scales to facilitate comparison, and each is aligned from upstream to downstream location to illustrate how delay and tonnage moved (i.e., traffic congestion) are related.]

Page 185
Suggested Citation:"Appendix E Illustrations of Delay and Possible Metrics by Major River System." National Academies of Sciences, Engineering, and Medicine. 2015. Funding and Managing the U.S. Inland Waterways System: What Policy Makers Need to Know: What Policy Makers Need to Know. Washington, DC: The National Academies Press. doi: 10.17226/21763.
×
Page 185
Page 186
Suggested Citation:"Appendix E Illustrations of Delay and Possible Metrics by Major River System." National Academies of Sciences, Engineering, and Medicine. 2015. Funding and Managing the U.S. Inland Waterways System: What Policy Makers Need to Know: What Policy Makers Need to Know. Washington, DC: The National Academies Press. doi: 10.17226/21763.
×
Page 186
Page 187
Suggested Citation:"Appendix E Illustrations of Delay and Possible Metrics by Major River System." National Academies of Sciences, Engineering, and Medicine. 2015. Funding and Managing the U.S. Inland Waterways System: What Policy Makers Need to Know: What Policy Makers Need to Know. Washington, DC: The National Academies Press. doi: 10.17226/21763.
×
Page 187
Page 188
Suggested Citation:"Appendix E Illustrations of Delay and Possible Metrics by Major River System." National Academies of Sciences, Engineering, and Medicine. 2015. Funding and Managing the U.S. Inland Waterways System: What Policy Makers Need to Know: What Policy Makers Need to Know. Washington, DC: The National Academies Press. doi: 10.17226/21763.
×
Page 188
Page 189
Suggested Citation:"Appendix E Illustrations of Delay and Possible Metrics by Major River System." National Academies of Sciences, Engineering, and Medicine. 2015. Funding and Managing the U.S. Inland Waterways System: What Policy Makers Need to Know: What Policy Makers Need to Know. Washington, DC: The National Academies Press. doi: 10.17226/21763.
×
Page 189
Page 190
Suggested Citation:"Appendix E Illustrations of Delay and Possible Metrics by Major River System." National Academies of Sciences, Engineering, and Medicine. 2015. Funding and Managing the U.S. Inland Waterways System: What Policy Makers Need to Know: What Policy Makers Need to Know. Washington, DC: The National Academies Press. doi: 10.17226/21763.
×
Page 190
Page 191
Suggested Citation:"Appendix E Illustrations of Delay and Possible Metrics by Major River System." National Academies of Sciences, Engineering, and Medicine. 2015. Funding and Managing the U.S. Inland Waterways System: What Policy Makers Need to Know: What Policy Makers Need to Know. Washington, DC: The National Academies Press. doi: 10.17226/21763.
×
Page 191
Page 192
Suggested Citation:"Appendix E Illustrations of Delay and Possible Metrics by Major River System." National Academies of Sciences, Engineering, and Medicine. 2015. Funding and Managing the U.S. Inland Waterways System: What Policy Makers Need to Know: What Policy Makers Need to Know. Washington, DC: The National Academies Press. doi: 10.17226/21763.
×
Page 192
Page 193
Suggested Citation:"Appendix E Illustrations of Delay and Possible Metrics by Major River System." National Academies of Sciences, Engineering, and Medicine. 2015. Funding and Managing the U.S. Inland Waterways System: What Policy Makers Need to Know: What Policy Makers Need to Know. Washington, DC: The National Academies Press. doi: 10.17226/21763.
×
Page 193
Next: Appendix F Summary of Correlations Between Lock Performance and Lock Age (in 2014) Calculated from the Date of Known Major Rehabilitation Construction »
Funding and Managing the U.S. Inland Waterways System: What Policy Makers Need to Know: What Policy Makers Need to Know Get This Book
×
 Funding and Managing the U.S. Inland Waterways System: What Policy Makers Need to Know: What Policy Makers Need to Know
MyNAP members save 10% online.
Login or Register to save!
Download Free PDF

TRB Special Report 315: Funding and Managing the U.S. Inland Waterways System: What Policy Makers Need to Know explores the role and importance of the federally funded inland waterways system, priorities for future investment, its beneficiaries, and sources of funding.

In recent years, the inland waterways system has transported six to seven percent of all domestic ton-miles of cargo. The system is a small but important component of the national freight system, particularly for bulk commodities. The study committee finds that, in order to ensure efficient use of limited navigation resources, the most critical need for the inland waterways system is a sustainable and well-executed plan for maintaining system reliability and performance. Reliability and performance will depend on placing higher priority on investments in operations and maintenance (O&M). Without a funding strategy that prioritizes system preservation, maintenance may continue to be deferred, which would result in further deterioration and in a less cost effective and less reliable system.

The committee finds that more reliance on a “user-pays” funding strategy for the commercial navigation system is feasible, would generate new revenues for maintenance, and would promote economic efficiency.

The committee suggests that an asset management program focused on economic efficiency, fully implemented and linked to the budgeting process, would help prioritize maintenance spending and ascertain the funding levels required for reliable freight service.

View the TRB Special Report 315 webcast.

View the press release.

READ FREE ONLINE

  1. ×

    Welcome to OpenBook!

    You're looking at OpenBook, NAP.edu's online reading room since 1999. Based on feedback from you, our users, we've made some improvements that make it easier than ever to read thousands of publications on our website.

    Do you want to take a quick tour of the OpenBook's features?

    No Thanks Take a Tour »
  2. ×

    Show this book's table of contents, where you can jump to any chapter by name.

    « Back Next »
  3. ×

    ...or use these buttons to go back to the previous chapter or skip to the next one.

    « Back Next »
  4. ×

    Jump up to the previous page or down to the next one. Also, you can type in a page number and press Enter to go directly to that page in the book.

    « Back Next »
  5. ×

    Switch between the Original Pages, where you can read the report as it appeared in print, and Text Pages for the web version, where you can highlight and search the text.

    « Back Next »
  6. ×

    To search the entire text of this book, type in your search term here and press Enter.

    « Back Next »
  7. ×

    Share a link to this book page on your preferred social network or via email.

    « Back Next »
  8. ×

    View our suggested citation for this chapter.

    « Back Next »
  9. ×

    Ready to take your reading offline? Click here to buy this book in print or download it as a free PDF, if available.

    « Back Next »
Stay Connected!