
3
National-Level Trends in the SSI Program for Children with Mental Disorders, 2004–2013
This chapter reviews national-level data generated by the Supplemental Security Income (SSI) disability program for children under age 18 for 10 major mental disorder categories (hereinafter referred to as the “10 major mental disorders”) from 2004 to 2013. As described in Chapter 1, these 10 major mental disorders are
- attention deficit disorder/attention deficit hyperactivity disorder (ADHD),
- autistic disorder and other pervasive developmental disorders (ASD),
- intellectual disability (ID),
- mood disorders,
- learning disorder (LD),
- organic mental disorders,
- oppositional/defiant disorder (ODD),
- anxiety disorders,
- borderline intellectual functioning (BIF), and
- conduct disorder (CD).
The quantitative overview provided in this chapter of the SSI disability benefits program for children with mental disorders provides context for the rest of the report in two ways. First, it demonstrates the relative size of the SSI program for children in the United States and the proportion of SSI benefits administered to youth that are based on disability due to mental disorders. Second, it illustrates the trends and trajectories of specific mental
disorder–related determinations of disability and receipts of SSI benefits from 2004 to 2013.
The chapter contains a review of SSI data for the 10 major mental disorders in aggregate and individually from 2004 to 2013. The chapter begins with an aggregate review of the 10 major mental disorders in which recipient and allowance data for the 10 major mental disorders are compared with data on the size of the entire SSI program for children and the size of the under-18 U.S. population. The remainder of the chapter is devoted to a review of the individual 10 major mental disorders, with trends described in the number of allowances, determinations, allowance rates, and recipients. Additional tables with data concerning initial allowances, initial determinations, allowance rates, and recipients for the 10 major mental disorders are included in Appendix E. In-depth reviews of six selected high-priority individual mental disorders are discussed in Part II and Part III of this report.1
AGGREGATE REVIEW OF 10 MAJOR MENTAL DISORDERS
Recipients
In 2013 approximately 654,370 children were recipients of SSI disability benefits for one of the 10 major mental disorders (see Table 3-1). This represents about half (49.51 percent) of all child SSI recipients and 0.89 percent of the entire population of children in the United States in 2013. In 2013 approximately 1.32 million children in the United States were recipients of SSI disability benefits, representing about 1.8 percent of all U.S. children under the age of 18.
As shown in Table 3-1 and in Figures 3-1 and 3-2, from 2004 to 2013 both the number and the proportion of all children who were recipients of SSI disability benefits increased. The number of child SSI recipients increased from 993,127 in 2004 to 1,321,681 in 2013. The percentage of the U.S. under-18 population that received SSI disability benefits increased from 1.35 to 1.8 percent.
However, as the number of children receiving SSI benefits increased, the proportion of SSI children who were recipients of SSI benefits due to the 10 major mental disorders gradually decreased, from 54.38 percent in 2004 to 49.51 percent in 2013. As shown in Figures 3-1 and 3-2, from 2004 to 2013 the increase in both the number and percent of children who were recipients of SSI disability benefits for the 10 major mental disorders was
_________________
1 As discussed in Chapter 1, speech and language disorders are the basis of a large amount of disability in the SSI program, but they are not included in this analysis and are being independently studied by another Institute of Medicine committee, at the request of the Social Security Administration.
TABLE 3-1 SSI Child Recipient Numbers
| Year | Total # of Child SSI Recipients | # of Child SSI Recipients for 10 Major Mental Disorders | # of Child SSI Recipients for All Other Disorders | Percent of Child SSI Recipients with the 10 Major Mental Disorders | U.S. Child Population | Percent of U.S. Child Population Receiving SSI Benefits |
| 2004 | 993,127 | 540,051 | 453,076 | 54.38% | 73,297,735 | 1.35% |
| 2005 | 1,036,498 | 562,402 | 474,096 | 54.26% | 73,523,669 | 1.41% |
| 2006 | 1,078,977 | 577,091 | 501,886 | 53.49% | 73,757,714 | 1.46% |
| 2007 | 1,121,017 | 583,947 | 537,070 | 52.09% | 74,019,405 | 1.51% |
| 2008 | 1,153,844 | 587,618 | 566,226 | 50.93% | 74,104,602 | 1.56% |
| 2009 | 1,199,788 | 600,115 | 599,673 | 50.02% | 74,134,167 | 1.62% |
| 2010 | 1,239,269 | 615,772 | 623,497 | 49.69% | 74,119,556 | 1.67% |
| 2011 | 1,277,122 | 631,602 | 645,520 | 49.46% | 73,902,222 | 1.73% |
| 2012 | 1,311,861 | 647,555 | 664,306 | 49.36% | 73,708,179 | 1.78% |
| 2013 | 1,321,681 | 654,370 | 667,311 | 49.51% | 73,585,872 | 1.80% |
SOURCES: SSA, 2014; U.S. Census Bureau, 2014; unpublished data set provided by the Social Security Administration (SSA).
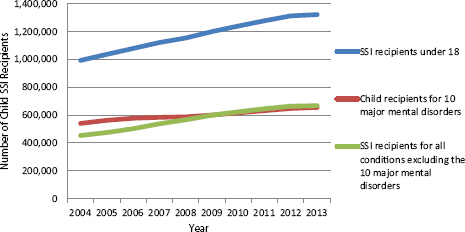
FIGURE 3-1 Numbers of child SSI recipients, 2004–2013.
SOURCES: SSA, 2014; unpublished data set provided by the SSA.
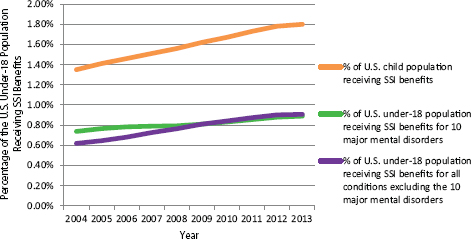
FIGURE 3-2 Percentage of the U.S. under-18 population that received SSI benefits, 2004–2013.
SOURCES: SSA, 2014; U.S. Census Bureau, 2014; unpublished data set provided by the SSA.
surpassed by the increase in the number and percent of recipients for all other disorders. Growth in SSI for children, therefore, is not due primarily or disproportionately to mental illness (excluding speech and language disorders).
Allowances
Allowances are the most direct measure of new cases of disability in the SSI population. The percentage of U.S. children being allowed SSI disability benefits at the initial level did not increase considerably over the 10-year period; the percentage of children being allowed the SSI disability benefits between 2004 and 2013 decreased from 0.24 to 0.23 percent (see Table 3-2). Similarly, the percentage of child allowances attributable to the 10 major mental disorders did not increase over that time period. From 2004 to 2013, slightly more than half of allowances were for one of the 10 major mental disorders, and the percentage of all U.S. children being allowed benefits for one of the 10 major mental disorders also remained largely unchanged from 2004 to 2013, ranging from 0.13 percent in 2004 to 0.11 percent in 2013. These observations suggest that the rate of new cases of severe disability attributable to mental disorders among children applying for SSI benefits did not increase between 2004 and 2013.
Suspensions and Terminations
For every year from 2004 to 2013, excess income or resources was the basis for the largest number of suspensions and terminations of SSI benefits to children who had been current recipients. The total number of suspensions, but not terminations, has increased over the decade, suggesting that a sizable number of suspended children are reinstated.
Over the 10-year period, substantial variation was observed in the numbers of children suspended or terminated because they were found to no longer be disabled. The number of suspensions of children who were no longer disabled decreased from 27,600 in 2004 to 5,800 in 2008 and then increased again to 25,484 in 2013. A similar pattern is seen in terminations: 18,550 terminations in 2004, decreasing to 4,478 in 2008, and increasing to 18,432 in 2013.
It should be noted that changes in the number suspensions or terminations for no longer being disabled are mostly likely not caused by a decrease in the rates of disability in the SSI population, but rather by a change in the utilization rates of continuing disability reviews (CDRs). It is improbable that for the years where the number of children who are terminated or suspended as no longer being disabled, there is a real decrease in the number of children who are no longer disabled. Rather, it is most likely that fewer recipients of disability benefits are undergoing CDRs and therefore fewer children who are no longer disabled are being identified. A reduction in the number of CDRs may result in a decrease in the number of suspensions and terminations, as the children who are no longer disabled but who do not undergo CDRs will remain recipients.
TABLE 3-2 SSI Child Initial Allowances
| Year | Total # of Child SSI Allowances at the Initial Adjudicative Level | # of (Initial) Child Allowances for 10 Major Mental Disorders | # of Child Allowances for All Physical and Other Mental Disorders | Percent of Child Allowances for the 10 Major Mental Disorders | Under-18 Population | Percent of U.S. Child Population Allowed SSI Disability Benefits |
| 2004 | 179,240 | 93,401 | 85,839 | 52.11% | 73,297,735 | 0.24% |
| 2005 | 175,944 | 90,554 | 85,390 | 51.47% | 73,523,669 | 0.24% |
| 2006 | 167,521 | 83,707 | 83,814 | 49.97% | 73,757,714 | 0.23% |
| 2007 | 164,943 | 80,465 | 84,478 | 48.78% | 74,019,405 | 0.22% |
| 2008 | 174,634 | 85,447 | 89,187 | 48.93% | 74,104,602 | 0.24% |
| 2009 | 187,854 | 91,739 | 96,115 | 48.84% | 74,134,167 | 0.25% |
| 2010 | 196,831 | 97,778 | 99,053 | 49.68% | 74,119,556 | 0.27% |
| 2011 | 197,473 | 98,571 | 98,902 | 49.92% | 73,902,222 | 0.27% |
| 2012 | 189,080 | 93,132 | 95,948 | 49.26% | 73,708,179 | 0.26% |
| 2013 | 171,574 | 84,307 | 87,267 | 49.14% | 73,585,872 | 0.23% |
SOURCES: U.S. Census Bureau, 2014; unpublished data set provided by the SSA.
TABLE 3-3 Total SSI Recipients Under 18 Who Were Suspended
| Year | No Longer Disabled | Excess Income or Resources | Other | Total |
| 2004 | 27,600 | 84,900 | 65,800 | 178,300 |
| 2005 | 22,400 | 85,180 | 56,270 | 163,850 |
| 2006 | 11,845 | 82,062 | 51,817 | 145,724 |
| 2007 | 6,588 | 80,409 | 56,591 | 143,588 |
| 2008 | 5,800 | 89,563 | 67,079 | 162,442 |
| 2009 | 9,073 | 88,031 | 75,578 | 172,682 |
| 2010 | 14,721 | 96,165 | 81,721 | 192,607 |
| 2011 | 16,572 | 102,161 | 90,184 | 208,917 |
| 2012 | 25,353 | 96,647 | 85,949 | 207,949 |
| 2013 | 25,484 | 95,138 | 98,485 | 219,107 |
NOTE: Other reasons for suspensions include whereabouts unknown; in Medicaid facility; in public institution; failed to furnish report; outside United States; presumptive disability; no representative payee.
SOURCE: SSA, 2013a.
Excluding the possibility of variations in the rates of suspensions and terminations due to no longer being disabled, no clear trend in the number and proportion of terminations on the basis of other causes is apparent.
Finally, it should be emphasized that the numbers of suspensions and terminations of under-18 SSI recipients (see Tables 3-3 and 3-4) do not include the number of children who transition out of the child SSI program when they turn 18, are found eligible under the adult standard, and go on to be recipients of SSI benefits as an adult. Suspension and termination data for the 10 major mental disorders were not available to the committee, nor were data on the number of SSI child recipients who turn 18, and whose payments are continued, if found disabled using the adult rules, or ceased, if found not disabled using the adult rules. Furthermore, trends in the number of under-18 recipients include both the changes in the number of allowances and changes in the numbers of suspensions, terminations, and transitions into the adult SSI program.
Summary of Aggregate Review of 10 Major Mental Disorders
Figure 3-3 shows the number of initial allowances, initial determinations, and recipients for the 10 major mental disorders from 2004 to 2013. The number of children who were receiving SSI benefits for the 10 major mental disorders continuously increased over that decade, while the
TABLE 3-4 Total SSI Recipients Under 18 Who Were Terminated
| Year | No Longer Disabled | Excess Income and Resources | Death | Other | Total |
| 2004 | 18,550 | 28,270 | 5,500 | 12,950 | 65,270 |
| 2005 | 16,747 | 29,347 | 5,051 | 11,531 | 62,676 |
| 2006 | 17,536 | 31,498 | 5,236 | 10,862 | 65,132 |
| 2007 | 9,516 | 30,384 | 5,488 | 9,759 | 55,147 |
| 2008 | 4,478 | 34,045 | 5,194 | 8,986 | 52,703 |
| 2009 | 4,528 | 31,858 | 5,041 | 11,940 | 53,367 |
| 2010 | 5,720 | 35,528 | 4,824 | 11,543 | 57,615 |
| 2011 | 11,152 | 36,772 | 4,805 | 12,507 | 65,236 |
| 2012 | 13,103 | 34,522 | 4,686 | 12,575 | 64,886 |
| 2013 | 18,432 | 32,825 | 4,484 | 11,341 | 67,082 |
NOTE: Other reasons for terminations include whereabouts unknown; in public institution; failed to furnish report; outside United States.
SOURCES: SSA, 2006, 2013b.
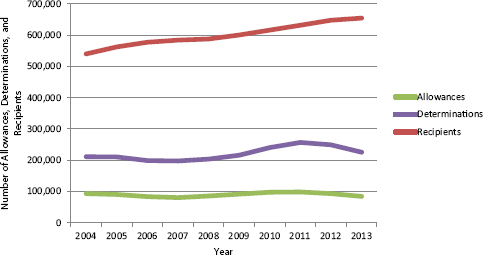
FIGURE 3-3 Initial allowances, initial determinations, and recipient trends for 10 major mental disorders, 2004–2013.
SOURCE: Unpublished data set provided by the SSA.
number of children who were allowed benefits each year did not increase. This figure also shows that approximately half of the determinations of disability for the 10 major mental disorders resulted in denials. These trends indicate that the number of children being allowed benefits and reinstated
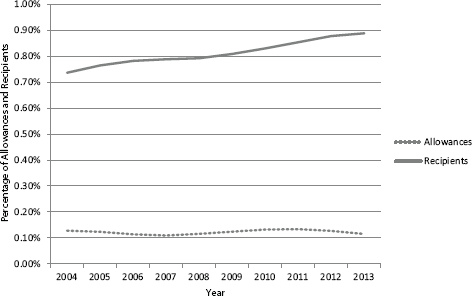
FIGURE 3-4 Percentage of allowances and recipients for SSI benefits adjusted to under-18 population for the 10 major mental disorders, 2004–2013.
SOURCE: Unpublished data set provided by the SSA.
as a recipient from the suspended pool exceeded the number of children who were suspended, terminated, or “aged out” from receiving benefits each year. The number of children who are recipients will continue to rise as long as the number of allowances and reinstatements exceeds the number of suspensions, terminations, and “age-outs.”
A caveat to these conclusions is that the allowance numbers that we report are initial allowances. The total number of allowances resulting from successful appeals is not known to the committee and is thought to be relatively small.
Figure 3-4 shows the percentages of children in the United States who received SSI benefits for the major mental disorders and were allowed SSI benefits for the major mental disorders at the initial level. After adjusting for changes in the population of U.S. children, the same pattern emerges: From 2004 to 2013 the proportion of children who were allowed SSI benefits for the major mental disorders did not increase, while the proportion of children who were recipients did increase.
REVIEW OF INDIVIDUAL MAJOR MENTAL DISORDERS
The numbers of recipients and allowances for all major mental disorders presented in the previous section show the overall trends in the SSI
program, but they also obscure important dynamics and trends at the level of individual disorders. The following four sections will analyze the trends in the number of allowances, determinations, allowance rate, and recipients for the major mental disorders individually.
Allowances
Of the major mental disorders, ADHD is the basis for the largest number of initial allowances across the entire decade. In 2013 there were 24,181 allowances for ADHD, which was the lowest number of annual allowances at any time from 2004 to 2013 (see Figure 3-5). The number of allowances for ASD continuously increased from 2004 to 2012, from 9,677 to 24,159, or a 150 percent increase. By 2013 the number of allowances for ASD nearly equaled the number of allowances for ADHD. By contrast, the number of allowances for ID continuously decreased, from 24,602 to 12,470, a 50 percent decrease over the 10-year period. The remaining seven mental disorders do not exhibit any trends of similar magnitude, although the number of allowances does appear to have decreased over that time
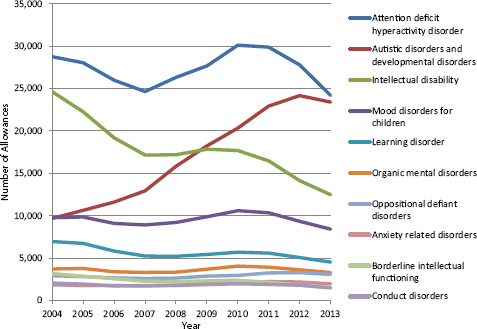
FIGURE 3-5 Number of allowances for major mental disorders for all children under 18, at the initial level, 2004–2013.
SOURCE: Unpublished data set provided by the SSA.
period for LD, BIF, and CD. The trend in the number of ADHD allowances appears to be sensitive to changes in the rate of child poverty, as are several other mental disorders. A large majority of the children who are allowed benefits for the major mental disorders received those benefits for ADHD, ASD, and ID. In 2013, 28.68 percent of allowances were for ADHD, 27.75 percent were for ASD, 14.79 percent were for ID, 9.96 percent were for mood disorders, and 5.35 percent were for LD.
Determinations
From 2004 to 2013 the number of determinations for ADHD was substantially greater than for any of the other major mental disorders (see Figure 3-6). During that period the total annual determinations for any of the nine major mental disorders other than ADHD never exceeded 30,000, while the total annual determinations for ADHD ranged from a low of 87,765 in 2006 to a high of 124,215 in 2011, and ADHD accounted for no less than 42 percent of all determinations for the major mental disorders in each year between 2004 and 2013. However, as previously noted, only
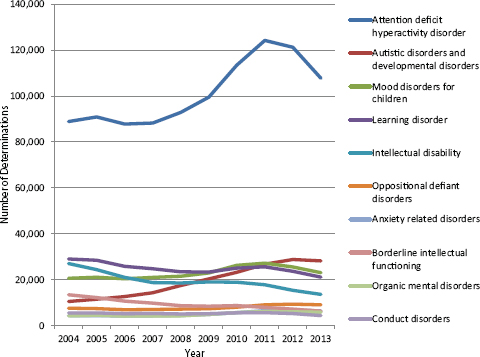
FIGURE 3-6 Number of determinations for the major mental disorders for all children under 18, at the initial level, 2004–2013.
SOURCE: Unpublished data set provided by the SSA.
about 29 percent of allowances are for ADHD, which indicates that a large proportion of all ADHD determinations result in denials.
The opposing trends in the number of determinations of ID and ASD are similar to the trends observed in the numbers of allowances for those two disorders. The number of ID determinations decreased from 27,037 in 2004 to 13,613 in 2013, while the number of ASD determinations increased from 10,486 to 28,192. As a portion of total determinations for the 10 major mental disorders, the percentage of determinations for ASD increased between 2004 and 2013 from 4.97 to 12.49 percent, and the percentage of determinations for ID decreased from 12.8 to 6.03 percent (see Table 3-5).
About one-half of children who are applying for SSI disability benefits are being determined on the basis of ADHD. This indicates that applicants are claiming impairment on the basis of ADHD at a higher rate than they claim impairment on the basis of other mental disorders and also that disability examiners are assigning ADHD as the basis for allowances and denials at a greater rate than they do for other mental disorders, or both. Furthermore, ADHD determinations decreased in the past 2 years of the 10-year period.
Allowance Rate
Figure 3-7 shows the allowance rates for the 10 major mental disorders for all children under age 18 from 2004 to 2013. The highest allowance rates between 2004 and 2013 were observed for ID (90.99 to 91.60 percent) and ASD (92.28 to 83.00 percent). The persistently high rate of ID allowances likely can be explained by the use of an objective measure, the IQ test, for determining an allowance. While ADHD had the highest number of allowances, the allowance rate of ADHD has been low, between 32.32 and 22.40 percent. The ADHD category may be a catch-all for the categorization of applications that are denied because of inadequate severity or applications that lack adequate evidence. The LD category also has a relatively low allowance rate (23.91 to 21.40 percent), potentially indicating that determinations on the basis of LD are associated with applications by families of children who are less disabled. The allowance rate of organic mental disorders decreased from 87.12 percent in 2004 to 56.6 percent in 2013, which may have been related to an overall decrease in the recognition of the diagnostic category by mental health professionals. Overall, the combined yearly allowance rate for the 10 major mental disorders decreased from 52 percent in 2004 to 43 percent in 2013. This indicates that the probability of an applicant being found to be disabled by SSI criteria for the major mental disorders—and subsequently eligible for SSI benefits—actually decreased over the decade of interest. Changes in the allowance rate over time could be explained by changes in the adjudicative
TABLE 3-5 Percentage of Determinations for the Major Mental Disorders for All Children Under 18, at the Initial Level, 2004–2013
| 2004 | 2005 | 2006 | 2007 | 2008 | 2009 | 2010 | 2011 | 2012 | 2013 | |
| ADHD | 42.10% | 43.21% | 44.13% | 44.65% | 45.63% | 46.10% | 47.17% | 48.36% | 48.66% | 47.75% |
| LD | 13.74% | 13.54% | 12.99% | 12.53% | 11.53% | 10.81% | 10.41% | 9.97% | 9.49% | 9.36% |
| Mood | 9.76% | 10.02% | 10.26% | 10.62% | 10.56% | 10.62% | 10.91% | 10.58% | 10.26% | 10.22% |
| ID | 12.80% | 11.60% | 10.56% | 9.48% | 9.12% | 8.80% | 7.86% | 6.93% | 6.16% | 6.03% |
| ASD | 4.97% | 5.48% | 6.38% | 7.26% | 8.59% | 9.43% | 9.65% | 10.41% | 11.55% | 12.49% |
| BIF | 6.35% | 5.80% | 5.36% | 4.95% | 4.28% | 3.91% | 3.64% | 3.09% | 2.88% | 2.79% |
| ODD | 3.59% | 3.53% | 3.48% | 3.55% | 3.53% | 3.40% | 3.33% | 3.53% | 3.76% | 4.01% |
| CD | 2.61% | 2.63% | 2.62% | 2.68% | 2.50% | 2.41% | 2.32% | 2.20% | 2.11% | 1.94% |
| Anxiety | 2.06% | 2.04% | 2.12% | 2.15% | 2.18% | 2.26% | 2.34% | 2.54% | 2.70% | 2.84% |
| Organic | 2.02% | 2.14% | 2.09% | 2.12% | 2.08% | 2.26% | 2.37% | 2.39% | 2.43% | 2.57% |
SOURCE: Unpublished data set provided by the SSA.
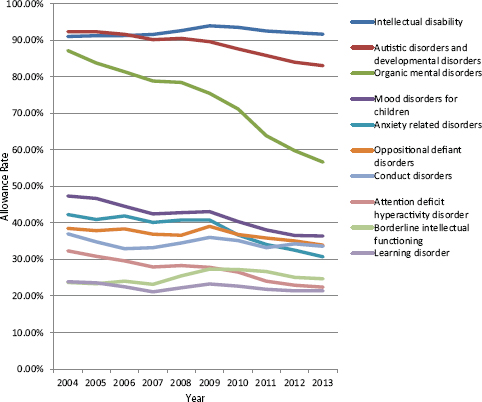
FIGURE 3-7 Allowance rate for the major mental disorders for all children under 18, at the initial level, 2004–2013.
SOURCE: Unpublished data set provided by the SSA.
standards applied by the SSA, changes in the profile of the population of children applying for SSI, or, most likely, both.
Recipients
The number of recipients grew between 2004 and 2013 for 8 of the 10 major mental disorders (see Figure 3-8). There was substantial growth in the number of recipients for ADHD, from 138,921 in 2004 to 226,363 in 2013, and also for ASD, increasing from 43,628 in 2004 to 134,310 in 2013. One of the two exceptions to the trend was the number of ID recipients, which decreased from 215,709 in 2004 to 120,248 in 2013. Overall, as shown in Figure 3-9, the combined number of recipients for the 10 major mental disorders increased each year during the 10-year period, growing from 540,051 recipients to 654,370.
Of the major mental disorders, ADHD, ASD, and ID made up the
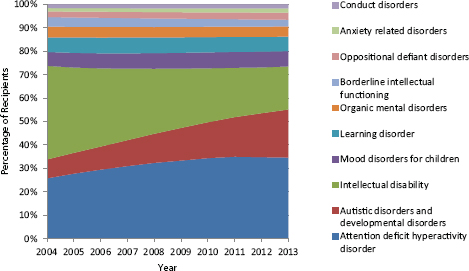
FIGURE 3-8 Percentage of recipients for each of the major mental disorders, 2004–2013.
SOURCE: Unpublished data set provided by the SSA.
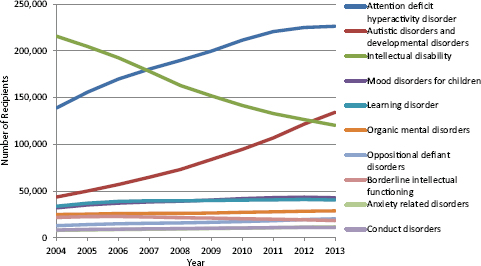
FIGURE 3-9 Number of recipients for the major mental disorders for all children under 18, at the initial level, 2004–2013.
SOURCE: Unpublished data set provided by the SSA.
highest percentage of recipients between 2004 and 2013. In 2013, 34.59 percent of recipients of the major mental disorders were for ADHD, 20.53 percent for ASD, and 18.38 percent for ID. A striking increase in the percentage of recipients was observed for ASD—from 8.08 percent in 2004 to 20.53 percent in 2013. Although the proportion of recipients with ID decreased from 39.94 to 18.38 percent over the 10 years, in 2013 the proportion of recipients for ID was still the third-largest of the 10 major mental disorders. The first year that the number of recipients for ASD exceeded the number of recipients for ID was 2013.
The number of recipients for the other seven major mental disorders did not exhibit changes to the same degree. There was a decrease in the number of recipients for BIF, from 21,749 in 2004 to 18,420 in 2013. The number recipients for organic mental disorders increased from 24,987 in 2004 to 28,793 in 2013, despite a major decrease in the allowance rate. The number of recipients for mood disorders increased from 32,078 in 2004 to 42,826 in 2013; for anxiety related disorders from 7,890 in 2004 to 11,613 in 2013; for CD from 8,280 to 11,077; for ODD from 12,976 to 20,259; and for LD from 33,833 to 40,461.
SSI Regulatory Basis for Allowances from 2004 to 2013
As explained in Chapter 2, benefits can be allowed by four regulatory categories: meets the listings, medically equals the listings, functionally equals the listings, and other allowances. For all 10 years from 2004 to 2013, the majority of allowances for the 10 major mental disorders at the initial level either met the listings or functionally equaled the listings (see Figure 3-10). From 2004 to 2009 the numbers of child allowances for the major mental disorders that met the listings were greater than the number of allowances that functionally equaled the listings. From 2009 to 2013 the numbers of allowances that functionally equaled the listings exceeded the number of allowances that met the listings. Combined with the observation that allowance rates are decreasing, these trends may indicate that the children who are being determined for the SSI benefits on the basis of the major mental disorders are less severely impaired and may not have supporting evidence that meet the listings criteria. However, these findings may simply indicate that the way DDS are adjudicating claims has changed in a way that prefers or prioritizes functional equivalence. The data provided here do not include enough information to support conclusions about the causes of these changes in regulation basis.
The initial allowances by regulation basis for ID and ADHD are shown below in Figures 3-11 and 3-12 to illustrate that the proportion of
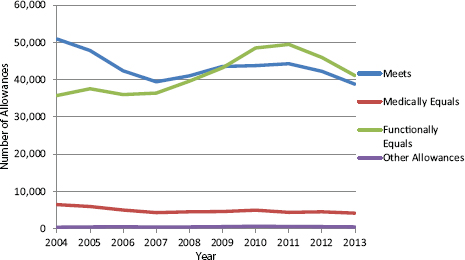
FIGURE 3-10 Initial allowances for the 10 major mental disorders, by regulation basis, 2004–2013.
SOURCE: Unpublished data set provided by the SSA.
allowances by regulation basis can vary considerably among the individual mental disorder categories.
Figure 3-11 shows the percentage of initial allowances for ID by regulation basis for all children under age 18 from 2004 to 2013. A high percentage—more than 80 percent—of allowances meets the listings for the decade. This is likely because of the type of evidence (IQ scores) specified by the listing and generally involved in making a diagnosis. Applicants with a diagnosis and a score within the range of the listing level requirements will be found to meet the listing. However, it is not clear what criteria are used to allow the approximately 15 percent of ID applicants who are based on a functionally equals basis.
Figure 3-12 shows the percentage of initial allowances for ADHD by regulation basis. In 2004, 50 percent of ADHD allowances functionally equaled the listings, and 44 percent met the listings. Between 2004 and 2010 the proportion of allowances that met the listings decreased, and the proportion of allowances that functionally equaled the listings increased. From 2010 to 2013 approximately 26 percent of ADHD allowances met the listings, and 70 percent functionally equaled the listings.
In contrast to the case for ID, since 2010 the majority of ADHD allowances have been for allowances that functionally equal the listings. This is likely due to differences in the nature of the listings criteria and also in the characteristics of the children whose applications are being assigned
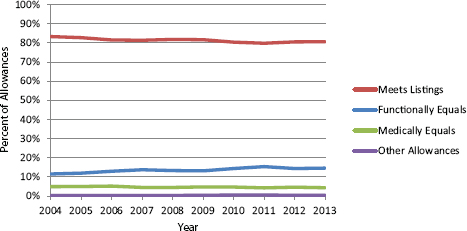
FIGURE 3-11 Percent of initial allowances for ID by regulation basis, 2004–2013.
SOURCE: Unpublished data set provided by the SSA.
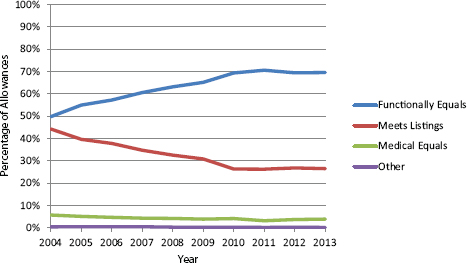
FIGURE 3-12 Percent of initial allowances for ADHD by regulation basis, 2004–2013.
SOURCE: Unpublished data set provided by the SSA.
the impairment code of ADHD by examiners. In contrast to the ID listings which specify IQ test scores, the ADHD listings only specify that there be “medically documented” findings of marked inattention, marked impulsiveness, and marked hyperactivity.
FINDINGS
- In 2013, approximately 1.8 percent of U.S. children (ages 0–18) were recipients of SSI benefits. This had increased from 1.35 percent in 2004.
- Approximately half of all children who are recipients of SSI disability benefits receive benefits due to mental disorders. The percentage of all U.S. children who were recipients of SSI disability benefits for the 10 major mental disorders grew from 0.74 percent in 2004 to 0.89 percent in 2013.
- Among the children who applied for SSI, the proportion whose SSI applications were allowed (i.e., met the SSI disability criteria) each year for all disabilities did not increase from 2004 to 2013.
- The proportion of children whose applications were allowed annually for the 10 major mental disorders out of all allowances for children did not increase. Approximately half of all allowances for child disability benefits were for the 10 major mental disorders.
- The number of suspensions and terminations varied considerably over the period from 2004 to 2013. Changes in the number of children who annually are found to no longer have a severe disability contributed to the variation in number of suspensions and terminations.
- Trends in the number and proportion of allowances and recipients varied by type of mental disorder. Some diagnoses, such as ASD, showed substantial increases over the period. Some, such as ID, showed considerable decreases. For each year from 2004 to 2013, the ADHD category was the largest in terms of the numbers and proportions of child SSI disability allowances and recipients.
CONCLUSIONS
- Overall, the likelihood that an application for benefits was allowed on the basis of a mental disorder decreased from 2004 to 2013. The proportion of all disability determinations for the major mental disorders that resulted in a finding of disability decreased from year to year.
- Generally, each year, the number of suspensions, terminations, and age-18 transitions out of the child SSI program was less than the number of allowances and “reentries” from suspension, which has led to increasing numbers of total recipients.
- A substantial proportion of child disability allowances are on the basis that applicants “functionally equal” the SSA’s “Listing of
- Impairments.”2 There is a substantial pool of children who experience severe disability due to conditions that are not formally described in the Listings and who subsequently cannot be reliably or accurately characterized using the Listings alone. Therefore, the impairments typically associated with primary diagnostic listing may not be the sole impairments experienced by the child. As a consequence, it is not possible to precisely identify the pool of children who are SSI recipients based on a specific mental disorder. That said, the committee concluded that the data contained in this report for each of the 10 major childhood mental disorders are the best available approximation of specific diagnosis prevalence in the SSI beneficiary population.
REFERENCES
SSA (Social Security Administration). 2006. SSI annual statistical report, 2006. Table 51: Recipients terminated, by age and reason for termination, 1998–2005. http://www.ssa.gov/policy/docs/statcomps/ssi_asr/2006/sect10.html#table51 (accessed July 1, 2015).
SSA. 2013a. SSI annual statistical report, 2013. Table 76: Recipients suspended, by age and reason for suspension, 2004–2013. www.ssa.gov/policy/docs/statcomps/ssi_asr/2013/sect11.html (accessed July 1, 2015).
SSA. 2013b. SSI annual statistical report, 2013: Table 77: Recipients terminated, by age and reason for termination, 2006–2013. www.ssa.gov/policy/docs/statcomps/ssi_asr/2013/sect11.html (accessed May 8, 2015).
SSA. 2014. SSI monthly statistics: Table 2: SSI federally administered payments recipients by eligibility category and age, 2004–2013. www.ssa.gov/policy/docs/statcomps/ssi_monthly/index.html (accessed May 8, 2015).
U.S. Census Bureau. 2014. Total population by child and adult populations. http://datacenter.kidscount.org/data/tables/99-total-population-by-child-and-adult-populations?loc=1&loct=1#detailed/1/any/false/35,18,17,16,15/39,41/416,417 (accessed November 14, 2014).
_________________
2 The “Listing of Impairments” is a regulatory list of medical conditions and medical criteria produced by the SSA that serve as a standard for a determination of disability.


