
C
Full Framework Example:
Narrowing Uncertainty in Climate Sensitivity
Quantified Objective: Reduce the Intergovernmental Panel on Climate Change Fifth Assessment (IPCC AR5) uncertainty in equilibrium climate sensitivity by a factor of 2.
IMPORTANCE
Uncertainty in climate sensitivity remains one of the largest sources of uncertainty in predicting the future economic impacts of climate change for any given emissions scenario (U.S. Interagency Working Group on Social Cost of Carbon, 2010, hereafter SCC, 2010). At 90 percent confidence, equilibrium climate sensitivity (ECS) has an uncertainty of roughly a factor of 4, which leads to uncertainty in economic impacts of a factor of roughly 16 (SCC, 2010) due the roughly quadratic relationship between warming and economic impacts. ECS is the long term equilibrium change of global average surface air temperature for a doubling of carbon dioxide. ECS is in essence the “volume dial” on the climate system. Yet, its uncertainty has remained unchanged since the early Charney report in 1979 (NRC, 1979). Because all forms of climate change will scale in magnitude with climate sensitivity, this is a critical quantified objective, with the highest rating level for the importance metric (I).
UTILITY
There are three primary independent approaches to estimate Earth’s climate sensitivity. The first is to determine anthropogenic radiative forcing, and then compare that forcing to the amount of global temperature change. This method is limited primarily by our large uncertainty in the amount of anthropogenic aerosol radiative forcing, especially for aerosol indirect effects (see the discussion in Section 4.2.1 on the utility of measurements for aerosol forcing).1
The second method is to use the paleontological record of past changes in global temperature and carbon dioxide (the past 50 million years from ocean sediment records and over the last 800,000 years from ice cores; see
______________
1 Although uncertainties also arise from the temperature record and the ocean heat storage record, they are much smaller than the uncertainty in anthropogenic aerosol forcing. The latter leads to a factor of 3 uncertainty in total anthropogenic forcing (Myhre et al., 2013), while the former are closer to 30 percent. Therefore, the aerosol uncertainty dominates the estimation of climate sensitivity from the recent observation record.
Collins et al., 2013, Box 12.2, “Equilibrium Climate Sensitivity and Transient Climate Response,” and references therein). This method gives as large an uncertainty as the first (Myhre et al., 2013).
The third method is to use observations to determine the individual major feedback mechanisms in the climate system. This method is based on the ability to separate feedback mechanisms in all climate models and to reconstruct the total climate system sensitivity from these components (Soden et al., 2008). It is also the only method that is capable of breaking the system into key components and verifying that climate models achieve the correct climate sensitivity for the right physical reasons. In this sense, it represents a method closest to a bottom-up physical explanation and verification of climate sensitivity. The primary feedback mechanisms are temperature (Planck2), snow/ice albedo, water vapor, temperature lapse rate, and cloud feedback. Of these, the most uncertain is cloud feedback, primarily resulting from uncertainty in low cloud feedback (Bony et al., 2006; Soden and Held, 2006; Soden et al., 2008; IPCC, 2007; Collins et al., 2013). Water vapor and temperature lapse rate have a strong negative correlation and their uncertainty is minimized when treated as a combined feedback.
Uncertainty in cloud feedback is currently estimated to be a factor of 3 to 4 larger than the other components (Myhre et al., 2013). Achieving the quantified objective of narrowing climate sensitivity with high confidence (i.e., understanding climate sensitivity and its components) will depend critically on obtaining observations able to constrain the uncertainty in cloud feedback, especially that due to low clouds as they are the dominant uncertainty in cloud feedback.
The primary effect of low clouds is to reduce the absorption of solar radiation by increasing Earth’s albedo. Given their low altitude, they have very little compensating greenhouse effect. The magnitude of this effect on absorbed solar radiation is called the shortwave cloud radiative forcing (SW CRF) (Cess et al., 1990). Changing the amount of low cloud or the optical thickness of low cloud in a warming climate can cause warming to be either amplified or reduced because of the changing amount of SW CRF. Low cloud feedback is primarily determined by the change of global average SW CRF with changing global temperature (Soden et al., 2008). Note that cloud feedbacks in the longwave (LW) part of the spectrum also exist and are significant in magnitude, but in much better agreement for climate models. To fully determine cloud feedbacks both LW and SW feedbacks must be constrained with observations. LW cloud feedbacks must be corrected for cloud masking effects of temperature and water vapor feedbacks in the atmospheric column (Soden et al., 2008). The focus is on SW cloud feedbacks here because they dominate the uncertainty in the quantified objective. SW CRF is at the highest level of the utility metric (U) rating to achieve the quantified objective in climate sensitivity.
QUALITY
Efforts have been made to estimate cloud feedback from global radiation budget satellite observations, which have been made since 1978 (Loeb et al., 2012). Unfortunately, the early satellite record lacked both the continuity (i.e., overlap) and the absolute accuracy required to observe the subtle changes in CRF expected for even large cloud feedbacks. These early radiation budget observations were less accurate by a factor of 2 or more than recent CERES observations. The length of the scanner observations required to observe clear- and all-sky conditions for SW CRF were 2 years for Nimbus 7, 5 years for ERBE, and has now reached 14 years for CERES. None of these scanner records were overlapped in time.
The more recent CERES satellite observations beginning in 2000 have improved the accuracy and overlap (Loeb et al., 2012), but the record is still short relative to the noise of natural variability (Dessler, 2010; Dessler and Loeb, 2013; Wielicki et al., 2013), and challenges remain in verifying the level of calibration stability in orbit (Loeb et al., 2012).
Figure C.1 shows the relationship between instrument absolute accuracy, climate record length, and uncertainty in low cloud feedback as measured by decadal trends in SW CRF (Figure 3b from Wielicki et al., 2013). The vertical green arrow at lower left shows the range of signal from climate models of varying climate sensitivity from the CMIP3 archive (Soden and Vecchi, 2011). The uncertainties shown in Figure C.1 include instrument calibration uncertainty as well as orbit sampling uncertainty (see Chapter 2 of this report for the definition of uncertainties).
______________
2 “Planck” denotes a simple radiative response, i.e., σT4, where σ is the Stefan Boltzmann constant and T is the temperature (K).
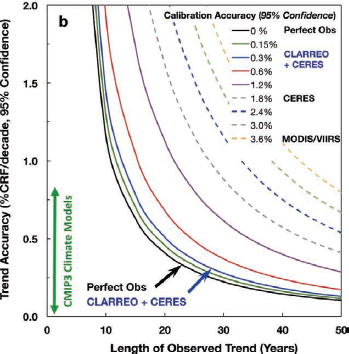
FIGURE C.1 Relationship between SW cloud feedback uncertainty measured as the trend of shortwave cloud radiative forcing (SW CRF), instrument accuracy, and data record length of the trend observed. Uncertainty from a perfect observing system is shown in the black line, the accuracy of current CERES (Clouds and Earth’s Radiant Energy System) SW observation in grey, related MODIS (Moderate-Resolution Imaging Spectroradiometer) cloud property observations in yellow, and CERES if intercalibrated to future more accurate CLARREO (Climate Absolute Radiance and Refractivity Observatory) reference spectral observations. SOURCE: Courtesy of B.A. Wielicki, D.F. Young, M.G. Mlynczak, K.J. Thome, S. Leroy, J. Corliss, et al. 2013. Achieving climate change absolute accuracy in orbit. Bulletin of the American Meteorological Society 94:1519-1539. © American Meteorological Society. Used with permission.
The figure shows that calibration uncertainty dominates cloud feedback uncertainty and therefore will dominate the quality metric for this example. Consistent with Leroy et al. (2008) and Wielicki et al. (2013), the analysis in Figure C.1 includes the impact of drifts in calibration accuracy and/or gaps in the SW CRF record. Either change in calibration will lead to increases in trend uncertainty and increases in time to detect trends in SW CRF.
Narrowing uncertainty in climate sensitivity a factor of 2 will require reducing the uncertainty in SW CRF trends a factor of 2 below the range shown for CMIP3 in Figure C.1. The record length required to achieve this uncertainty level varies from 75 years for MODIS accuracy, to 50 years for CERES accuracy, to 23 years with CLARREO used as an orbiting reference calibration for CERES, and 19 years for a Perfect observing system. The economic impact of advancing knowledge of climate sensitivity by 20 years has been estimated to be on the order of $12 trillion U.S. dollars for the global economy (Cooke et al., 2014). To first order, this study found that the economic value was directly proportional to the number of years that information could be advanced.
Continuity for SW CRF can be defined at three different quality levels. The first level is without any broadband radiation observations for which we use MODIS/VIIRS as a typical example. This case shows a quality metric in time for the required trend accuracy of 75 years for MODIS, where 20 years for a “perfect” observing system = 55 years of time delay in quality. The second level of continuity is to continue the CERES data record, but without the CLARREO level of accuracy. This case gives a quality metric of 50 − 20 = 30 years of time delay. The third level of continuity is to fly CLARREO as an in orbit calibration reference for CERES, which provides a quality metric of 23 − 20 = 3 years of time delay. The committee concludes that there is a very large difference in the time to detect cloud feedbacks as a function of the type of observing system continuity employed.
Since CLARREO can also be used to improve the accuracy of MODIS or VIIRS narrowband imager observations, could CLARREO calibration of VIIRS, VIIRS retrieved cloud and surface properties, and radiative transfer theory be combined to provide the accuracy needed in SW CRF for cloud feedback observations? A study of this type has been done using the CERES SYN data product comparing global climate anomalies of CERES observed fluxes with those determined from radiative transfer theory using MODIS-retrieved cloud properties and the resulting algorithm uncertainties are so large that they show little relationship between global SW CRF anomalies using the two methods. The committee concludes that the combination of CLARREO + VIIRS + theory does not appear to be a viable method for continuity of SW CRF at the quality metric (Q) levels required.
There is a link between this quantified objective for climate sensitivity and the quantified objective for radiative forcing (Detect decadal change in the effective climate radiative forcing (ERF) to better than 0.05 W m−2 (1σ)). The radiative forcing objective requires reduced uncertainty in the magnitude of indirect aerosol radiative forcing. Efforts to achieve such a reduction were a key motivator for the 2007 decadal survey committee’s recommendation to develop the ACE (Aerosol-Cloud-Ecosystem) mission. For the climate sensitivity objective, decadal changes in aerosol indirect effect would affect decadal changes in SW CRF. If global aerosol emissions remain constant over the next several decades, the unknown aerosol indirect effect would not be a critical issue for SW CRF, since it would remain constant. For changing aerosol emissions, however, solving the climate sensitivity objective will require reducing uncertainty in aerosol indirect effect for the radiative forcing objective.
Finally, there is a link between CERES continuity and MODIS/VIIRS continuity. The CERES radiative flux products rely on MODIS/VIIRS surface and cloud property retrievals to determine the appropriate empirical anisotropy model to convert observed broadband radiance to broadband flux (Loeb et al., 2003).
SUCCESS PROBABILITY
All three of the continuity options considered in the quality section are considered: MODIS/VIIRS only, MODIS/VIIRS + CERES, and CLARREO + MODIS/VIIRS + CERES.
MODIS/VIIRS
MODIS has been providing continuous observations on the Terra spacecraft for 15 years and on the Aqua spacecraft for 13 years. The spacecraft and instruments are in good health and operation through 2020 looks very likely, but a formal probability of survival has not been determined. VIIRS launched on the Suomi-NPP spacecraft in 2011, and a follow-on JPSS (Joint Polar Satellite System) instruments are planned for launch in 2017 and 2022. The VIIRS instruments are part of the routine weather observing system and have a design lifetime of 7 years with 85 percent reliability. This predicts a reliability of these instruments at 14-year lifetime of 70 percent. In addition, similar quality imaging instruments will be added on the European Sentinel series of satellites. Given the long lifetime design and the existence of multiple satellite instrument time series, and the long term success with the global satellite weather observations, the success probability of the MODIS/VIIRS quality of imager observations is 90 percent or greater.
CERES + MODIS/VIIRS
CERES has been providing continuous observations on the Terra spacecraft for 15 years, and on the Aqua spacecraft for 13 years. Instrument design life is 5 years (85% reliability). There are two fully operational CERES instruments on Terra (i.e. fully redundant capability) and one fully operational CERES instrument on Aqua. Follow-on CERES instruments have launched on Suomi-NPP in 2011 and are planned for JPSS launches in 2017 and 2022. The lifetime design of the 2017 instrument is 5 years, and the lifetime design of the 2022 instrument is 7 years.
A quantitative gap risk analysis for the CERES instruments was carried out including instrument and spacecraft reliability and launch schedules (Loeb et al., 2009). Gaps were shown to very seriously degrade the accuracy of the climate record and the ability to observe cloud feedbacks. Tests were performed to verify if MODIS + radiative transfer theory could be used to cover the gaps in CERES observations, but this method proved inadequate to maintain climate record accuracy across data gaps or to reliably connect the CERES records across the gap.
The committee concludes that gaps in the CERES record remain a critical limit on the ability to observe cloud feedback in the climate system. Given the long heritage of the CERES instruments and algorithms in orbit, success probability is limited primarily by planned launch schedule, instrument design life, and the ability to verify on orbit the stability of calibration over time. Current planned instrument builds on JPSS do not increase the accuracy over current CERES instruments. A reanalysis of the results in the Loeb et al. (2009) gap risk paper is needed to determine the success probability of overlapping CERES quality observations over the lifetime of JPSS-1 and JPSS-2.
CLARREO + CERES + MODIS/VIIRS
CLARREO provides much higher accuracy observations across the full reflected solar and infrared spectra than CERES or VIIRS, with an improvement of a factor of 3 to 5 in the infrared and a factor of 5 to 10 in the reflected solar. The advance in calibration would enable the CERES observations to survive gaps in the record (Wielicki et al. 2013). The results shown for CLARREO/CERES in Figure C.1 include using CLARREO to calibrate CERES quality radiation budget observations across future gaps in the climate record. CLARREO provides the same capability to MODIS or VIIRS as well as other low earth orbit or geostationary imagers and sounder instruments observing in the reflected solar or infrared spectrum (Wielicki et al., 2013; Lukashin et al., 2013).
In this form of continuity, CLARREO provides the accuracy and traceability to international physical standards (SI standards)3 to meet the climate record accuracy as well as the ability to match angle/space/time with sufficient sampling to reduce calibration uncertainties in CERES and MODIS/VIIRS. Further, in this form of continuity, gap impact is low, so that low gap risks are not required. This can save resources by lengthening the time between satellite launches from the current typical 5 years (e.g., 85% reliability) to 10 years (70% reliability). Success probability for surviving gaps in this form of continuity is 100 percent. The primary risk for this approach is the need to launch new reflected solar and infrared spectrometer instruments and to prove in orbit the calibration verification levels that have been demonstrated by CLARREO-like instruments in the laboratory. Using past NASA research missions and their ability to achieve planned accuracy levels, the likelihood of success is estimated at 80 percent or greater.
FINAL SCORING
Final continuity scoring for three forms of SW CRF continuity for the climate sensitivity quantified objective4 is given in Table C.1 using the benefit (B) formula from Chapter 3 of B = I × U × Q × S, where I ranges from 1 to 5, U ranges from 0 to 1.0, Q ranges from 0 to 1.0, and S ranges from 0 to 1.0 (see Section 4.4 for scoring rationale). The Q1 metric from Section 4.3.2 is used to score quality for this example. This metric is also used in
______________
3 See “SI Traceability,” on the NASA website, “CLARREO: Achieving climate change absolute accuracy in orbit,” at http://clarreo.larc.nasa.gov/about-SITrace.html.
4 This example treats the continuity of Top of Atmosphere SW CRF, which cannot be observed from the ground. The committee did consider, however, whether ground measurements might be relevant for verifying calibration shifts across gaps in the satellite record. While surface based observations of transmitted solar radiation are correlated with top of atmosphere reflected fluxes, the relationship is very noisy (~ 70 W m−2 1 σ instantaneous noise as shown by time/space matched CERES and BSRN (Baseline Surface Radiation Network) observations, or roughly 30 percent of the insolation at the CERES overpass time), so that matching observations to within 0.3 W m−2 as required for the SW CRF accuracy (0.3% of 100 W m−2 global mean SW CRF at 95% confidence) would require (30 × 2/0.3)2—40,000—matched surface/CERES observations to show consistency at 0.3 percent of CRF (95% confidence). Requiring this once per year to monitor change, with 365 CERES orbit overflights of each surface site, would require 40,000/365 = 100 surface sites (versus the current 30 BSRN sites). In addition, such a comparison would add the major uncertainty of using radiative transfer models to relate TOA reflected SW flux to surface transmitted SW flux. Such models are considered to have accuracies of ~ 5 percent, not 0.3 percent. Finally, the accuracy of the highest quality BSRN surface SW flux measurements is about 5 W m−2 or about 2 percent of the CERES orbit crossing average surface insolation. This is about 7 times less accurate than the 0.3 percent required for monitoring SW CRF. From sampling, radiative transfer theory, and calibration accuracy perspectives, the bridging of a gap in SW CRF using surface observations is currently impossible, and the committee is not aware of any future capabilities in any of the three uncertainties (all would need to be solved) that would allow such a capability in the near future. As a result of these considerations, the committee has not included such a gap bridge in the analysis shown here. This does not, however, invalidate the relevance of such an approach for other observations such as air temperature (GRUAN [GCOS Reference Upper Air Network] or GPS-RO [Global Positioning System-Radio Occultation]), ice sheet elevation (IceBridge), CO2 or ozone monitoring networks. The usefulness of surface or aircraft observations as gap fillers will vary widely with quantified objective.
TABLE C.1 Final Continuity Scoring for Quantified Objective Climate Sensitivity
| Three Forms of Shortwave Cloud Radiative Forcing | Importance | Utility | Quality | Success Probability | Benefit | ||||
| (I) | (U) | (Q) | (S) | (B) | |||||
| MODIS/VIIRS | 5 | 1 | 0.0 | 1.0 | 0 | ||||
| CERES/MODIS/VIIRS | 5 | 1 | 0.23 | 0.9 | 1.0 | ||||
| CLARREO/CERES/MODIS/VIIRS | 5 | 1 | 0.83 | 0.8 | 3.3 | ||||
NOTE: CERES, Clouds and Earth’s Radiant Energy System; CLARREO, Climate Absolute Radiance and Refractivity Observatory; MODIS, Moderate-Resolution Imaging Spectroradiometer; VIIRS, Visible Infrared Imaging Radiometer Suite.
Appendix B. We calculate the quality metric based on the CLARREO Pathfinder mission in the President’s 2016 budget beginning observations in 2020. We assume instrument lifetimes of 10 years (consistent with the examples in Appendix B), a value more typical of MODIS/VIIRS/CERES lifetimes than the 5 years used in the analysis for Figure C.1. Given the 2020 start year for the CLARREO observation, we give MODIS/VIIRS/CERES credit for 20 years of on orbit operations since 2000. This acts to increase their quality metric value by reducing their time delay versus a perfect observing system starting in 2020. The CLARREO/CERES/MODIS/VIIRS record begins in 2020 and has no adjustment for existing climate record.
Table C.1 shows the large impact of quality on the benefit provided for the quantified objective for climate sensitivity, with a factor of 3.3 increase over the current observing system. This is true despite the 20 year head start of the CERES/MODIS/VIIRS record. In the future, it would be useful to extend the equations in Section 4.3.2 to not only include past record lengths, but to also separate the trend effects of absolute calibration uncertainty and data gap issues from the effects of overlapped climate records with uncertain slow calibration drifts over time. Each causes errors in climate trend observations but in different ways. In orbit calibration drifts caused by material degradation or contamination will tend to be systematic in sign and to cause systematic biases in climate trends. For example, CERES stability estimate in orbit is 0.5 percent at 95 percent confidence (Loeb et al., 2012) but placing this level of consistent SW CRF trend in Figure C.1 would lead to a systematic bias in cloud feedback with a magnitude that would limit improvement in cloud feedback uncertainty to 40 percent no matter how long the climate record.
REFERENCES
Bony, S., R. Colman, V.M. Kattsov, R.P. Allan, C.S. Bretherton, J.L. Dufresne, A. Hall, S. Hallegatte, M.M. Holland, W. Ingram, D.A. Randall, et al. 2006. How well do we understand and evaluate climate change feedback processes? Journal of Climate 19:3445-3482.
Cess, R.D., G.L. Potter, J.P. Blanchet, G.J. Boer, A.D. Del Genio, M. Déqué, V. Dymnikov, V. Galin, W.L. Gates, S.J. Ghan, J.T. Kiehl, et al. 1990. Intercomparison and interpretation of climate feedback processes in 19 atmospheric general circulation models. Journal of Geophysical Research 95:16601-16615.
Collins, M., R. Knutti, J. Arblaster, J.-L. Dufresne, T. Fichefet, P. Friedlingstein, X. Gao, et al., 2013. Long-term Climate Change: Projections, Commitments and Irreversibility. In Climate Change 2013: The Physical Science Basis. Contribution of Working Group I to the Fifth Assessment Report of the Intergovernmental Panel on Climate Change [Stocker, T.F., D. Qin, G.-K. Plattner, M. Tignor, S.K. Allen, J. Boschung, A. Nauels, Y. Xia, V. Bex, and P.M. Midgley (eds.)]. Cambridge University Press, Cambridge, UK, and New York, N.Y.
Cooke, R., B.A. Wielicki, D.F. Young, and M.G. Mlynczak. 2014. Value of Information for Climate Observing Systems. Journal of Environment, Systems, and Decisions 34:98-109.
Dessler, A.E. 2010. Clouds and the Earth’s energy budget. Geophysical Research Letters 38:L19701.
Dessler, A.E., and N.G. Loeb. 2013. Impact of dataset choice on calculations of the short-term cloud feedback. Journal of Geophysical Research 118:2821-2826.
IPCC (Intergovernmental Panel on Climate Change). 2007. Climate Change 2007: The Physical Science Basis, Working Group I, Contribution to the Fourth Assessment Report of the IPCC. Cambridge University Press, New York.
Leroy, S.S., J.G. Anderson, and G. Ohring. 2008. Climate signal detection times and constraints on climate benchmark accuracy requirements. Journal of Climate 21:841-846.
Loeb N.G., K. Loukachine, N. Manalo-Smith, B.A. Wielicki, and D.F. Young. 2003. Angular distribution models for top-of-atmosphere radiative flux estimation from the clouds and the Earth’s radiant energy system instrument on the tropical rainfall measuring mission satellite. Part II: Validation. Journal of Applied Meteorology and Climatology 42:1748-1769.
Loeb, N.G., B.A. Wielicki, T. Wong, and P.A. Parker. 2009. Impact of data gaps on satellite broadband radiation records. Journal of Geophysical Research 114:D11109.
Loeb, N.G, S. Kato, W. Su, T. Wong, F. Rose, D.R. Doelling, and J. Norris. 2012. Advances in understanding top-of-atmosphere radiation variability from satellite observations. Surveys in Geophysics 33:359-385.
Lukashin, C., B.A. Wielicki, D.F. Young, K. Thome, Z. Jin, and W. Sun. 2013. Uncertainty estimates for imager reference inter-calibration with CLARREO reflected solar spectrometer. IEEE Transactions on Geoscience and Remote Sensing 51(3):1425-1436.
Myhre, G., D. Shindell, F.-M. Bréon, W. Collins, J. Fuglestvedt, and J. Huang. 2013. Anthropogenic and Natural Radiative Forcing. Chapter 8 in Climate Change 2013: The Physical Science Basis. Contribution of Working Group I to the Fifth Assessment Report of the Intergovernmental Panel on Climate Change (Stocker, T.F., D. Qin, G.-K. Plattner, M. Tignor, S.K. Allen, J. Boschung, A. Nauels, Y. Xia, V. Bex, and P.M. Midgley, eds.). Cambridge University Press, Cambridge, U.K., and New York, N.Y.
NRC (National Research Council). 1979. Carbon Dioxide and Climate: A Scientific Assessment. The National Academies Press, Washington, D.C. (often referred to as the Charney report).
SCC (Interagency Working Group on Social Cost of Carbon). 2010. Social cost of carbon for regulatory impact analysis under executive order 12866. Washington, D.C. Appendix 15a. http://www.epa.gov/otaq/climate/regulations/scc-tsd.pdf.
Soden, B.J., and I.M. Held. 2006. An assessment of climate feedbacks in coupled ocean atmosphere model. Journal of Climate 19:3354-3360.
Soden, B.J., and G.A. Vecchi. 2011. The vertical distribution of cloud feedback in coupled ocean-atmosphere models. Geophysical Research Letters 38:L12704.
Soden, B.J., I.M. Held, R. Colman, K.M. Shell, J.T. Kiehl and C.A. Shields. 2008. Quantifying climate feedbacks using radiative kernels. Journal of Climate 21:3504-3520.
Wielicki, B.A., D.F. Young, M.G. Mlynczak, K.J. Thome, S. Leroy, J. Corliss, J. G. Anderson, C. O. Ao, R. Bantges, F. Best, K. Bowman, et al. 2013. Achieving climate change absolute accuracy in orbit. Bulletin of the American Meteorological Society 94:1519-1539.


