
The second session of the workshop provided an overview of the latest research to improve sources of data and methods of data analytics for the next-generation electric grid. The session was co-chaired by Cynthia Rudin (Massachusetts Institute of Technology) and Marija D. Ilic (Carnegie Mellon University). Presentations were made in this session by David Sun (Alstom), Louis Wehenkel (University of Liege, Belgium), and Matthew Gardner (Dominion Virginia Power).
PROSUMER-CENTRIC POWER INDUSTRY TRANSFORMATION
David Sun, Alstom
David Sun began by explaining that his presentation would characterize the U.S. electric grid today and suggest where it should aim to be in the future. He expects that the future will involve changing the way companies and utilities think about their business, the way technology is used, and the way utilities work with other partners. Sun noted that the energy ecosystem is changing: loads now change rapidly and require flexibility, and the notion of cost-benefit trade-offs is evolving. These challenges are business opportunities.
Sun said that the power system industry has changed dramatically in recent years, and it is currently strong, resilient, and reliable. The 1980s classic utility was vertically integrated with a cost-based operation and its own physical infrastructure. In the 1990s, competition was introduced into the utility industry by opening transmission access and creating wholesale electrical markets. He said the era of the
smart grid began in the 2000s with distributed intelligence, service valuation, and prosumer1 choices. Technology has given consumers new choices about electricity consumption and generation, and this is forcing utilities to be more sensitive to consumer demands. Sun sees the future as interconnected cities with increased sustainability, resiliency, and connectivity.
The market evolution from a regulated and vertically integrated system to a wholesale deregulated system, Sun explained, came about in two ways: an energy-centric evolution and a transmission-centric evolution. Neither path of managing the electrons or the transmission lines, respectively, worked independently, but eventually both paths merged to create a balanced converged-market model.
Sun described security-constrained unit commitment-based optimization as an example of an important evolution within the independent system operators (ISOs). A couple of decades ago, he explained, operators used fixed priority orders for unit start-up and shutdown. This evolved into dynamic priority order and, in 1996, the standard became dynamic priority order sequential bidding. Enhanced Lagrangian relaxation was introduced in 2001 to support this optimization, and mixed-integer programming came into play in 2003. In 2013, market optimization benefited from AIMMS 3.13 (Advanced Interactive Multidimensional Modeling System, a software package designed to model and solve large-scale optimization and scheduling problems) and CPLEX 12.5 (an optimization software package accessible through AIMMS). Sun said that the current state-of-the-art approach is mixed-integer programming with meta-heuristic and stochastic optimization. According to Sun, this continued evolution has improved reliability, lowered expenses, and lowered uplift payments; the current annual cost savings attributed to this optimization exceeds $90 million.
Sun noted that many decisions are made on different timescales in wholesale generation markets. He stressed that a lot of experience and judgment are involved in these decisions, and various business processes need to be leveraged to have a smooth progression of decisions in order to optimize electricity supply. These decisions are always being reviewed and reconsidered to make the system better. The ISO needs to look at its long-run and day-ahead purchases and then try to fill in the gaps with short-term and quick-turnaround electricity sources, Sun said. When there is intermittent uncertainty, there needs to be some flexibility at the end of the purchasing line so that gaps can be filled. This is a complex system with more than 1,000 generators used over the course of 24 hours. The measured data and mathematical analyses provide important input to good decision making, but Sun stressed that they cannot answer all the business questions that arise. He said that what is needed is a multidisciplinary approach involving control theory,
____________________
1 The term “prosumer” typically describes the market segment with characteristics of both professional and consumer.
mathematics, data analytics, human factors, and business. As a new generation of ecosystem stakeholders takes on the smart grid, Sun views it as essential that the economic return on investments be considered. For example, Sun argued, while the technologies for batteries and photovoltaics are improving, the evolving business paradigm for employing those technologies needs to be addressed.
Moving to a smarter grid allows many decisions to be decentralized, which Sun believes may end up better serving customers. Pilot smart grid projects are happening all over the world. One example he discussed is the Pacific Northwest Demonstration Project, a 5-year project covering 60,000 metered customers in Washington, Oregon, Idaho, Montana, and Wyoming. This $178 million DOE-funded smart grid project is led by the Pacific Northwest National Laboratory and includes collaborators such as Alstom, IBM, the Bonneville Power Administration, 11 utilities, the University of Washington, and Washington State University. Sun explained that the project goals are to quantify the costs and benefits, develop communications protocols, develop standards, and facilitate integration of wind and other renewables.
Another demonstration project Sun discussed is the NiceGrid Secondary Flexibility Markets being set up in the southeast region of France. He noted that this region is challenging because the area requires stable electricity, yet the transmission corridor is at risk of forest fires. The region would also like to increase solar power sources. According to Sun, the demonstration project will bring together electricity distribution companies, wholesale companies, and distributed energy resources—including distributed components such as energy generation, demand response, and energy storage. The essential goal is to connect end customers with ISOs.
Sun said the current business proposition for grid-connected energy storage resources is not good, but he described several revenue opportunities that could reflect the true value of this service:
- Capacity-resource revenue, which is the analogue of revenue for generation capacity;
- Capacity-connection charge reduction to reduce maximum connected demand;
- Emergency curtailment revenue to reduce net demand during emergency events;
- Energy price arbitrage across time (real-time pricing), including the price differential between high/low price intervals;
- Ancillary service (regulation service) to address capacity payment for up/down regulation capacity; and
- Ancillary services (reserve capacity) operating and/or replacing reserve capacity payment.
The system is currently bundled, but Sun expects services to be unbundled due to new services in the future.
Sun stated that current optimization applications have gained acceptance and perform critical functions in control center operations such as the bulk power grid, wholesale market, and distribution grid. He said there is an unrelenting demand for faster and smarter solutions to optimization problems. The path from research to deployment starts with conceptualizing the business problem, followed by formulating a mathematical model, preparing data, developing a solver engine, and eventually assessing a solution. There can be a big gap between any of these steps, Sun cautioned. This pathway is shown in Figure 3.1.
Sun proposed the following research and development directions:
- Methods to help evaluate expanded business requirements
- — Risk-based decision making
- — Multilevel and distributed decision making, such as coordination and aggregation
- — Analysis of cross-domain interdependence of gas-electric coordination, water, etc.
- Improved analytical solution technology
- — Mixed-integer programming: hot-start, heuristics
- — Stochastic/robust optimization
- — Post-solution assessment and recommendations
- Data and data management
- — Methods suitable for heterogeneous data
- — Methods for data transformation
- — Visual analytics
- — High-performance computing
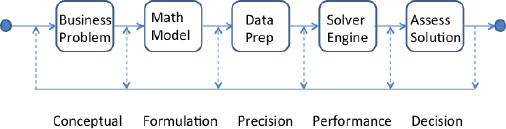
FIGURE 3.1 Pathway from research to deployment of practical optimization. SOURCE: David Sun, Alstom, presentation to the workshop; copyright 2015 Alstom Grid.
Louis Wehenkel, University of Liege, Belgium
Louis Wehenkel explained that his presentation would center on the electric power transmission system while addressing modeling issues from the viewpoint of the transmission system operator. These operators own the transmission grid and are responsible for operating it. While Wehenkel did not discuss it much in his presentation, he stressed that data visualization is important to modeling and understanding data.
The electric power system, as defined by Wehenkel, is closely coupled to consumers, producers, markets, and suppliers and is influenced by the rest of society, the economy, the weather, and environmental factors. He explained that the system is designed and controlled by a team of transmission system and distribution system operators, and it is overseen by regulators.
Wehenkel described three different types of grid-related decision making that must be informed by models:
- Grid (re)design. Design and redesign are called for when new technologies and/or new demands arise. Related decisions support the planning of grid expansions and equipment modifications, perhaps to create a more agile system that can adapt to changes that may come. This decision making deals with longer terms and uncertain projections.
- Asset management. These decision-making activities address how best to manage an aging infrastructure that cannot be “rebooted” or rebuilt from scratch. There is a need for better modeling of equipment aging processes and a more effective prioritization of maintenance, taking into account the condition of pieces of equipment and their criticality to the system.
- Operation and control. The dynamic behavior of the distribution system is rapidly evolving, with more uncertainty and new dynamics as the components of the system evolve, and this poses new requirements on control models. Industry should work toward developing probabilistic and/or robust optimization methods that exploit more measurements and use better algorithms.
How Can Data and Data Analytics Help?
Models can be split into two types, according to Wehenkel: statistical models based on observational data and physical models created from first principles.
He explained that the statistical models are typically representations of joint or conditional probability densities over a set of random variables, induced from observational data. They may include Gaussian processes, Markov chains or fields, logistic models, random forests, and support vector machines. The physical models are often representations of deterministic constraints among physical quantities that describe a system, such as algebraic and differential equations obtained from first principles. Most electric power system models are a combination of these two types, according to Wehenkel.
Models are used, Wehenkel explained, to describe testable hypotheses about real-world behavior and to understand and communicate knowledge about the real world. Models can also be used to figure out what kinds of experiments would provide information necessary for understanding system behaviors. Wehenkel said that models enable one to answer three types of inference questions:
- Observational questions: What might one observe about the grid when certain conditions are seen? For example, what is the probability of a blackout, given that weather conditions are bad?
- Action questions: What if a particular action is done? For example, what would the probability of a blackout be if some load was curtailed?
- Counterfactual questions: What if things had been done differently? For example, would there have been a 2003 blackout if the computers at FirstEnergy and the Midcontinent ISO had been working correctly?
Other desirable properties of models, according to Wehenkel, include simplicity (easy to understand, no superfluous parts), falsifiability (possible to verify through experiments), tractability (can be exploited efficiently), modularity (can be combined with other models), scalability (can be used in the real world), stability (can be updated smoothly over time), and transportability (can be used in different contexts).
What Kinds of Research Efforts Are Needed?
Wehenkel observed that several areas of grid modeling need more focus, including models of the environment, of socioeconomic factors, and of physics of the power system. For the environment, he said, better modeling is needed of the impacts of weather and the climate on generation and grid subsystems and on end users. An example he mentioned would be connecting wind and cloud forecasts with projections about renewable energy availability, loads, and outage patterns. For socioeconomic factors, better modeling is needed of the behavior and preferences of end users, markets, and societies, such as demand-side and
market response. For power system physics, the community needs to better understand the behavior of components and to refresh or revisit dynamic system models, such as aging and failure modes of devices and dynamics of distribution subsystems.
In most of these cases, Wehenkel stated, the available data come as a mixture of large sets of internal and external data and pure observational data and information about physical structure. He noted that the aspects to be modeled are typically coupled. There may be some confounding by weather or by other external factors, and there is a need to model the spatio-temporal correlations among load, generation, faults, and other disturbances. Sometimes, Wehenkel stated, there is a lack of appropriate data due to the rare nature of some extreme events and to data “censoring” as a result of past and current policies with regard to sharing data on system operations and maintenance.
Wehenkel said that the industry needs forecasting that can estimate not only conditional expectations of future values, but also, in order to quantify uncertainty, the conditional distributions associated with those values. He explained that these estimates are needed for accurate risk assessment analyses and decision making. Weather conditions are one of the main influencing factors he described, and they yield correlations among load, generation, and outage rates, both in space and in time. Given that there may be thousands of variables, Wehenkel said, it can be difficult to build tractable models from available data with multiple time steps and correlations. The statistical dependencies in the variables can be difficult to model. Wehenkel suggested building on sparse or hierarchical models, tree-structured graphs, or chordal graphs. These approaches have minimal complexity while still being able to model correlations between variables, and they support learning and inference.
Wehenkel stated that better modeling of loads and demand is also needed; specifically, better dynamic models that respond to voltage/frequency variations over shorter time periods (seconds and minutes) are needed for stability analysis. He said better estimation of the value of lost load (i.e., end-user utility functions) is needed to formulate probabilistic reliability management criteria. He suggested that industry consider the possibilities of novel data acquisition channels together with optimal experiment design to enable demand-side response. This approach might include active learning and reinforcement learning approaches. He noted that distribution and collaboration between transmission system operators is necessary for such an effort to move forward.
Wehenkel also gave two examples of problems for which data are scarce: the estimation of the remaining lifetime of transmission system assets and the estimation of joint probabilities of multiple faults. Both of these estimates are needed in order to develop risk-based reliability management strategies. He said these topics
are currently under investigation, in the context of the European Commission’s collaborative research and development project GARPUR.2
In order to develop reliability-centered maintenance, Wehenkel said, both the health state of grid assets and their criticality need to be quantified. He referred to this as the “remaining lifetime assessment,” and he noted that the health condition of a given device depends on its history of stress (climate based, flow based, and on/off cycles) and on past maintenance operations. Equipment often comes in technology groups (such as groups of transformers of the same generation), Wehenkel commented, but individual elements may age differently. In transmission systems, he said that past maintenance policies have been such that very little, if any, equipment goes into a “terminal” state. This means that the models may lack data about the failure of elements, which can make modeling the aging process more difficult. If there were better models, Wehenkel believes maintenance strategies could be improved to increase system reliability at a lower cost.
Wehenkel posited that solving this problem requires a combination of physical models of degradation processes along with additional experimental data and ad hoc statistical estimation. He encouraged more data- and experience-sharing among transmission service operators. He noted that the same problem also exists in distribution systems, but data about real failures are more common for those systems. He speculated that some distribution models could be applied to transmission systems.
Another data-limited problem discussed by Wehenkel is estimating the probabilities of “N – k events,” which are the probabilities of the different kinds of threats (such as outages) possible within the system. These can be multiple events in some cases, he explained, such as multiple outages in harsh weather conditions. The probabilities of different events and combinations of events change in time and space. To focus attention on the most useful subset of events, Wehenkel said that rough estimates of probabilities are needed. But these can be very difficult to estimate, even for incidences of single outages, due to weather conditions and equipment health-state. Wehenkel commented that it is even more difficult to determine under which conditions individual events may be treated as independent (conditionally on the weather and the health-states) and, if not, how to quantify the joint probabilities of multiple events. He stated that it may be necessary to consider two, three, or even more events jointly to assess the actual threats correctly.
Wehenkel suggested that machine learning can be used to build proxies to inform the system. He said that models that can accurately simulate detailed real-time operations are typically in the form of some (maybe stochastic) formulation
____________________
2 See the GARPUR (Generally Accepted Reliability Principle with Uncertainty Modelling and through Probabilistic Risk Assessment) website at http://www.garpur-project.eu (accessed July 24, 2015).
combined with some algorithmic solution heuristics. When taking day-ahead decisions, he said, operation planners need to estimate next-day real-time operation over many possible scenarios and over many different time steps. This means that day-ahead decision making carries the complexity of real-time decision making raised by several orders of magnitude. When moving to asset management and further to system planning, Wehenkel noted that optimization horizons of one to several years are discussed, which obviously raises complexity by several orders of magnitude. Wehenkel’s notion is that a simple function might be able to mimic what is happening in real time. This “proxy” would be a function whose input is a representation of the information state used in real-time operation and whose output is an estimate of the result of the real-time decision-making process. In principle, he said, such proxies could be built by using state-of-the-art machine-learning algorithms combined with Monte Carlo simulation and optimization tools. If a good proxy is obtained, Wehenkel said, it could be used a day ahead in place of the cumbersome, detailed, real-time decision-making model. Similarly, he said, a proxy for day-ahead decision making may be built for use over longer horizons for decisions related to asset management or system planning. Such a day-ahead proxy would also integrate the effects modeled by the real-time proxy.
Wehenkel believes that transmission service operators could share such proxies and allow one another to take into account information they need from other geographic areas when making decisions, leading to some sort of horizontal coordination. Transmission and distribution service operators could share such proxies, leading to some kind of vertical coordination. Wehenkel said that such ideas are currently under investigation in the context of the European Commission’s project iTesla.3
Wehenkel concluded by highlighting the need for causal models beyond those that can be provided by pure statistics. Such models would need to blend physics and statistics in the proper way. He stressed the need to integrate modeling, simulation, and control into a single overarching activity. In this context, causal models may help to guide the trade-off between exploration and exploitation. Lastly, he reiterated that machine learning might be used to build tractable proxies of subsystems and of subtasks, with the latter possibly reused in many different contexts. Wehenkel suggested Pearl (2009) and Schweppe (1978) as additional reading.
Proxies were revisited during a later breakout session during which a participant stressed that these are the key mathematical challenges. More specifically, the challenge is how to analyze the multigranularity aggregation in a rigorous way. The ongoing DYMONDS activity at Carnegie Mellon University was mentioned as a project that is addressing this challenge.
____________________
3 iTesla, “Innovative Tools for Electrical System Security within Large Areas,” accessed July 24, 2015, http://www.itesla-project.eu/.
GRID-SCALE DATA FUSION: OBSTACLES AND OPPORTUNITIES
Matthew Gardner, Dominion Virginia Power
Matthew Gardner began his talk by discussing synchrophasors, which are phasor measurement unit (PMU) devices that measure the electrical sine waves on an electricity grid and have the capability of putting a time stamp on each measurement. He said that synchrophasors give real-time data about electrical disturbances populating across the grid, and such data show, for example, that it can take multiple seconds for disturbances to travel across the country.
Dominion Virginia Power deployed synchrophasors across their extra-high-voltage network using stand-alone and dual-use PMUs, according to Gardner. The dual-use PMUs are integrated into protection and control equipment, while the stand-alone PMUs are utilized in sensitive areas where control is not desired. Gardner explained that the synchrophasor rollout was initiated with DOE funding, and Dominion was able to install 38 control houses and more than 20 stations. He said additional PMU deployment then became standard business for the company, which deployed additional PMUs in more than 35 locations over the first year. These PMUs capture three-phase voltages, three-phase currents, frequencies, and breaker status for each relay/PMU deployed and all transmission voltage levels covered (500 kV, 230 kV, 115 kV). Dominion uses dual-use relay PMUs wherever possible, Gardner said. He recommended that power companies take advantage of scheduled replacements to deploy relays with PMU capabilities. He noted that the equipment is standard and widely used in utilities. However, he stated, output data are not standardized across manufacturers, and this creates a problem in dealing with data dimensionality.
PMU deployment has dramatically increased across the country over the past decade, which Gardner believes was sparked by the Northeast Blackout of 2003 and by early adoption by progressive organizations. With this widespread deployment, interoperability is a concern. Gardner highlighted three key challenges for interoperability:
- Standards. Conformance to standards must be achieved as a precursor for interoperability, but conformance alone is not enough.
- Testing. Consistent testing and conformance assessment can verify performance and potentially interoperability and is key to consistent interpretation of test results. Testing can also identify the need for improvements to devices and systems, as well as provide feedback for improving standards and implementation agreements. However, both standards and implementation agreements are subject to interpretation and may allow for disparate options, choices, or configurations.
- Life-cycle management. Life-cycle management, asset utilization, and revision control are all considerations affected by interoperability. Architecture interoperability needs to support system life-cycle management and asset utilization (long-term system deployment roadmap).
Data quality is also an important issue, according to Gardner, especially as PMU deployments have grown in size, shape, and number. Organizations are now trying to extract value from their investments by “operationalizing” their data in energy management systems, in special PMU data visualizations, in situational awareness and other special PMU applications, and in engineering roles such as planning and equipment engineering. However, he said, many are experiencing difficulties due to quality of the synchrophasor data.
Gardner said that a number of data-quality myths and misconceptions need to be corrected, such as the incorrect notions that companies can just plug in synchrophasors and receive reliable data and that all types of synchrophasors are equally accurate. He stressed that existing applications are not robust enough to handle bad data quality.
Gardner explained that a variety of data-quality issues develop from many conditions, including dropouts or packet loss, latency, repeated values, measurement bias, bad or missing time stamps, loss of GPS synchronization, incorrect signal meta data, planned or unplanned outages, poor server performance, and improper device configurations. He said that many of these data-quality issues could be solved or mitigated by basic steps such as checking data on frequency, voltage, and current to see if the reported values are near what is expected for the system. Dominion is pushing to automate much of this initial checking, although Gardner does not believe this is common across the industry.
PMUs are an important component in power system metering technology, but they cannot provide accurate and meaningful results on their own, Gardner said. Proper functioning requires precise placement of devices for optimal “observability,” proper configuration and tuning, substation architecture design and standards, a functioning communications infrastructure, a central phasor data concentrator (with appropriate design, architecture, modeling, and work processes), and data conditioning and linear state estimation. He said all of these components must be in place for a PMU to function as desired. There are many misconceptions about linear state estimations, according to Gardner, but even one PMU can provide data for a linear state estimation; full PMU coverage is not required.
Gardner explained that Dominion helped develop an open-source linear state estimator that can quickly and directly measure the system state.4 He noted that being open source is a key attribute for the future of utility software, and he
____________________
4 See the CodePlex website at http://phasoranalytics.codeplex.com (last updated July 7, 2015).
believes it is one that should be more widely adopted in the utility space. During a later breakout discussion, a participant stated that it would also be helpful to the research community at large to have an open-access repository of data, although others expressed concern about the privacy and security of such a repository and the challenge of reconciling data from sources with subtle differences.
Gardner mentioned that visualization provides simple and intuitive ways to present new data. For example, trending and strip charts through RTDMS (Real Time Dynamics Monitoring System)5 show voltages, line flows, system frequency, and angular separation. Other examples include one-line switching diagrams that mirror energy management system navigation and assist human interpretation while improving accessibility by leveraging data connection and providing flexibility when needed. Visualization is not just for control centers, Gardner stated; it assists engineers and back-office staff in decision making and research.
Synchrophasor data have many uses, according to Gardner, such as for validation of models and detection of equipment failure, geomagnetic disturbances, system oscillations, and islanding. Higher-resolution synchrophasor data often appear “fuzzy” because the data contain more information, so the issue becomes discriminating between important and unimportant information. He said an important issue is how to train end users to use synchrophasor data and applications. Dominion created an operator training simulator that brings together electromechanical and electromagnetic dynamics, the closed-loop relay/PMU interface, virtual PMUs streaming data, operator-in-loop run-time controls, and visualization software.
Gardner commented that it is time to use some of the recent gains from synchrophasors applied at the transmission level and apply them to the distribution level to enhance the management of distributed renewable resources.
Looking at the larger picture, Gardner mentioned that utilities are dealing with many types of data and models in addition to those of synchrophasors. For example, information management for utilities often includes models and data from operations, planning, system protection, dynamics, markets, and assets. Unfortunately, he said, it is common for each tool to require its own network model in its own proprietary format and for every program to have its own users and maintainer. Gardner said communications between models is sub-optimal—for example, where two models reference the same network asset, the descriptions may differ. Both technical and organizational “silos” contribute to these problems.
Gardner believes the industry needs a network model data management system that can take in diverse signals (such as generation resource registrations, operations and planning network model changes, and outage and construction information) and output aggregated data (such as topology, ratings, and contingencies; outage
____________________
5 Phasor-RTDMS is a synchrophasor software application. See the Electric Power Group’s website at http://www.electricpowergroup.com/solutions/rtdms/index.html (accessed July 24, 2015).
evaluation; market participation notifications; system and substations one-lines;6 outage scheduling; metering updates and settlement points; and transmission planning future cases). During a later breakout session, participants noted that model complexity increases with the introduction of many power-electronics devices, and it is unclear how much detail about these new devices should be included when building a grid-level analytical model.
Gardner summarized the following key problem areas: data silos, lack of a semantics layer on top of the data, lack of cross-system integration, difficulty sharing data and models, excessive time used to validate data/models, data inaccuracy and inconsistency, common data not being in sync and up-to-date, and difficulty propagating data changes to all pertinent data destinations.
Gardner concluded by noting that workforce turnover is increasing and there is a need to ingrain knowledge in data so that important information is not dependent on the experience base of individual staff members.
____________________
6 A one-line diagram is a simplified notation for representing a three-phase power system.


