
Participation of Women and Minorities
One of the four primary congressional objectives for the SBIR program is “to foster and encourage participation by minority and disadvantaged persons in technological innovation.”1 Given the explicit congressional objective, this chapter focuses more on the SBIR program; the STTR program does not have a similar explicit legislative objective, although we believe that greater inclusiveness is a concern for both programs. Within the SBIR program, this congressional objective has been taken to mean that the relevant metric for participation is company ownership, that is, that participation by women or minorities is equivalent to the participation of companies that are majority owned by women and/or minorities. In addition, “minority and disadvantaged persons” has been defined as those who are either women or are members of a specific disadvantaged group as defined and enumerated by the Small Business Administration (SBA).2
For the purposes of this analysis—and for determining whether agencies are meeting this objective—neither the metric nor the definition is adequate. In implementing the statute via its Policy Guidance, SBA has transformed “minority and disadvantaged persons” into “socially and economically disadvantaged small businesses (SDBs), and [. . .] women-owned small businesses (WOSBs).”3 Although this formulation has become traditional among SBIR stakeholders, it has several unintentional consequences:
_______________
1P.L. 97–219, § 2, July 22, 1982, 96 Stat. 217.
2See http://www.sba.gov/content/who-are-socially-disadvantaged-individuals, accessed May 25, 2014.
3SBA SBIR/STTR Policy Directive, February 24, 2014, p. 3.
- It focuses attention entirely on company ownership, rather than the “participation” described in the statute. There are many different ways to participate in the program, and only one of them is through ownership.
- It replaces “minority and disadvantaged persons” with “socially and economically disadvantaged small businesses,” which aligns the program not with the needs of women and minorities that were at the forefront of congressional objectives, but instead with SBA definitions of socially and economically disadvantaged.
These definitions include in particular Asian Americans. And although in some contexts Asian Americans have been disadvantaged, they are strongly represented in the world of high-tech companies where, for example, 13.4 percent of startups in Silicon Valley were owned by immigrants from India.4 Wadhwa and colleagues found that between 2006 and 2012, 43 percent of Silicon Valley startups had at least one immigrant as a key founder and, of these, 33 percent had Indian founders and 8 percent Chinese founders.5
As a result of the definitions provided by SBA, all participation other than via ownership is disregarded by all agencies; no data are maintained by any agency on female and minority principal investigators (PIs), for example. And as we shall see, SBA definitions of “socially and economically disadvantaged” have the effect of largely obscuring agency performance in meeting congressional objectives to support the participation of African Americans, Hispanic Americans, and Native Americans.
AGENCY DATA
NIH has provided data on the participation of women and minorities (as defined by SBA). These data are discussed in detail in this chapter, following a short summary.
Woman-Owned Small Businesses
For woman-owned small businesses (WOSBs), the share of SBIR Phase I applications increased slightly during the study period to end at 12.8 percent in FY2014. Partly in consequence, the share of awards also increased during the study period (see Figure 6-1).
The growing share of awards to WOSBs is encouraging. However, the share must be considered in the context of the success rate (the rate at which applications turn into awards). For Phase I grants, WOSB applications had a lower suc-
_______________
4Vivek Wadhwa, AnnaLee Saxenian, F. Daniel Siciliano, America’s New Immigrant Entrepreneurs: Then and Now, Kauffman Foundation, 2012.
5Ibid.
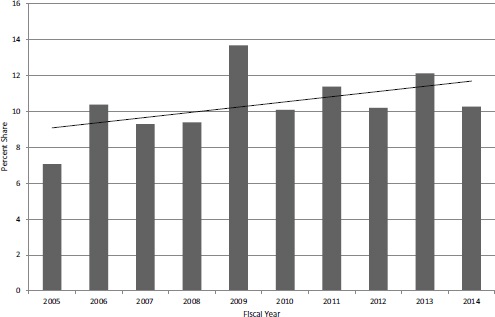
FIGURE 6-1 WOSB share of Phase I awards, FY2005-2014.
SOURCE: Based on NIH RePORTER database, Table 127.
cess rate in every year during the study period: overall, WOSBs accounted for 13 percent of applications and 10.3 percent of awards.
Although the amount of funding for an award is largely determined by the amount applied for by the company, it is also notable that WOSBs consistently receive smaller awards than non-WOSBs (see Annex). In FY2014, on average WOSB awards were $10,000 smaller than nonWOSB awards.
Patterns of Phase II awards are largely driven by Phase I because, prior to FY2015, only Phase I winners could apply for Phase II awards. Overall, WOSBs applied somewhat more frequently than might be expected: they accounted for 10.3 percent of Phase I SBIR awards and 13 percent of Phase II applications.
As with Phase I, the share of Phase II awards to WOSBs was lower than the share of Phase II applications. The WOSB share of awards was lower than the share of applications for 7 of the 10 years covered by the study.
The average Phase I funding levels for WOSBs were consistently lower than those for non-WOSB, in all years except FY2007 and FY2013. On average, the first year of Phase II SBIR funding was almost $27,000 lower, which would normally translate into a difference of more than $50,000 over the life of a standard 2-year Phase II award.
Minority-Owned Small Businesses
The definition of “minority” provided by SBA and used by the agencies does not align with the congressional mandate provided in the authorizing legislation and has the unintended effect of concealing the extremely low rates of participation by African Americans, Hispanic Americans, and Native Americans in the program.
This section focuses on analyzing the data provided by NIH, which uses the SBA definitions for data collection purposes. Accordingly, analysis here uses the same definition: “minority” includes African Americans, Hispanic Americans, Native Americans, and Asian Americans.
Participation by minority-owned small businesses (MOSBs) in NIH SBIR Phase I declined on several key metrics. Both the numbers and shares of MOSB applications declined across the study period, with the latter at 3 percent of all applications in FY2014 (see chapter Annex, Figure 6-11).
The declining application share is exacerbated by low success rates relative to other applications. The Annex shows that success rates for Phase I SBIR applications by MOSBs were lower than those by non-MOSBs in every year of the study period, and in some years were barely one-half. The average success rates for applications by MOSBs and non-MOSBS were 10.1 percent and 18.3 percent, respectively.
As a result of these factors, the MOSB share of awards fell from a peak of 3.5 percent in FY2006 to less than 2 percent in FY2014 (See Figure 6-13). In FY2014, 12 SBIR Phase I awards were made to MOSBs.
The small number of Phase I awards means that the pool of potential Phase II applicants is also small, which is reflected in the low numbers of MOSB Phase II grant applicants (see Figure 6-14). Their share of all applications declined quite sharply starting in FY2010 before rebounding in FY2014. It is possible that recent outreach efforts are starting to pay off (see Chapter 2), but data from FY2015 and later will be needed before conclusions can be drawn.
The small and declining numbers of applications will drive small award numbers and a small share of all awards. However, success rates have generally been lower than those for non-MOSB Phase II applicants. Figure 6-15 shows that in 8 of the 10 study years, success rates of MOSBs were lower than those of others.
The net result of these factors is that MOSBs have accounted for a declining share of SBIR Phase II awards, reaching a low of 1.1 percent in FY2013 before rebounding to 2 percent in FY2014. These figures reflect the very expansive definition of “minority” used by SBA and hence NIH, which includes companies that are owned by Asian Americans.
2014 SURVEY DATA6
As noted above, the SBA’s interpretation of one of the four congressionally mandated objectives for the SBIR/STTR programs is to “foster and encourage participation in innovation and entrepreneurship by socially and economically disadvantaged persons.”7 This mandate has traditionally been interpreted to mean support for women and members of ethnic minorities listed by SBA.
Previous SBIR/STTR studies have focused largely on company ownership by women and by members of socially and economically disadvantaged groups (SEDGs). In most cases, these studies neither addressed the role of the PI nor disaggregated SEDGs by ethnicity. The 2014 survey expands the analysis in both directions.
Woman-Owned Small Businesses and Female PIs
Women have traditionally been viewed as socially and economically disadvantaged in the context of the SBIR program, and expanding opportunities for women has therefore been considered as one of the congressionally mandated goals of the program since the 1992 reauthorization. In most cases, analysts have focused on the participation of woman-owned firms. However, because exercising the responsibilities of a PI may be a stepping stone toward company ownership, the 2014 Survey also addresses the extent to which SBIR awards went to female PIs.
Fifteen percent of Phase II respondents identified a female PI (although only 3.8 percent of the 28 Phase IIB respondents did so).8
Overall, 13.6 percent of respondents reported that the company was woman-owned. Again, Phase IIB respondents reported a lower rate (8.6 percent).
Minority-Owned Small Businesses and Minority PIs9
The current Academies10 surveys of the SBIR/STTR programs are, to our knowledge, the first to probe beneath standard definitions of “socially and economically disadvantaged.” That is, previous SBIR surveys from the Academies
_______________
6The text in this section and accompanying tables 6-1 and 6-2 have been revised since the version presented in the prepublication copy.
7SBA: SBIR Mission and Goals, http://www.sbir.gov/about/about-sbir, accessed August 27, 2012. This definition has historically been taken to include women. Detailed SBA definition of “socially and economically disadvantaged” is available at http://www.sbda.com/sba_8percent28apercent29.htm.
82014 Survey, Question 16. N=605.
9Different agencies use different terminologies, which also change over time. “Minority-owned” is a widely used term, but others use “socially disadvantaged.”
10Effective July 1, 2015, the institution is called the National Academies of Sciences, Engineering, and Medicine. References in this report to the National Research Council or NRC are used in an historic context identifying programs prior to July 1.
and from other organizations—as well as agency data—have all simply sought to determine whether the company is majority-owned by members of socially and economically disadvantaged groups as defined by SBA.
As with the 2005 Survey, the 2014 survey asked whether the PI for the surveyed project was from a minority population. Seven percent of respondents indicated that this was the case for their project.11
The survey also asked respondents to provide details about the PI’s ethnic background. Detailed categories were drawn from SBA definitions, with the addition of a category for “other” to ensure that all respondents who wished to claim minority status had an appropriate response category.
About 72 percent of respondents reporting a minority PI indicated that the PI was Asian Pacific or Asian Indian. Only 2 of more than 600 responses indicated that the PI was African American.
It must be understood that we are dealing with small numbers of respondents—only 57 respondents indicated that their PI was minority. Even so, the almost complete absence of Black (African American) and Native American PIs and the limited presence of Hispanic PIs is notable (see Table 6-1).
Turning from the ethnicity of PIs to the ethnicity of the owners of surveyed companies showed that approximately 7 percent of respondents indicated that the company was majority-owned by minorities at the time of the award. Probing more deeply into the ethnic distribution of minority company ownership showed a distribution quite similar to that for minority PIs, in that 68 percent of minority-owned companies reported majority owners of Asian Indian and Asian Pacific ethnicity (see Table 6-2).
The numbers involved here are very small indeed: the survey reported three Phase II awards to African American owned companies.
NIH SBIR/STTR OUTREACH TOWARD POTENTIAL WOMEN AND MINORITY PROGRAM PARTICIPANTS12
NIH began more detailed tracking of its SBIR/STTR outreach 3 years ago, as is effectively required by the 2011 SBIR/STTR Reauthorization Act. Today, this effort includes tracking the following data:
- The number of overall attendees at outreach events
- The state of residence of each attendee
- Whether the attendee is from a WOSB and/or a MOSB
_______________
11See Table 6-1.
12This section of the report is based on material provided directly by the NIH SBIR/STTR Program Office and through discussions with agency staff.
TABLE 6-1 Composition of PIs by Gender and Ethnicity, as a Percentage
| NIH Total | SBIR Awardees | STTR Awardees | Phase IIB Awardees | ||
| Woman | 14.9 | 15.2 | 13 | 3.6 | |
| Minority | 9.4 | 10 | 6.5 | 7.1 | |
| Asian-Indian | 1.8 | 2 | 1.1 | ||
| Asian-Pacific | 5.0 | 5.7 | 1.1 | 7.1 | |
| Black | 0.3 | 0.2 | 1.1 | ||
| Hispanic | 2.0 | 2.1 | 1.1 | ||
| Native American | 0.2 | 1.1 | |||
| Other | 0.3 | 0.2 | 1.1 | ||
| Not a woman nor a minority | 76.8 | 76 | 81.5 | 89.3 | |
| BASE: TOTAL RESPONDENTS ANSWERING QUESTION |
604 | 512 | 92 | 28 | |
SOURCE: 2014 Survey, Question 16.
TABLE 6-2 Minority Company Ownership, by Ethnicity and Program
| Percentage of Respondents | |||||
| NIH Total | SBIR Awardees | STTR Awardees | Phase IIB Awardees | ||
| Woman-owned | 13.1 | 13.4 | 11.2 | 8.3 | |
| Minority-owned | 6.9 | 7.5 | 3.4 | 4.2 | |
| Asian Indian | 1.2 | 1.3 | 1.1 | ||
| Asian Pacific | 3.5 | 4.0 | 1.1 | 4.2 | |
| Black | 0.5 | 0.4 | 1.1 | ||
| Hispanic | 1.6 | 1.9 | |||
| Native American | |||||
| Other | 0.2 | 0.2 | |||
| Not woman- or minority-owned | 81.8 | 81.2 | 85.4 | 87.5 | |
| BASE: TOTAL RESPONDENTS ANSWERING QUESTION |
567 | 478 | 89 | 24 | |
SOURCE: 2014 Survey, Question 15.
Overall, NIH spent about $2 million in administrative funds on outreach in FY2014.13 A review of the activities described in the NIH Annual Report to SBA indicates that numerous other outreach activities appeared to be higher priority
_______________
13NIH SBIR Report to SBA, FY 2014, p. 10.
than outreach to women and minorities. Of all the activities listed, only one mentions underrepresented groups.14
Most NIH outreach activity is conducted through partnerships with other event organizers. The FY2014 report included participation in conferences sponsored by the Advanced Medical Technology Association, the Association of University Technology Managers, and the International Meeting for Autism Research. Because it has only limited influence over their activities, NIH has focused on improving reporting from these partners. NIH now sends each organizer a request form that asks the organizers to track attendance from IDeA states,15 WOSBs, and MOSBs (although, using SBA terminology, the latter are owned by individuals from socially and economically disadvantaged groups). NIH program managers acknowledge that acquiring accurate data through event organizers is challenging.
NIH and the Department of Health and Human Services (HHS) are also targeting events to reach out specifically to women- and minority-owned small businesses. NIH has held a well-attended WOSB/MOSB workshop within its own Annual Conference in each of the past several years and has begun outreach to professional societies for women- and minority-owned small businesses. The NIH Program Office expects that its staff will attend events from those organizations in the future. The Program Office is also working to reach younger potential entrepreneurs, and its staff will attend the AAAS Minority Fellowship conference in 2016 to present on the agency’s SBIR/STTR programs.
Finally, NIH is participating and supporting the SBIR Road Tour, organized by SBA, to reach underrepresented states and women- and minority-owned small businesses. This effort, however, is primarily focused on the states rather than on underrepresented groups.
The Challenge of Improving Diversity16
The committee recognizes that small businesses often introduce the radical ideas that can transform industries and markets, and that mobilizing all skilled individuals, regardless of race/ethnicity or gender, strengthens the economy and the nation. To this end, the committee convened a workshop to draw attention to participation of women, minorities, and both older and younger scientists, engineers, and entrepreneurs in the SBIR program and to identify mechanisms for improving their participation rates.17 The workshop also drew attention to the fact
_______________
14NIH SBIR Report to SBA, FY 2014, pp. 10-11.
15NIH established the Institutional Development Award (IDeA) program in 1993. IDeA—the largest of the EPSCoR-like programs—is designed to broaden the geographic distribution of NIH funding for biomedical research.
16National Academies of Sciences, Engineering, and Medicine. 2015. Innovation, Diversity, and the SBIR/STTR Programs: Summary of a Workshop. Washington, DC: The National Academies Press.
17Ibid, p. 5.
that improving the participation of women and minorities in the SBIR program is a part of a broader national challenge. See Box 6-1.
Participants in the workshop examined broad demographic trends in the science and engineering workforce and statistical measures from the SBIR program for women and minorities, and searched for pragmatic solutions to boost SBIR awards to women and minorities. The workshop highlighted the fact that women comprise 51 percent of the U.S. population and 27 per cent of STEM graduates, but woman-owned companies have received only about 6 percent of SBIR awards. Hispanics, African Americans, Asian Americans, and Native Americans together comprise 36 percent of the U.S. population and 26 percent of STEM graduates, but less than 10 percent of all SBIR awards. Beyond NIH’s SBIR program, the current participation of women and minorities was found to be low and decreasing, and participation of African-Americans and Hispanics is particularly low.
Steps identified by participants to stimulate participation by under-represented populations included steps to expand the applicant pool, eliminate barriers in grant applications and selection, and provide greater education and support for entrepreneurship training and commercialization efforts. Participants also saw the need to
BOX 6-1
Expanding Participation of Women and Minorities in STEM
The 2011 publication by the National Research Council, Expanding Underrepresented Minority Participation: America’s Science and Technology Talent at a Crossroads, notes that underrepresented minorities, defined here as Hispanics, African Americans, Native Americans/Alaska Natives, comprise a small percentage at each step of the science, technology, engineering, and mathematics (STEM) education process.a The percentage of African American and Hispanic undergraduate majors interested in STEM is similar to that of white and Asian Americans, but their completion rates are much lower. At the graduate school level for science and engineering, underrepresented minorities receive only 14.6 percent of master’s degrees and 5.4 percent of doctoral degrees. Data from the National Science Board indicates that women earn roughly half of S&E degrees at the bachelor’s, master’s, and Ph.D. levels, but they earn “fewer than one-third of the doctorates awarded in physical sciences, mathematics and computer sciences, and engineering” and less than a quarter of engineering master’s degrees.
_______________
a National Research Council, Expanding Underrepresented Minority Participation: America’s Science and Technology Talent at a Crossroads, Washington DC: The National Academies Press, 2011.
align and leverage resources and programs at the state level that aim at providing access and support to woman- and minority-owned businesses; and to team with other federal and state/local programs which are addressing this issue.
Speaking at the workshop, Matthew Portnoy, SBIR/STTR program coordinator at the National Institutes of Health, said that the NIH has diversity supplement programs to support under-represented groups on SBIR and STTR awards.18 In this regard, he noted that NIH is targeting outreach to women-owned and socially and economically disadvantaged businesses. NIH is also coordinating its SBIR/STTR programs with the NIH Institutional Development Award (IDeA) program to target underrepresented states. The NIH’s annual IDeA Symposium includes sessions on the SBIR/STTR program and the NIH Annual SBIR/STTR Program includes a session on the IDeA program.
Over time, discussions regarding possible underlying causes of the under-representation of women and minorities in the SBIR/STTR program have been broadened. While the workshop on diversity convened by the committee focused, for example, on upstream barriers in the STEM pipeline leading to SBIR/STTR application, recent studies have extended the look to potential downstream barriers in the pipeline leading to the successful commercialization of SBIR/STTR-funded innovations. Box 6-2 lists a selection of recent publications that examine barriers to women and minority SBIR/STTR participation rates in the broader context of an extended pipeline. It remains for further investigation to more fully explain causation and to arrive at practical solutions leading to higher participation rates of women and minorities in SBIR/STTR.
SUMMARY: WOMAN AND MINORITY PARTICIPANTS IN THE NIH SBIR/STTR PROGRAM
Although participation of WOSBs in the NIH SBIR program appears to be improving, there are areas of continuing concern. Their share of applications is still relatively low, despite the high percentage of female PhDs in the life sciences. The fact that success rates for WOSBs for both Phase I and Phase II were persistently lower than those for non-WOSBs requires further analysis by NIH. Although the amounts involved are not very large (perhaps 5 percent of award size), it is important to determine why WOSB award sizes are consistently lower than those for non-WOSBs.
The review of the data reveals that NIH experiences serious difficulties in attracting MOSBs to the SBIR program. Using the SBA definition, award shares to MOSBs have declined and now account for only 2 percent of Phase II awards. Success rates for MOSB applicants are persistently lower than for non-MOSB applicants, for both Phase I and Phase II.
_______________
18National Academies of Sciences, Engineering, and Medicine. 2015. Innovation, Diversity, and the SBIR/STTR Programs: Summary of a Workshop. Washington, DC: The National Academies Press, p. 41.
BOX 6-2
Extending Perspectives on Diversity
Recent inquiries by the Academies and others to examine the participation of women and minorities in the SBIR/STTR programs and in other STEM activities seek to gain a better understanding of the scope and nature of the problem. In particular, to what extent are the low participation rates by women and minorities a failure of the NIH SBIR/STTR program, and to what extent is this a problem that comes out of the communities served by and interfacing with the NIH program. These are the communities of academic and industrial life-sciences that spawn the populations of existing and potential small businesses that could benefit from the NIH SBIR/STTR program.
More recent studies examine the possibility that significant barriers may lie beyond the interface of the SBIR/STTR with the life-sciences community (as witnessed by efforts at universities to encourage and support women in science, and the availability of opportunities for research support provided by the NIH SBIR/STTR program). These studies point to institutional and cultural impediments to women- and minority-owned entrepreneurial businesses that exist downstream of SBIR/STTR, in financial markets and business communities that are critical to the commercialization of innovation resulting from research. The committee’s own workshop report, cited below, sheds light on upstream issues of participation for women and minorities, and the several listed afterwards, point to downstream issues:
National Academies of Sciences, Engineering, and Medicine, Innovation, Diversity, and the SBIR/STTR Programs: Summary of a Workshop, Washington, DC: National Academies Press, 2015.
The workshop and the workshop summary examined broad demographic trends in the science and engineering workforce, the experiences of SBIR/STTR staff and participants, and ideas and pragmatic approaches put forward by participants to boost the participation of women and minorities.
Gicheva, Dora, and Albert Link, “The Gender Gap in Federal and Private Support for Entrepreneurship, “Working Papers 15-05, University of North Carolina at Greensboro, Department of Economics, 2015, and Dora Gicheva and Albert Link, “Leveraging Entrepreneurship through Private Investments: Does Gender Matter?,” Small Business Economics, Vol. 40, No. 2 (February 2013), pp. 199-210).
These papers use SBIR data collected by the Academies 2005 survey for NIH to explore gender differences in access to investment funds when attempting to develop a new technology. A finding is that female-owned firms are disadvantaged in their access to private investment funding, especially in the West and Northeast regions of the United States. The lower probability that a female-owned firm will receive follow-on private investment funding to help commercialize an SBIR-funded technology can be expected to have a negative impact of the long-run outcome.
Scott, John T. and Troy J. Scott, “The Entrepreneur’s Idea and Outside Finance: Theory and Evidence about Entrepreneurial Roles,” European Economic Review, September 2015.
This paper investigates the problem faced by the entrepreneur seeking outside support for commercialization of a successful technological innovation resulting from research and development. Using the Academies 1999 SBIR data for DoD, results suggest that difficulty in getting outside third-party finance then makes it more difficult to secure other forms of agreements with other firms that would help with the commercialization effort—a finding with direct, negative implications for women- and minority-owned innovative companies participating in the SBIR program.
Link, Albert N., Christopher J. Ruhm, and Donald S. Siegel, “Private Equity and the Innovation Strategies of Entrepreneurial Firms: Empirical Evidence from the Small Business Innovation Research Program,” Managerial and Decision Economics, Vol. 35 (2014), pp. 103-113.
This paper further examines the role of public and private investment on long-term innovation performance. It finds that SBIR firms attracting private equity investments are significantly more likely to license and sell their technology rights and engage in collaborative research and development agreements.
Low participation rates are even more apparent when African American and Hispanic American participation is considered, both as PIs and through company ownership. Here the numbers are extremely small: 2014 Survey respondents reported 2 African American and 12 Hispanic American PIs. It is therefore concluded that NIH is finding minimal success in attracting MOSB participants into the SBIR/STTR programs. Furthermore, declining participation trends are a matter of concern.
The Committee considered the question of whether woman- and minority-owned firms could be assigned a percentage of awards as a way to enhance program diversity. It concluded that the size of the applicant pool of women- and minority-owned businesses is so small that setting quotas would not be as effective as increasing the size of the applicant pool through some of the long-term initiatives that were suggested by speakers in the committee’s workshop.
NIH is aware of this issue and understands the need to improve outreach toward women- and minority-owned businesses as part of its overall outreach efforts.
ANNEX 6-A: ANALYSIS OF NIH DATA RELATING TO THE PARTICIPATION OF WOMAN- AND MINORITY-OWNED BUSINESSES
Woman-Owned Small Businesses
WOSB SBIR Phase I
Across the study period, applications from WOSBs remained relatively flat, averaging 483 annually. The overall decline in SBIR Phase I applications in recent years was mirrored but to a lesser degree for WOSBs (see Figure 6-2).
As a result, the WOSB share of applications increased slightly during the study period, reaching 15.5 percent in FY2013 (see Figure 6-3).
Across the same time period, the success rates for WOSB applicants were consistently lower than those for non-WOSB applicants (see Figure 6-4). They were lower in every year of the study period, and across the period they averaged 14 percent while the non-WOSB success rate averaged 18 percent.
Thus while the share of applications grew, the number of awards made to WOSBs remained essentially flat across the study period, averaging about 66 annually, with a high of 89 in FY2007 (an outlier) and a low of 55 in FY2005. In FY2014, WOSBs received 67 awards.
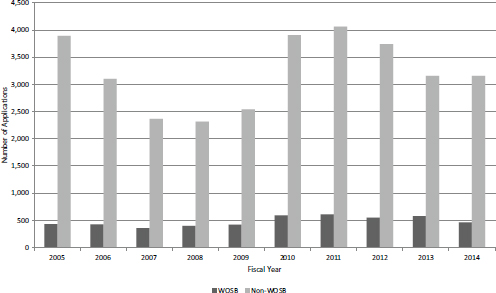
FIGURE 6-2 NIH SBIR Phase I applications from WOSBs and non-WOSBs, FY2005-2014.
SOURCE: Based on NIH RePORTER database, Table T127.
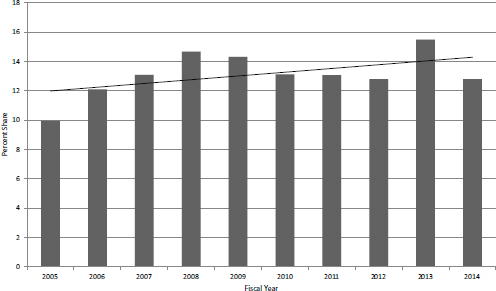
FIGURE 6-3 WOSB percentage share of NIH Phase I SBIR applications, FY2005-2014.
SOURCE: Based on NIH RePORTER database, Table T127.
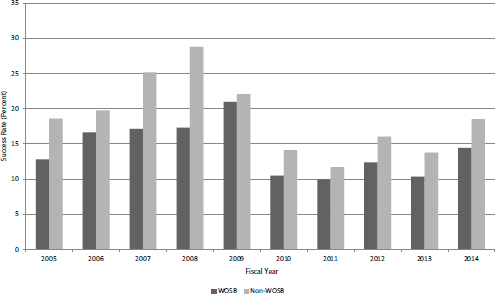
FIGURE 6-4 Success rates for NIH SBIR WOSB and non-WOSB applications, FY2005-2014.
SOURCE: Based on NIH RePORTER database, Table T127.
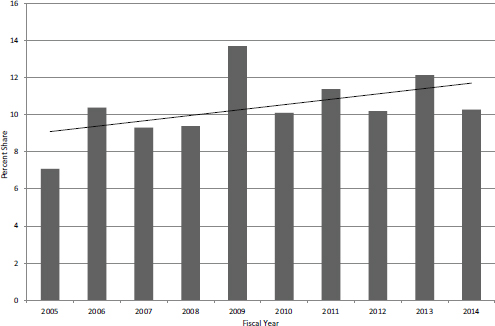
FIGURE 6-5 WOSB share of NIH SBIR Phase I awards, FY2005-2014.
SOURCE: Based on NIH RePORTER database, Table T127.
Overall, the number of Phase I awards declined in recent years, so the percentage of awards made to WOSBs increased slightly (see Figure 6-5). But the share of awards was consistently lower than the share of applications in every year across the study period. Overall, WOSBs accounted for 13 percent of applications and 10 percent of awards.
Finally, NIH awards differ in size. Phase I awards to WOSBs were consistently smaller on average than those to non-WOSBs (see Figure 6-6). WOSBs received smaller awards on average in every year except FY2007. Because the amount applied for is largely at the discretion of the company, explanations for this difference are not obvious. Furthermore, the difference neared or exceeded 10 percent of the average award size in only 3 years. This is a metric that NIH needs to watch closely in coming years.
WOSB SBIR Phase II
Levels of Phase II applications from WOSBs for each year are somewhat higher than the share of relevant Phase I awards (for the previous year) almost without exception. Although the lags between Phase I and Phase II at NIH vary, there is no simple explanation for this pattern. It may simply be that WOSBs have less access to other sources of funding, but that reasoning is speculative. Across
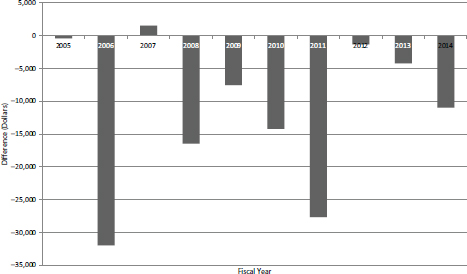
FIGURE 6-6 Difference in size of awards between WOSB and non-WOSB NIH Phase I SBIR awards (dollars), FY2005-2014.
SOURCE: Based on NIH RePORTER database, Table T127.
the study period as a whole, WOSBs accounted for 10.3 percent of Phase I awards and 13.3 percent of Phase II applications. They accounted for 11.9 percent of Phase II awards. (See Figure 6-7.)
As with Phase I, Phase II WOSB success rates were persistently lower than those for non-WOSBs (see Figure 6-8). They were lower in 7 of the 10 years of the study period, on average by 5 percentage points. Also, as with Phase I, the Phase II WOSB share of awards was lower than the share of applications (see Figure 6-9). WOSB shares of awards were lower than the shares of applications for 7 of the 10 years covered by the study.
Average Phase I funding levels for WOSBs are consistently lower than those for non-WOSBs, being lower in all years except FY2007 and FY2013. On average, the first year of Phase II funding was almost $27,000 lower, which would normally translate into a difference of more than $50,000 over the life of a standard 2-year Phase II award (see Figure 6-10).
Minority-Owned Small Businesses
MOSB SBIR Phase I
Figure 6-11 illustrates the number and share of MOSB Phase I applications across the study period. The number and share of applications declined. The latter fell from a high of about 6 percent in FY2006 to 3 percent in FY2014.
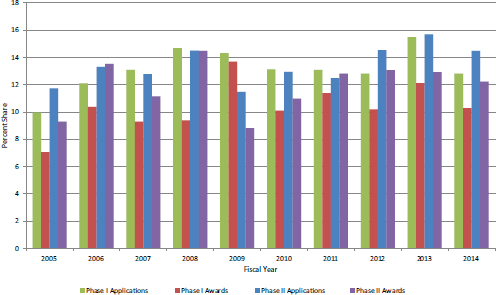
FIGURE 6-7 Patterns of access: WOSB Phase I applications, Phase I awards, Phase II applications, and Phase II awards, FY2005-2014.
SOURCE: NIH Division of Statistical Analysis and Reporting, Table 127.
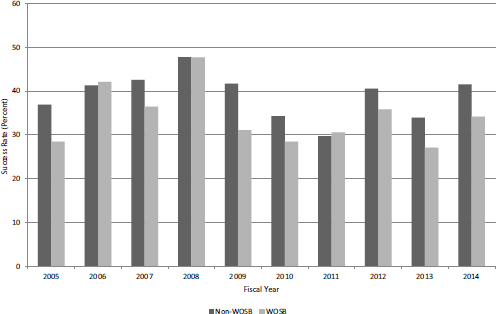
FIGURE 6-8 Success rates for WOSB and non-WOSB NIH Phase II SBIR applications, FY2005-2014.
SOURCE: NIH Division of Statistical Analysis and Reporting, Table 127.
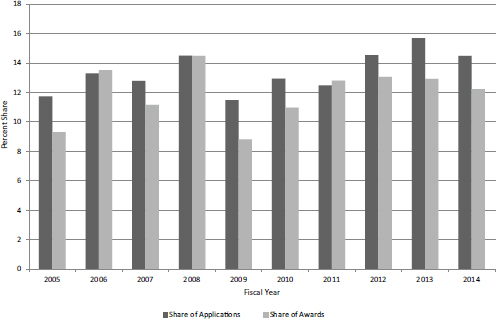
FIGURE 6-9 WOSB percentage shares of NIH Phase II awards and applications, FY2005-2014.
SOURCE: NIH Division of Statistical Analysis and Reporting, Table 127.
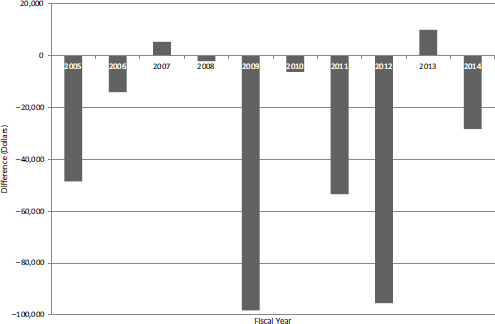
FIGURE 6-10 Average size of first-year Phase II SBIR grants to WOSB and non-WOSB applicants, FY2005-2014.
SOURCE: NIH Division of Statistical Analysis and Reporting, Table 127.
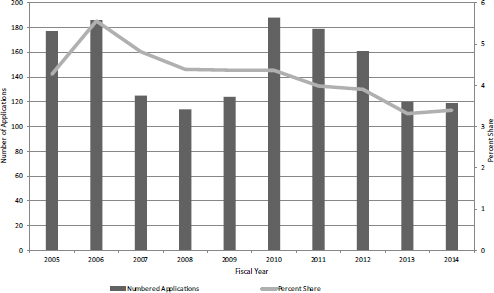
FIGURE 6-11 Number of MOSB Phase I SBIR grant applications and percentage share of all applications, FY2005-2014.
SOURCE: NIH Division of Statistical Analysis and Reporting, Table 127.
Declining application rates are reinforced by relatively low success rates. Phase I success rates for MOSBs were lower than those for non-MOSBs in every year of the study period, and in some years were barely half. The average success rate for MOSB applications was 11.5 percent, while that of non-MOSB applications was almost 18 percent (see Figure 6-12).
As a result the number and share of MOSB awards declined across the period. The number of Phase I awards to MOSBs decreased from 24 in FY 2005 and FY2006 to 11 in FY2013 and 12 in FY2014. The share of awards fell from a peak of 3.5 percent in FY2006 to less than 2 percent in FY2014 (see Figure 6-13).
MOSB Phase II SBIR Awards
The small number of Phase I awards made to MOSBs means that the pool of potential applicants is also small, which is reflected in the low numbers of SBIR Phase II grant applicants (see Figure 6-14). However, the MOSB percentage of all Phase II applications rebounded in FY2014 after several years of steady declines. In recent years MOSB Phase II applicants accounted for a higher percentage of the total applicants than they did for Phase I awards. This suggests either that MOSB firms are more committed to the SBIR program or that their projects are more successful at Phase I, permitting relatively more to apply for Phase II.
Success rates for MOSB Phase II applicants are lower than those for non-MOSB Phase II applicants. Figure 6-15 shows the gap: MOSB rates are lower in
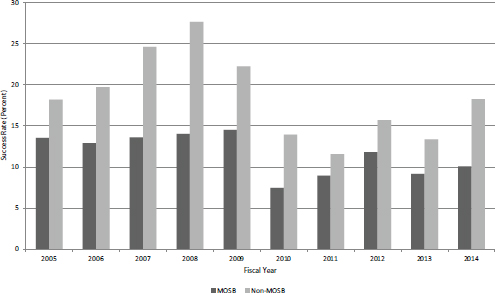
FIGURE 6-12 Success rates for MOSB and non-MOSB NIH Phase I SBIR applications, FY2005-2014.
SOURCE: NIH Division of Statistical Analysis and Reporting, Table 127.
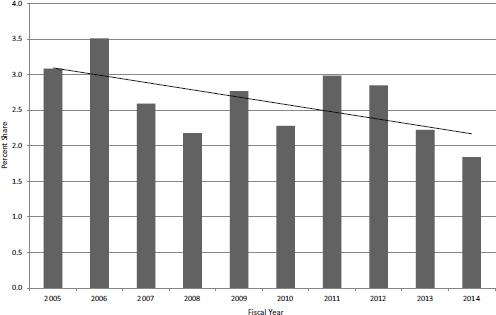
FIGURE 6-13 MOSB percentage share of Phase I SBIR awards, FY2005-2014.
SOURCE: NIH Division of Statistical Analysis and Reporting, Table 127.
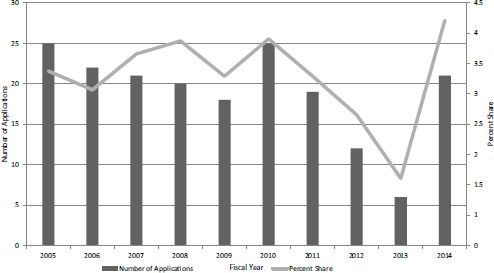
FIGURE 6-14 MOSB applications and percent share of all SBIR Phase II applications, FY2005-2014.
SOURCE: NIH Division of Statistical Analysis and Reporting, Table 127.
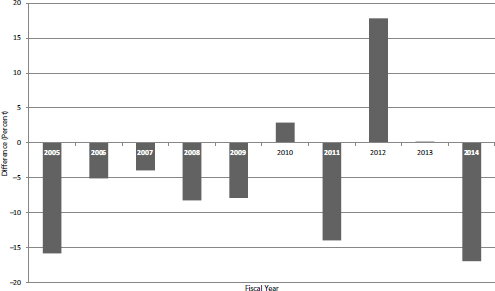
FIGURE 6-15 Difference between success rates of MOSB and non-MOSB SBIR Phase II applicants, FY2005-2014.
SOURCE: NIH Division of Statistical Analysis and Reporting, Table 127.
every year except FY2012 and FY2010 and are on average 6 percentage points lower, at 32 percent for MOSB compared to 38 percent for non-MOSBs.
As a result of the small applicant pool for Phase II and the lower success rates, MOSBs won only a handful of Phase II SBIR awards at NIH—receiving a maximum of nine grants in any year of the study period. The share of awards dipped to a low of 1 percent in FY2013 before rebounding to 2 percent in FY2014 (see Figure 6-16). These figures all reflect the expansive definition of “minority” provided by SBA, which includes Asian-owned firms. The numbers of African Americans, Hispanic Americans, and Native Americans would all likely be lower (as we found through the 2014 Survey, whose findings are discussed above).
MOSB award sizes were also considerably lower than those for non-MOSBs, being on average almost $70,000 smaller in the first year, which translates into a gap of about $140,000 over the life of a standard 2-year award. Figure 617 shows a gap in award size in every year except FY2009; the substantial variations year to year are in part explained by the low number of awardees (less than 10 per year).
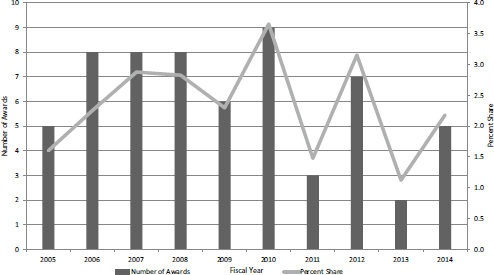
FIGURE 6-16 MOSB SBIR Phase II awards and percent share of all such awards, FY2005-2014.
SOURCE: NIH Division of Statistical Analysis and Reporting, Table 127.
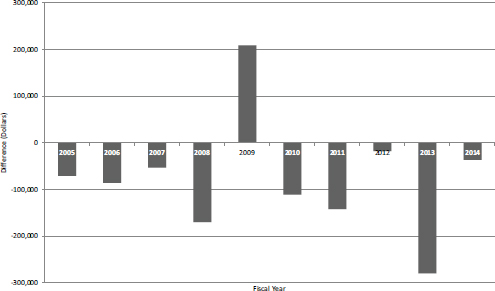
FIGURE 6-17 Difference in first-year award size for MOSB and non-MOSB SBIR Phase II awardees, FY2005-2014.
SOURCE: NIH Division of Statistical Analysis and Reporting, Table 127.


