
While there are many success stories from individual projects and companies published on agency websites, quantitative data on outcomes is difficult to acquire. Yet the need to move beyond individual cases remains; this chapter presents a more systematic view of program outcomes through the use of survey tools.
Tracking SBIR/STTR outcomes is a work in progress. Some agencies have their own outcomes collection systems and metrics, while others are seeking to connect to the emerging data collection system at the Small Business Administration (SBA). However, the SBA data collection system is not yet complete, and no outcomes data are available from SBA as of August 2015. Thus, analysis of outcomes presented in this chapter is based on the 2011-2014 Survey of Phase II SBIR/STTR recipients at the five major research agencies (Department of Defense [DoD], National Science Foundation [NSF], National Institutes of Health [NIH], Department of Energy [DoE], and National Aeronautics and Space Administration [NASA]). The survey covered awards made in fiscal years (FY) 1998-2007 for DoD, NSF, and NASA and FY20012010 for NIH and DoE, inclusive. These agencies have all operated the STTR program since 1993.
The survey focuses primarily on outcomes related to the congressional objective for the program, as well as on commercialization outcomes and longer term impacts on the recipient companies themselves. Appendix G includes more detailed tables and analysis. Where useful, results for SBIR awards are also provided for context.
A detailed description of the methodology underlying the Academies survey is provided in Appendix A of this report. The full text of the survey questionnaire is provided in Appendix C. Questions in general focused on the individual project funded under the program. For the case of information gathered about companies as opposed to individual projects, multiple responses from the same company were aggregated and then averaged to provide a better
BOX 5-1
Survey Response Rate and Non-Respondent Bias
As noted in the introduction to this report, and described in detail in Appendix A, the committee recognizes the limitations of the survey effort underlying the data presented in this chapter. The survey covered 1,400 STTR awards made by the five study agencies during the period FY1998-2010. There was a recorded point of contact for each of the 1,400 awards. This is the preliminary survey population. Awards made in FY2010 would only have started to generate commercial products by the time of the survey in FY2014, so following established practice from prior Academies and GAO surveys, no awards made after FY2010 were surveyed. Given the time period covered, it is unsurprising that many points of contact could not be reached. Of the 1,400 contacts comprising the preliminary survey population, 807 could not be reached, leaving an effective population of 593. Of these, 292 answered questionnaires, generating a response rate of 20.9 percent for the preliminary population and 49.2 percent for the effective population.
The committee acknowledges that because no information was gathered from non-respondents, the data are likely to be biased toward surviving firms. At the same time, the committee notes that successful PIs who left the original firm to start a new venture and successful firms which merged or were bought out by other firms are also excluded from the results. The committee suggests that, where feasible, future assessments of the SBIR program include comparisons of non-awardees, such as in matched samples (Azouley et al., 2014), or regression discontinuity analysis (Howell, 2015). In addition, future assessments should document the root cause of non-responsiveness though this will require agency staffs do a better job of maintaining award databases with routine updates of PI contact information. For example, determining whether the company is still in business even if the PI is no longer with the firm could provide useful evidence about the effectiveness of the SBIR award.
view of company-level activities. In all cases, number of responses (N) is provided in each table and figure.
CONNECTING RESEARCH INSTITUTIONS (RIs) TO SMALL BUSINESS CORPORATIONS (SBCs)
STTR has only one congressionally mandated objective: to enhance the connection between SBCs and RIs (see Chapter 1 for a history of the program). Given that STTR projects require an RI as a partner, it is not surprising that the
percentage reporting any RI involvement in the STTR project is very high (95 percent) and much higher than for SBIR projects (46 percent) (see Table 5-1).
There were also substantial differences between SBIR and STTR with regard to the kind of university linkage (see Table 5-1):
- Thirty-two percent of STTR respondents reported that the principal investigator (PI) was a university faculty member, compared to only 3 percent of SBIR respondents. This reflects the SBIR mandate that the PI must work more than 50 percent at the SBC, making it much harder to be simultaneously the PI of an SBIR project and a faculty member.
- Seventy percent of STTR projects reported using a faculty member as a subcontractor (compared to 26 percent for SBIR respondents).
- More than twice as many STTR respondents reported that faculty members worked on the project as a consultant (53 percent) as did SBIR respondents (26 percent).
- Similarly, many more STTR projects reported that graduate students worked on the project (51 percent compared to 20 percent for SBIR).
- STTR projects were also much more likely to report that they licensed technology from the RI (18 percent compared to 7 percent for SBIR).
- Finally, STTR projects were also much more likely to report that the project’s technology was originally developed at the RI by a project team member (29 percent as compared to 11 percent for SBIR).
TABLE 5-1 STTR Project Connections to Research Institutions (RIs)
| Percentage of Responses | ||
| STTR Awardees | SBIR Awardees | |
| The PI for this project was at the time of the project an RI faculty member | 32.3 | 2.8 |
| The PI for this project was at the time of the project an RI adjunct faculty member | 2.3 | 5.3 |
| Faculty member(s) or adjunct faculty member(s) worked on this project in a role other than PI | 53.0 | 26.0 |
| Graduate students worked on this project | 51.1 | 20.3 |
| The technology for this project was licensed from an RI | 18.4 | 6.9 |
| The technology for this project was originally developed at an RI by one of the participants in this project | 29.3 | 11.1 |
| An RI was a subcontractor on this project | 70.3 | 25.8 |
| None of the above | 4.5 | 53.7 |
| BASE: TOTAL RESPONDENTS ANSWERING QUESTION | 266 | 1,795 |
SOURCE: 2011-2014 Survey, Question 71.
STTR also connects SBCs to a considerable number of different RIs. Survey respondents reported 292 projects connected to 167 different RIs.1 About a quarter of STTR respondents indicated that this was a new connection.2
STTR respondents were asked about the impact of the award on their relationship with the RI. Despite the difficulties described by some respondents and interviewees described in Chapter 4, 71 percent of respondents said that the award substantially or somewhat enhanced that relationship, while just 5 percent said that it worsened the relationship (see Table 5-2). Almost three-quarters of STTR respondents indicated that they had a preexisting relationship with the RI already in place, which suggests that creating new relationships is perhaps a less important feature of the program.3
Beyond direct connections between RIs and SBCs, there are other metrics that illustrate knowledge effects that derive from the STTR program. Patents and peer-reviewed papers offer an appropriate starting point.
About one-half of STTR respondents claimed that their company was awarded at least one patent related to any STTR- or SBIR-funded technology; 6 percent of these respondents reported at least 10 related patents (see Figure 5-1). Firms reporting on the basis of an SBIR award on average reported more than twice as many patents than those reporting on the basis of an STTR award.
The questionnaire also asked about intellectual property related to the specific award being surveyed. Forty-two percent of STTR respondents reported receiving at least one patent related to the surveyed technology. Two percent reported receiving five or more related patents (see Figure 5-2). There were no significant differences between SBIR and STTR respondents.
In addition to patents, the survey asked about articles published in peer-reviewed journals. Interviews with company executives indicated that, even though technical knowledge and trade secrets are very important, many companies strongly supported peer-reviewed publication. In part, companies saw this as marketing among peers, both for eventual products and a means of
TABLE 5-2 STTR Impacts on SBC-RI Relationships
| Percentage of Responses | |
| Substantially enhanced it | 37.8 |
| Somewhat enhanced it | 33.2 |
| Made no real difference | 23.7 |
| Made it somewhat worse | 4.6 |
| Made it substantially worse | 0.8 |
| BASE: STTR AWARD RECIPIENTS | 262 |
SOURCE: 2011-2014 Survey, Question 74.
________________
12011-2014 Survey, Question 72. N=167.
22011-2014 Survey, Question 75. N=263.
32011-2014 Survey, Question 75.
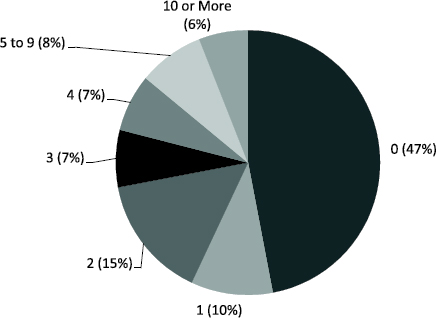
FIGURE 5-1 Number of patents related to all company SBIR/STTR awards (percentage of STTR company-weighted responses).
SOURCE: 2011-2014 Survey, Question 12. N=155.
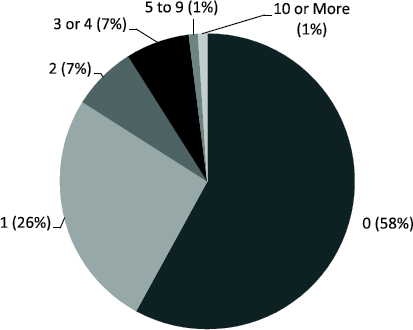
FIGURE 5-2 Patents related to surveyed STTR project.
SOURCE: 2011-2014 Survey, Question 38.1. N=196.
attracting talent. Eighty-two percent of STTR respondents reported publishing at least one peer-reviewed article related to the surveyed project. Forty-six percent reporting publishing at least three such papers (see Figure 5-3).
Conclusions: The STTR Impact
Overall, the university connection is much deeper and richer for STTR awards than for SBIR. This is a central conclusion of the report because it suggests that STTR does provide a different set of outcomes than SBIR and that it does address its specific congressional mandate to stimulate partnerships between SBCs and RIs to an extent that SBIR does not.
Data from the Academies survey shows that STTR companies are especially closely connected to universities. Ninety-five percent of respondents reported a university connection on the surveyed project, a figure far higher than that for SBIR respondents (46 percent); STTR respondents report much higher connection to RIs for every subcategory of connection as well. About one quarter of STTR respondents indicated that the award had helped generate a new connection to an RI, while 71 percent indicated that the award had helped improve an existing connection.
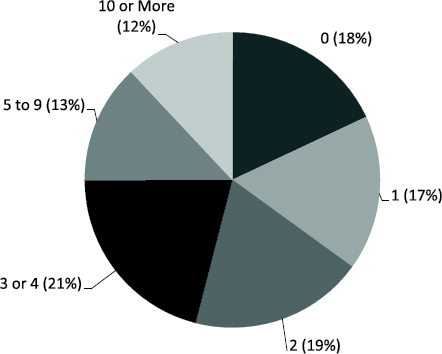
FIGURE 5-3 Number of peer-reviewed articles related to surveyed STTR project (percentage of respondents).
SOURCE: 2011-2014 Survey, Question 39.4.2, N=215.
However, SBCs also report that STTR awards are much harder to manage than SBIR awards: only 3 percent thought STTR awards were easier to manage, while 45 percent thought they were harder.4
What emerges from these data is a picture of companies that are dynamic centers of technological innovation, a considerable amount of which is protected through the patent system. About one-half of STTR companies reported that they had received at least one patent based on their work under STTR contracts, while 42 percent reported at least one patent related to the surveyed project only.
STTR companies participate at a high level in the standard forms of technical knowledge dissemination: publishing in peer-reviewed journals and patenting. Eighty-two percent of STTR respondents reported that their company published at least one article based on the STTR-funded work, and 46 percent reported publication of three or more such papers.
COMMERCIALIZATION
As with previous Academies reports on the SBIR program, a broad view of commercialization was adopted, taking it to include additional investments in technology development from outside the SBIR or STTR program as well as sales and licensing revenues. Having determined that no single metric can appropriately capture such a broad concept, and given the long time to market required for many life sciences technologies, a range of benchmarks and metrics have been included.
That said, the focus here is first on different ways of measuring sales and other types of commercial revenue as well as additional investment. In line with previous studies by the Academies and consistent practice at all agencies, additional investment beyond Phase II equates to acknowledgement by third parties that the project has developed technologies of marketable value. For many projects, additional investment is required before commercial sales can begin.
Project-related Revenues
While avoiding overreliance on a single metric, the single most used metric for assessing the STTR and SBIR programs has been project-related revenues.5
________________
42011-2014 Survey, Question 80. N=211.
5For example, National Research Council, An Assessment of the Small Business Innovation Research Program at the National Institutes of Health, Washington, DC: The National Academies Press, 2009. Effective July 1, 2015, the institution is called the National Academies of Sciences, Engineering, and Medicine. References in this report to the National Research Council or NRC are used in an historic context identifying programs prior to July 1.
Reaching the Market
The first survey question reported in this section concerns reaching the market: Did the project generate any sales, and if not, are sales expected? (The latter is a necessary add-on question given the long cycle time of some projects.) This question asks about sales and not about other revenues. Responses are summarized in Figure 5-4.
Overall, about 40 percent of STTR projects reported some sales or licensing revenues to date, and a further 28 percent expected sales in the future.
Amount of Sales and Licensing Revenues
The percentage of projects reaching the market is an important metric, but it is not sufficient; it is also necessary to understand the distribution of sales. The 2011-2014 Survey asked those who reported sales of the technology developed for the project to, in addition, report the amount of sales, grouped into ranges. These data are summarized in Figure 5-5.
Most respondents reported sales at the lower end of the scale: 62 percent were less than $500,000. One percent reported sales of at least $20 million, while about 5 percent reported sales of between $5 million and $20 million.6
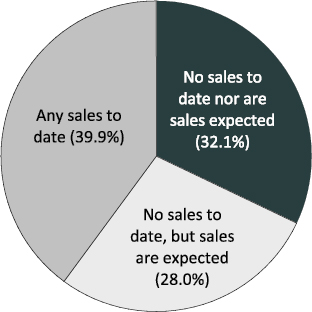
FIGURE 5-4 STTR sales outcomes (percentage of responses).
SOURCE: 2011-2014 Survey, Question 32. N=271. See Table G-7 for details.
________________
6Totals in Figure 5-5 do not match Table G-8 exactly because the former were rounded to whole numbers.
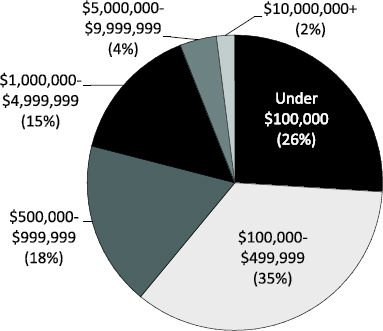
FIGURE 5-5 Distribution of total sales, by dollar range (percentage of responses).
SOURCE: 2011-2014 Survey, Question 34. N=95 (projects reporting sales>$0). See Table G-8 for details.
Markets by Sector
The 2011-2014 Survey asked respondents about the market sectors in which sales were made. Overall, 40 percent identified the domestic private sector, followed by export markets (17 percent). (see Table 5-3).
Additional Investment
The ability of STTR projects and companies to attract additional investments has traditionally been a defining metric for commercialization outcomes.7 Seventy-one percent of STTR survey respondents indicated that their company received additional investment in the technology related to the surveyed project. As with prior surveys, there is substantial skew with regard to
________________
7See National Research Council, An Assessment of the SBIR Program, Washington, DC: The National Academies Press, 2008.
TABLE 5-3 Markets for STTR Products and Services
| Percentage of Total Sales | ||
| STTR Awardees | SBIR Awardees | |
| Domestic private sector | 39.8 | 39.0 |
| Export markets | 16.6 | 11.5 |
| Department of Defense (DoD) | 14.4 | 17.4 |
| NASA | 2.0 | 2.7 |
| Prime contractors for DoD | 10.4 | 10.5 |
| Prime contractors for NASA | 0.5 | 0.9 |
| Agency that awarded the Phase II (if not NASA or DoD) | 1.8 | 1.2 |
| Other federal agencies | 3.5 | 4.2 |
| State or local governments | 0.4 | 2.5 |
| Other | 10.6 | 10.1 |
| BASE: ANY SALES RESULTING FROM THE PROJECT | 99 | 889 |
NOTE: Respondents were asked to provide a percentage breakdown by market. The table shows the mean of responses for each category.
SOURCE: 2014 Survey, Question 35.
the amount of additional funding received: 46 percent of respondents who received additional investment reported receiving less than $100,000, while slightly less than 1 percent reported more than $20 million in additional funding. (See Table 5-4.)
There has also been interest in the sources of additional funding for high-tech innovation. Although the United States has historically been a leader in venture capital and angel investment, these are not the only or even the primary sources of additional funding for STTR projects (see Table 5-5). Of those STTR projects that reported additional funding (N=189), 54 percent reported additional funding from internal sources, 46 percent from non-SBIR/STTR federal sources, and 32 percent from other external sources such as state governments and foundations. Fifteen percent reported investments from strategic partners, six percent reported venture capital funding, and 3 percent reported funding from angel and other private equity investors. (See Table 5-5.)
COUNTERFACTUALS
Because there is no available matched set of companies that did not receive STTR funding at precisely the point in time that surveyed companies did receive Phase II funding, it is not possible to develop an appropriate control group against which to measure impacts (see the discussion of Academies efforts to do so in Appendix A).
TABLE 5-4 Additional Funding by Program and Amount
| Percentage of Responses | ||
| STTR Awardees | SBIR Awardees | |
| None ($0) | 29.2 | 31.3 |
| Under $100,000 | 46.2 | 47.1 |
| $100,000-$499,999 | 9.5 | 8.5 |
| $500,000-$999,999 | 6.1 | 4.3 |
| $1,000,000-$4,999,999 | 7.2 | 6.2 |
| $5,000,000-$9,999,999 | 0.8 | 1.1 |
| $10,000,000-$19,999,999 | 0.4 | 0.7 |
| $20,000,000-$49,999,999 | 0.8 | 0.6 |
| $50,000,000 or more | 0.2 | |
| Mean (Thousands of Dollars) | 691.7 | 832.1 |
| Median (Thousands of Dollars) | 50 | 50 |
| BASE: TOTAL RESPONDENTS ANSWERING QUESTION | 264 | 1,827 |
NOTE: STTR and SBIR data are aggregated over all five agencies for FY 1998–2007 for DoD, NSF, and NASA and FY2001–2010 for NIH and DoE, inclusive.
SOURCE: 2011-2014 Survey, Question 30.
However, it is at least possible to ask—as previous Academies and Government Accountability Office (GAO) surveys have done—what the company itself believed might have happened had STTR funding not been available. Although this is of course subjective, the company is best suited to provide these answers.
Because alternative funding especially for long-cycle projects is difficult to acquire, it is not surprising that only 9 percent of respondents believed that the project would definitely or probably have gone ahead without funding. Conversely, three-quarters of respondents said that the project would probably or definitely not have proceeded.8
These data have interesting wider implications for debates about early-stage funding; notably, they suggest weak support for the “crowding out” hypothesis (that public funding displaces private investment). Awardees in our survey—presumably those with the closest knowledge of funding prospects for the project—overwhelmingly believed it to be unlikely that alternative private funding would be found. These results also underscore the importance of SBIR/STTR funding for these small companies.
________________
82011-2014 Survey, Question 24.
TABLE 5-5 Distribution of Additional Investment by Source of Funds
| Percentage of Responses | ||
| STTR Awardees | SBIR Awardees | |
| Non-SBIR/STTR federal funds | 45.5 | 39.5 |
| Private Investment: U.S. Sources | 30.2 | 35.6 |
|
Venture capital (VC) |
6.3 | 5.4 |
|
U.S. angel funding or other private equity investment (not VC) |
3.3 | 8.4 |
|
Friends and family |
5.3 | 4.3 |
|
Strategic investors/partners |
15.3 | 13.1 |
|
Other sources |
11.1 | 15.3 |
| Foreign Investment | 2.6 | 4.0 |
| Other External Sources | 32.3 | 14.2 |
|
State or local governments |
16.9 | 10.7 |
|
Research institutions (such as colleges, universities or medical centers) |
17.5 | 4.4 |
|
Foundations |
3.2 | 1.0 |
| Internal Sources | 54.0 | 69.9 |
|
Your own company (Including money you have borrowed) |
45.5 | 62.1 |
|
Personal funds |
14.3 | 17.3 |
| BASE: TOTAL RESPONDENTS ANSWERING QUESTION | 189 | 1,239 |
NOTE: Responses for subcategories do not total to categories because more than one response was permitted.
SOURCE: 2011-2014 Survey, Question 31.
COMPANY IMPACTS
Although the effect of STTR funding on the company is not directly included in the congressional objectives for the program, helping small companies to become self-sufficient (and in some cases to grow rapidly) has implications for program impacts and is therefore included in this analysis. Thirty-six percent of STTR respondents reported that the award had at least in part supported company formation.
Small high-tech companies are often fluid in structure, and the 2011-2014 Survey found that many participating companies had changed structurally in recent years. Sixteen percent had established strategic partnerships with major players, while 12 percent had spun-off at least one company and the same percentage had been acquired by or merged with another firm.
Ideally, companies that receive SBIR/STTR funding become more stable and develop other contracts and revenues over time. This appears to be the case for STTR recipient companies because dependence on SBIR/STTR funding is limited. Overall, 48 percent of STTR respondents indicated that SBIR/STTR funded 10 percent or less of total R&D effort, while 28 percent
overall indicated that it funded greater than one-half. This picture is reinforced by data on sources of company revenues. Thirty-one percent of STTR companies reported zero SBIR/STTR revenues, while about 24 percent reported receiving greater than one-half of the company’s revenues from SBIR/STTR in their most recent fiscal year.
The survey also asked about the overall impact of SBIR/STTR on the company. As Figure 5-6 shows, 32 percent of survey respondents saw a highly positive or transformative effect, and another 46 percent reported a positive impact.
PARTICIPATION OF WOMEN AND MINORITIES
The SBIR program is mandated by Congress to foster the participation of women and minorities. As noted in Chapter 1, the STTR program is not subject to such a mandate. However, we believe that it is still useful to determine levels of participation for women and minorities in the STTR program at the five study agencies. In following the methodologies developed for previous assessments of the agency SBIR programs, the Committee
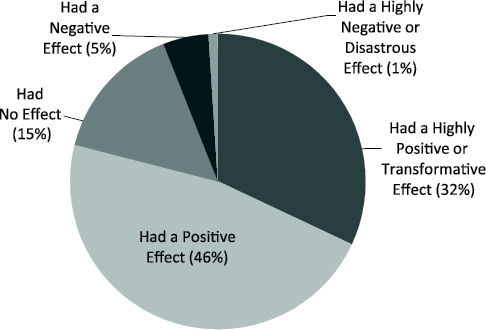
FIGURE 5-6 Long-term impact of SBIR/STTR on companies.
SOURCE: 2011-2014 Survey, Question 57. N=267.
reviewed survey data to examine the participation of women and minorities through company ownership and as principal investigators (PIs).
Awards data from the Small Business Administration (SBA) are not included in this assessment because a comparison between selected agency data and SBA data indicated that the latter does not reliably report company ownership.
Participation of Woman-owned Firms
Figure 5-7 shows that woman-owned firms accounted for 8 percent of the respondent firms for all five study agencies.
This percentage was lower than the 10.6 percent for SBIR.
Woman Principal Investigators
Because PIs are an important part of the pipeline that eventually leads to scientists and engineers forming their own companies, the Academies survey sought information about the percentage of PIs who were women (see Figure 5-8).
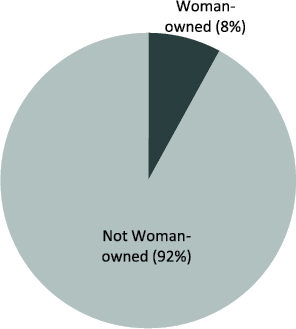
FIGURE 5-7 Woman-owned firms among Phase II STTR projects at five study agencies, 1997-2010 (percentage of responses).
SOURCE: 2011-2014 Survey, Question 15. N=263.
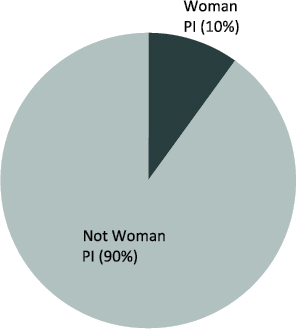
FIGURE 5-8 Woman PIs for Phase II STTR projects at five study agencies, 1997-2010 (percentage of responses).
SOURCE: 2011-2014 Survey, Question 16. N=270.
Survey respondents reported that women constituted 10 percent of STTR PIs, which is slightly higher than the percentage reported for SBIR (8.9 percent).
Minority-owned Firms
The Academies survey also addressed the question of minority-owned firms. Overall, survey respondents reported that 9.1 percent of STTR firms were minority-owned at the time of the award. This was the same percentage reported for SBIR. Following the methodology established in previous reports, the survey also asked about the minority affiliation of the ownership (see Table 5-6).
The percentages for STTR are closely similar to those for SBIR. In both cases, the number of firms owned by Black, Hispanic, and Native American owners is extremely small: among STTR companies the survey identified three Black-owned firms, three Hispanic-owned firms, and one Native American-owned firm.
Minority Principal Investigators
The Academies survey also inquired about the incidence of minority PIs. Table 5-7 shows that about 14 percent of respondents indicated that surveyed project had a minority PI but that a large majority of these were Asian-Americans.
A NOTE ON TALENT PATHWAYS
Woman- and minority-owned firms result from a series of pathways that stretch back to the varied participation of students in K-12 in science-oriented programs, through college-level choices, graduate schools, postdoctoral programs, and then employment in science and engineering fields.
TABLE 5-6 Minority-Owned Firms: Participation in STTR, 1998-2011
| Percentage of Responses | ||
| Minority Ownership | STTR Awardees | SBIR Awardees |
| Asian Indian | 4.6 | 3.5 |
| Asian Pacific | 2.3 | 3.4 |
| Black | 1.1 | 0.3 |
| Hispanic | 1.1 | 1.5 |
| Native American | 0.4 | 0.2 |
| Other | 0.4 | 0.3 |
| Not minority | 89.9 | 89.9 |
| N= | 263 | 1,789 |
NOTE: Percentages do not sum to 9.1 because multiple responses were permitted.
SOURCE: 2011-2014 Survey, Question 15.
TABLE 5-7 Minority PIs for STTR/SBIR Awards, 1997-2011
| Percentage of Responses | ||
| STTR Awardees | SBIR Awardees | |
| Asian Indian | 4.1 | 4.1 |
| Asian Pacific | 4.1 | 5.1 |
| Black | 0.7 | 0.2 |
| Hispanic | 3.0 | 1.3 |
| Native American | 0.7 | 0.2 |
| Other | 1.5 | 0.5 |
| Not a minority | 85.9 | 88.7 |
| N= | 270 | 1,856 |
SOURCE: 2011-2014 Survey, Question 16.
At each stage, the population of women and minorities changes, as it does when considering the individual pathways for specific disciplines. For example, women account for more than 50 percent of PhDs in life sciences, but their numbers have recently been falling from already low levels in computer science PhD programs.
From the STTR programs’ perspective, a key question is whether participation reflects the distribution of the available talent: whether the numbers reflect the current distribution of potential applicants from woman- and minority-owned firms, and whether the current selection procedures are fair. Reviewing applications and awards data is an important exercise in determining the latter. Other reports have recommended that agencies (particularly NSF) work with experts to find new methodologies for measuring the universe of potential applicants.9
________________
9See National Science Board, Revisiting the STEM Workforce, A Companion to Science and Engineering Indicators 2014, Arlington, VA: National Science Foundation (NSB-2015-10), 2015. See also National Research Council, Expanding Underrepresented Minority Participation: America's Science and Technology Talent at the Crossroads, Washington, DC: The National Academies Press, 2011.


