
Appendix D
Additional Information on Data and Methods Used for Analysis
This appendix supplements Chapters 3, 4, and 5 with additional detail on specific features of the data used in the study and the analyses that were performed. The supplemental discussion of study data focuses on the process used to gather data on cause of death among the members of the study population, particularly those who died before 1979; the choice of health outcomes to be used as endpoints in the analyses; the approach used to represent the likely variation among the veterans of the Shipboard Hazard and Defense (SHAD) tests in exposure to test substances and potential exposure modifiers; and the selection of comparison groups to be used in the analyses of health outcomes in populations of special interest. Additional detail on the study’s analyses addresses the selection of analyses to perform; Kaplan-Meier and Cox regression models for survival data, including consideration of competing risks and ship-clustering in analyses of specific causes of death; and correction for multiple comparisons.
DATA CONSIDERATIONS
Ascertainment of Cause of Death
Deaths from 1979 Through 2011
Information on deaths that have occurred in the United States since January 1979 can be obtained from the National Death Index (NDI). NDI is operated by the National Center for Health Statistics (NCHS, 2015) and is a compilation of information from death certificates issued by states. A service called NDI Plus provides the codes from the International Classification of Diseases (ICD) (WHO, 2015) for the underlying cause of death as indicated on the death certificate. The codes are assigned in accordance with the version of the ICD in use at the time the death occurred.
A total of 4,068 men in the study population were identified as having died by December 31, 2011, which was the conclusion of the follow-up period. Of these deaths, 2,357 occurred between January 1, 1979, and December 31, 2004, and were included in the SHAD I study (IOM, 2007). The information on cause of death that was gathered from NDI for the SHAD I study was used again in the SHAD II study.
Of the other deaths in the study population, 1,334 were men identified as having died between January 1, 2005, and December 31, 2011. Information on the cause of death was obtained directly from NDI Plus. Criteria for identifying a match between a record in the SHAD database and a record in the NDI database were agreement on all nine digits of the social security number, first and last name, and date of birth. The cause-of-death information was received in electronic form. No information on cause of death was obtained for 175 of the 3,694 deaths that occurred between 1979 and the end of December 2011.
Deaths Before 1979
In the study population 374 deaths are recorded as having occurred before January 1, 1979. Of these, cause of death was identified for 191 and was not for 184. Identifying the causes of these “early” deaths required determining the state in which the person died and submitting a request to the state’s vital records office for a copy of the death certificate. However, place of death is not reliably recorded in the study population’s records from the Department of Veterans Affairs (VA) and the Department of Defense (DoD). And when a place of death is known, each state has its own procedures and requirements for processing requests for death certificates. For the SHAD I study it did not prove feasible to undertake the collection of death certificates from individual states. As a result, that study included analyses of the timing of deaths but not the causes of pre-1979 deaths.
For the SHAD II study, an effort was made to obtain information on the causes of as many of these early deaths as possible. To identify the states where the deaths had occurred information from deceased veterans’ VA and DoD records on residence and claims processing was supplemented with searches of electronic death indexes maintained by some states and other online genealogic resources that provide information about date, location, and in a few cases, cause of death.
Requests for death certificates were submitted to 34 states, the District of Columbia, and the Philippines, resulting in the receipt of 184 death certificates from 28 states. Death certificates were received from the states of Arizona, California, Colorado,1 Connecticut, Florida,2 Georgia, Hawaii, Illinois, Indiana, Kentucky, Louisiana, Maryland,3 Michigan, Minnesota, Mississippi, Missouri,4 Nebraska, New Jersey, North Carolina, Ohio, Oregon, Pennsylvania, South Carolina, Tennessee,5 Utah, Virginia, Washington, and Wisconsin. Requests were also submitted to Alabama, Arizona, the District of Columbia, Massachusetts, Nevada, the Philippines, and Rhode Island; but the requested death certificates were not located. The procedures to obtain access to
______________
1 These data were supplied by the Health Statistics Section of the Colorado Department of Public Health and Environment, which specifically disclaims responsibility for any analyses, interpretations, or conclusions it has not provided.
2 The Florida Department of Health is acknowledged for their contribution of data. Conclusions are those of the authors and do not necessarily reflect the opinion of the Florida Department of Health.
3 Certain data were provided by the Vital Statistics administration, Maryland Department of Health and Mental Hygiene, Baltimore, Maryland. The Department of Health and Mental Hygiene disclaims responsibility for any analyses, interpretations, or conclusions.
4 Some of the data used in this report was acquired from the Missouri Department of Health and Senior Services (DHSS). The contents of this document, including data analysis, interpretation, or conclusions are solely the responsibility of the authors and do not represent the official views of DHSS.
5 Vital records data were provided by the Tennessee Department of Health, Division of Policy, Planning, and Assessment, Office of Health Statistics.
death records were not successfully completed for deaths thought to have occurred in Iowa, New York, Oklahoma, and Texas. Death certificates were not sought from the states of Alaska, Delaware, Idaho, Kansas, Maine, Montana, New Hampshire, North Dakota, South Dakota, Vermont, West Virginia, or Wyoming because there were no indications that early deaths in the SHAD study population had occurred there.
Upon receipt of a death certificate from a state, the dates of death and birth were compared with the information in the study’s database to confirm that match was correct. For confirmed matches, a study case number was assigned to the death certificate. Identifying information was redacted, and the redacted document was sent to a nosologist who coded the underlying cause of death according to the ninth and tenth revisions of the ICD. The nosologist had no knowledge of whether the decedent was a SHAD test participant or a member of the comparison group.
Other online sources produced information on the causes of an additional 14 early deaths. These sources included the Combat Area Casualties Current File, which provided information for 13 of these deaths. The Combat Area Casualties Current File hold final records of service members who died in Southeast Asia or are listed as missing in action from 1956 through 1998 (National Archives, 2015). The records were updated as of December 1998. A search of the U.S. Find A Grave Index (Tipton, 2015) produced information on the cause for the other death in this group. Information on the causes of these 14 deaths was sent to the nosologist for ICD coding.
Choice of Study Endpoints
Because a large number of health outcomes (e.g., deaths from various causes, inpatient or outpatient care for various illnesses) could be investigated for possible association with SHAD exposure, the committee used two approaches to guide its work. One approach was hypothesis-driven and the other was considered exploratory.
Hypothesis-Driven Selection of Health Outcomes
As described in the main body of the report and in Appendix C, the committee undertook a review of recent literature to identify adverse health outcomes that might be associated with exposure to substances used in the SHAD tests. This review resulted in the identification of six substances for which the published literature suggested a basis for proposing hypotheses that exposure could be associated with increased risk of certain adverse health outcomes (see Table D-1).
Health Outcomes for Exploratory Analysis
In addition to examining the health outcomes suggested by the literature review, the committee sought to examine the data for signals of any other effects that might not have been anticipated based on individual exposures, but could have resulted from the particular combinations or circumstances of the testing. For this, the committee chose to examine mortality and morbidity in broad ICD-9 (and ICD-10 for mortality) categories. In addition, the committee included a category of neurocognitive disease (ICD-9: 290-319, 320-327; ICD-10: F00-99, G0009) because memory and attention scores from the health questionnaire used in the SHAD I study had indicated greater problems among participants than controls (IOM, 2007, p. 56).
TABLE D-1 Hypotheses to Be Tested Concerning Certain Substances Used in SHAD Testing and Adverse Health Outcomes
| Substance | Use in SHAD Test | Health Outcome Hypothesized |
| Coxiella burnetii | Biological agent | Chronic hepatitis |
|
Endocarditis |
||
|
Fatigue syndrome |
||
|
Osteomyelitis |
||
|
Vascular infection |
||
|
Escherichia coli |
Biological simulant |
Irritable bowel syndrome |
|
Staphylococcal enterotoxin type Ba |
Biological agent |
Asthma |
|
Graves’ disease |
||
|
Multiple sclerosis |
||
|
Rheumatoid arthritis (broad or narrow definition) |
||
|
Sarin |
Chemical agent |
Neurological effects (central nervous system) |
|
Neurological effects (peripheral nervous system) |
||
|
Neurological effects (hearing loss) Psychological symptoms |
||
|
Betapropiolactone |
Decontaminant |
Cancer (any type) |
|
Zinc cadmium sulfide |
Tracer |
Chronic kidney disease (broad or narrow definition) |
|
Lung cancer |
a Because the individuals who served on the vessels involved in testing staphylococcal enterotoxin type B were not identified, the committee could not test the hypotheses generated for this agent.
REPRESENTATION OF POTENTIAL EXPOSURE LEVELS
As described in Chapter 3, the committee considered exposure in terms of the substances used in SHAD tests and number of times each SHAD participant had the potential to be exposed to a substance. The number of trials for which an individual was present during each test and the total number of potential exposure opportunities for a given test substance over all tests were used as indicators of exposure. The distribution of exposure opportunities was plotted for each individual test substance and for exposures to any biological agent, any chemical agent (except trioctyl phosphate), and any decontaminant.
The plots informed decisions as to whether and how to group the participants into distinct exposure subgroups to facilitate group comparisons and analysis of potential exposure dose-response relationships. This subgrouping was done only when the number of men in the exposure group was large enough to ensure that each subgroup was greater than 100 in size. In environmental epidemiology and research in health-related fields, grouping subjects according to levels of exposure or other risk factors is common. The principle is that subgrouping would reach
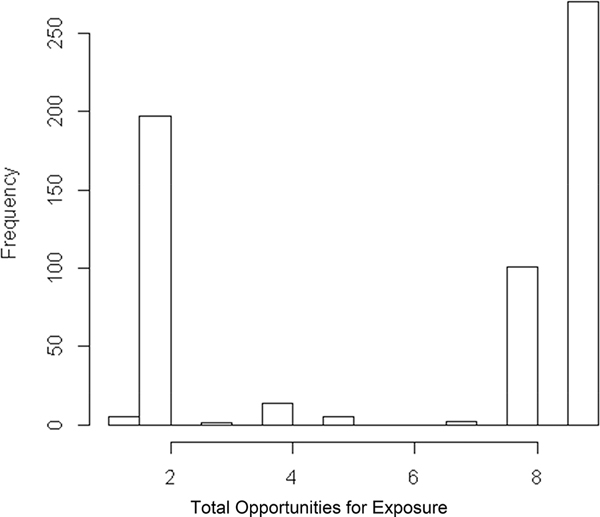
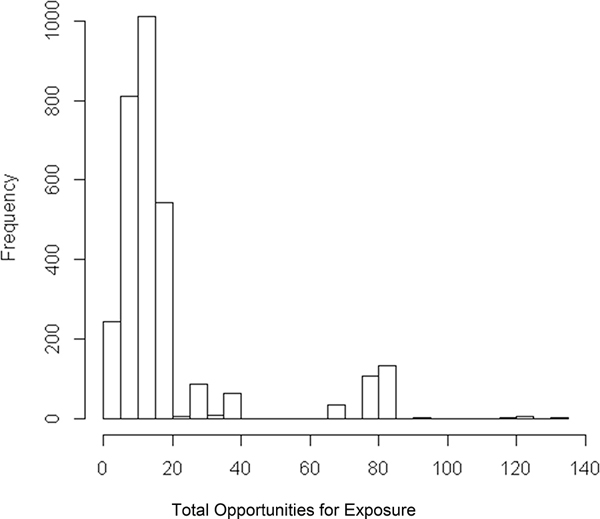
a balance between maximal similarity among individuals within a subgroup and maximal distinction across subgroups with respect to important characteristics and implied health risk (O’Brien, 2004). In the absence of knowledge of associated health risk, subgrouping is done with respect to one or more selected characteristics of the participants. The distribution of SHAD exposures was not continuous, often had multiple clusters (modes) because the participants assigned to the same ship were more likely to have similar numbers of exposures (see Figure D-1), or skewed with a small number of individuals having a larger number of exposures (see Figure D-2). These features rendered the conventional subgrouping schemes such as tertiles, quartiles, or equal length less useful because they could more likely fail to differentiate between subgroups or fail to homogenize within a subgroup.
For exposure to betapropriolactone, the quantile approach would lead to three groups: 1-2 exposures, 3-8 exposures, and 9 exposures. In this case, the second group is dominated by 8 exposures (101/123), hardly different from the third subgroup. These observations invited different approaches to subgrouping.
Thus, the modes (clusters) and percentiles of the number of exposure opportunities were determined using the routine “density” in R (version 3.0.3) for kernel estimation. The modes and percentiles together define exposure groups as described below in detail. Use of the algorithm resulted in two to three subgroups depending on the shape of the distribution and the number of participants involved in that exposure condition. The algorithm is as follows:
- If the total number of participants was less than 400, do not subdivide. (These were mostly cases where the number of exposure opportunities was clustered around one mode [ship]).
- If the total number of participants was more than 400, determine modes of the distribution (using kernel estimation with a bandwidth of 1/10 or 1/20 of the range of potential exposures [Sheather and Jones, 1991]).
2a. If there are multiple modes,
- Determine the midpoints between the neighboring modes and use these middle values as grouping cutoff points.
- If any subgroup has fewer than 100 members, combine it with its nearest neighbor of smaller group size.
2b. If there is only one mode, 2 groups will be formed as follows:
- If skewness is less than 3 in absolute value, the tertiles approach was used with the first 2/3 of the values forming one group and the remaining 1/3 the other group.
- If skewness is greater than 3, the quartile approach was used with the first 3/4 of the participants used in forming the first group and the last 1/4 the second group.
Ships were the experimental units in the SHAD tests, and individuals were exposed in clusters by ships. Such a clustering structure should ideally be retained in forming the exposure subgroups.
Thus for betapropiolactone, two modes were identified as shown in Figure D-1. For individuals with exposures to any of the chemical substances, there was only one mode (see Figure D-2) and the approach described in 2b.b. above was used to identify two groupings.
GROUPS OF SPECIAL INTEREST
USS George Eastman, USS Granville S. Hall, and the Light Tugs
Most of the participants in SHAD testing were involved in only one test, and most tests made use of a simulant in place of an active biological or chemical agent. However, both the USS George Eastman and the light tugs were involved not only in tests that used simulants, but also in tests that used active chemical or biological agents. For various tests of both types, the USS Granville S. Hall served as a laboratory ship that was to be kept clear of the dispersal of the test agents. However, its laboratory staff handled and analyzed samples collected by others during and after the tests. To allow for the special features of their SHAD experiences, the committee examined the health outcomes for the crew of the USS George Eastman and the light tug boats and other Project SHAD technical staff (PSTS), including the laboratory staff on the USS Granville S. Hall, separately from other SHAD participants in some analyses.
For the seven tests the USS George Eastman participated in over 1963-1966, two different ships served as comparisons. The USS Interceptor was the comparison ship for the tests Eager Belle I, Eager Belle II, Errand Boy, Flower Drum I, and Magic Sword, and the USS Oxford for tests Fearless Johnny and Half Note.
Identification of an appropriate comparison group was more difficult for the PSTS who served aboard the five light tugs and as laboratory and meteorological staff aboard the USS
Granville S. Hall. As noted in Chapter 2, the tugs had been Army tugs that were modified to include a laboratory “doghouse” and to be resistant to air leaks to the interior (Testimony to IOM Committee on Shipboard Hazard and Defense, February 2012). The tug crews and PSTS were specially assigned to the tugs or to the USS Granville S. Hall, and were required to hold Secret or Top Secret security clearance. Moreover, the men who served as PSTS have been explicitly identified for only one test, Shady Grove, except for a handful who stepped forward and were confirmed by DoD to have served on the tugs.
Given these challenges, two approaches were used to designate a comparison group for the tug crews and other PSTS. One comparison group (internal control) was the crew on the USS Granville S. Hall who were not part of the PSTS. These crew members were present on the USS Granville S. Hall, but they were not allowed to cross a clear boundary into the sample handling/laboratory area. The alternative comparison group (external control) was the crew on the ship named as the comparison ship for the USS Granville S. Hall for a given test (Shady Grove).
DATA ANALYSIS
Analyses for Mortality
Kaplan-Meier survival curves were used for a first, “crude,” comparison of the number and timing of deaths in the participant and comparison groups. Changes in mortality over time in the two groups may not be at a constant rate. The Kaplan-Meier comparison takes these and other data features into consideration and is capable of detecting a persistent difference in mortality over time. It is not, however, adjusted for group difference due to age and other important risk factors. For example, all other risk factors being equal, a population that is older will experience earlier mortality than a younger population, which is reflected in a more rapidly descending line representing the proportion of the older group still alive at a given time point.
Cox proportional hazard regression analysis was also used. It takes the Kaplan-Meier comparison a step further to incorporate individuals’ exposure and other risk factors such as age into consideration. It can also take into consideration data clustering at the ship level. Use of the proportional hazards model assumes proportionality in the associated hazard functions (force of mortality). Proportionality was confirmed graphically by plotting the logarithm of cumulative hazard based on Kaplan-Meier estimates versus the logarithm of time. Cox proportional hazard regression was used to assess all-cause mortality and cause-specific mortality for the overall study population and for the exposure groups examined.
The model was fitted in two ways. For the unadjusted model, mortality was the outcome and only participant or comparison status was used as the explanatory variable. For the adjusted models, participant and comparison status or in some instances the number of exposure opportunities was the main exposure variable; age and rank (enlisted versus officer) were also included as explanatory variables. Service branch (Navy versus Marines and other) was included as an explanatory variable for analyses of the overall study population and the analysis of TOF exposure, which included a larger proportion of Marine participants. Because of the large amount of missing data on the race of the SHAD participants and comparison population and the lack of a feasible way to impute the missing data, the committee decided not to include race in the analysis. The committee did not observe differential exposure by race and had no reason to anticipate a differential effect of exposure based on race. In many cases, the analysis was
stratified by officer and enlisted status in order to see if officers and enlisted personnel had a different mortality experience. When the exposed and comparison groups included personnel from multiple ships,6 data clustering at the ship level was considered, which described both a possible data correlation among individuals on the same ship as well as potential differences between the ships. In all analyses, a variable designating the ship to which a person was assigned during the test was used in the model as a random effect to quantify ship-clustering. In some instances the estimation process failed to converge with an estimate of the variance for the random effects.
For cause-specific mortality, competing risk was incorporated in the Cox regression model. Death due to the specified cause was considered as the main outcome, and death due to other causes was considered in the model as the outcome of a competing risk.
The committee carried out exploratory analyses involving multiple exposure groups among the SHAD participants that were created using the data grouping described in the previous section. The committee used Cox regression models to explore potential dose-response relationships between exposure level and mortality in conjunction with other factors such as age and enlisted status. SAS (version 9.4) was used for most data analysis, including survival analyses of mortality data. The SAS procedures used were PHREG for Cox regression, NPAR1WAY for Wilcoxon comparisons, LIFETEST for Kaplan-Meier, and FREQUENCY for the Fisher’s exact test. For group comparison of rates or proportions, R software was used (as indicated in tables presenting results of analyses) for the Fisher’s exact test (using the routine fisher.test) or logistic regressions (using the routine glm), As noted above, kernel density estimation was done in R with the routine density.
Analyses for Morbidity
The analysis of morbidity compared the SHAD participants and the comparison population on the basis of hospital days (as a measure of general significant morbidity) and of incidence of a diagnosis of a specific disease or disease group. Logistic regression with over-dispersion was used to compare levels of enrollment in Medicare (see Table 5-1), or use of Veterans Health Administration (VHA) medical services (see Table 5-2). The overall enrollment (Medicare) or use (VHA) numbers were compared with the Fisher’s exact test. The Fisher’s exact test was also used to compare percentages of SHAD participants and members of the comparison groups with a diagnosis code of interest in Tables 5-4, 5-5, 5-6, 5-7, and 5-9. Median hospital days per person-years in Medicare among those with hospitalization claims through Medicare (see Tables 5-3 and 5-8) were compared using a Wilcoxon rank sum test.
Circumstances did not permit the committee to take advantage of the more quantitative metrics of individual level of exposure and available factors to adjust for the heterogeneity in risk among the study participants.
Additional Statistical Considerations
Testing a large number of exposure-outcome associations increases the chance of reporting spurious associations. In the case of testing a single association at a 0.05 type I error
______________
6 The term “ship” should be understood to mean the military unit to which a person was assigned at the time of a given SHAD test. For the majority of the study population, the unit was a ship, but some men were assigned to aviation or infantry units.
level, approximately 5 percent of observed, significant associations would be the result of chance alone when there is no such association. When there are m distinct associations to be tested independently, each at a 5 percent error level, the family-wise error rate (FWER) of reporting at least one false association when there is none increases to 1–(1–0.05)m ≈m*0.05–m*(m–1)/2*0.052+…. To control FWER at 5 percent, for example, the Bonferroni correction essentially divides m into the 5 percent nominal level to form an adjusted nominal level of significance, and a test whose p-value is less than the adjusted significance level would be declared to be significant. The Holm’s correction divides the sequence of m, m–1, …, into the 5 percent nominal level to form adjusted nominal levels of significance for the tests ascending from the smallest to largest p-value; tests with a p-value less than their respective adjusted significance level are significant.
Because the multiple tests in the analysis of SHAD data, in particular those involving the same exposure and comparison groups, are less likely to be independent and because the adjustment to control FWER could compromise the ability to report a true significant test, the committee adopted the false discovery rate (FDR) correction. The FDR considers the percentage of false significant tests among all significant tests. The Benjamini and Hochberg (1995) adjustment multiplies the overall FDR rate level (e.g., 5 percent) by j/m as the nominal significance level for the test with the jth smallest p-value; a test with a p-value less than its corresponding nominal level is significant. The committee chose to use this FDR adjustment when any test reached an unadjusted nominal level of 5 percent.
The committee applied the Benjamini and Hochberg adjustment to the FDR in two instances in the analyses described in this report. In the analyses reported in Table 4-13, the results showed a statistically significant increase in the hazard ratio for heart disease mortality for the crew of the USS George Eastman. The p-values were 0.017 and 0.022, respectively, for models of pooled SHAD participants and of enlisted personnel only. The committee considered FDR adjustment of a multiplicity of three tests associated with cancer, heart diseases, and respiratory diseases in the case of enlisted and officers combined and the case of enlisted only. To retain an overall 0.05 FDR, the nominal level of significance is 0.05*1/3 = 0.0167. Because the observed p-values were greater than 0.0167, they did not reach the significance level. Note that the FDR adjustment for the case with the smallest p-value is the same as the Bonferroni adjustment. Further, the multiplicity of tests would be six if the tests of officers and enlisted together are combined with the enlisted only tests in one set, nine if those with the tugs and Project SHAD technical staff group were included, and would be 41 if the tests with other exposure groups were included, making the observed difference of the USS George Eastman crew much less significant.
A second circumstance in which the committee applied the Benjamini and Hochberg adjustment to the FDR to account for the multiple tests carried out was with the results of the analyses presented in Table 5-7. If one considers 10 tests to have been carried out for Table 5-7, then to retain an overall 0.05 FDR, the nominal levels of significance are 0.05*1/10 = 0.005, 0.05*2/10, 0.05*3/10, 0.05*4/10, and 0.05*5/10 for the five tests with p-values less than 0.05 in ascending order. Only the four tests with the smallest p-values reached their respective adjusted nominal level.
The committee did not pursue the few results in which members of the SHAD test participant groups had statistically significantly lower hazard or median hospital days per person-year of Medicare enrollment than members of the comparison groups. The statistical significance was the result of the implicit two-sided alternatives involved in these tests. Under a one-sided
alternative of worse outcomes for the SHAD participants, which is the a priori hypothesis of this investigation, these tests would not yield a significant p-value.
The committee considered statistical power in planning the analysis. Based on the data reported in SHAD I (IOM, 2007), statistical power assessment was conducted under various scenarios of the size of the differences, data variation, and error rate to be controlled. In general, a group size of 400 is required to retain a power greater than 65 percent. Given that none of the results of mortality analysis reached a statistical significance level after adjusting for multiple comparisons, the committee determined a post-hoc assessment of power for individual cases to be unnecessary.
The committee was also guided by the requirements of the Centers for Medicare & Medicaid Services (CMS) that prevent reporting of small cell sizes to prevent the identification of any individual. In keeping with the CMS requirements and to take similar precautions with other health outcome data, the committee did not report cell sizes ≤10. In addition, the committee reported only confidence intervals, not point estimates, when there was the potential to back-calculate the number of cases in a small cell. NR, for “not reported,” was used in a cell when the results of a calculation were suppressed for this reason.
Additional Analytical Challenges for Mortality and Morbidity
The committee took a precautionary approach to the overall analysis. Specifically, the use of alternative and supplementary methods aimed to ensure the internal validity as well as the robustness of each analysis.
The committee discussed possible data analytic approaches, such as propensity score matching, to control for confounding effects—differences among the comparison and exposure groups could have affected both the health outcomes and the SHAD exposure. Neither data from the SHAD I report nor data from the SHAD II analysis revealed significant differences between the exposed and comparison groups with respect to demographics and risk factors such as Vietnam experience or life style factors. Further, with the exception of specially outfitted ships such as the USS George Eastman, the USS Granville S. Hall, the tugs, and the USS Herbert J. Thomas, no evidence suggested that the ships participating in the SHAD testing were chosen for reasons that could disqualify other ships that were chosen for the comparison group. The strategy was to investigate bias issues on a case-to-case basis when such a need arose for a specific endpoint.
Investigation of special groups of participants (e.g., those on the tugs, the USS Granville S. Hall, and the USS George Eastman) remained difficult primarily because the number of people was small. The committee took two alternative and supplementary approaches. One was to compare a special group with its own control despite its small group size. A planned second approach was to include them or exclude them as a form of sensitivity analysis of the specific health endpoint for all participants with the exposure to the same substances.
Accounting for Location Aboard Ship
An analysis in which differences in exposure are represented by presence during a trial involves the underlying assumption that everyone serving on a test ship was equally at risk for exposure to a test substance. However, it is possible that the potential for exposure was different in different parts of a ship. There are no records of where particular personnel were located during the tests, but the committee envisioned as part of its analysis consideration of the possible
impact of a sailor’s “job” on his location on or movement about the ship during a test. This aspect of the analysis was not carried out but the nature of this contemplated component of analysis is described here.
The quarterly ship rosters that were used to ascertain who was serving on the ship at the time of the SHAD test (BuPers Report 1080-14) provided information on the pay grade and occupational qualifications (ratings) of the enlisted Navy personnel and the duties to which they were assigned (a “distribution” rating) on that vessel. The committee, with advice from a consultant,7 assigned crew members to one of three categories or “bins”: (1) likely movement around the ship (greater chance of exposure), (2) probable/possible movement, and (3) unlikely movement (less chance of exposure). Special consideration was also given to personnel who were likely to have been assigned to the engine room or the boiler room of a ship. In these areas ventilation requirements may have allowed for an exposure to test agents that did not occur elsewhere on a ship. The committee’s designations were made on the basis of typical duties of a person with that rating (Department of the Navy, 2015). The committee knew, however, that during SHAD tests and trials, personnel may have been assigned to locations or duties that were different from their usual assignments.
In addition, the Marines in Test 69-10, who were sprayed with the simulant TOF during a beach landing, were considered to have a potential for exposure equivalent to that of personnel most likely to move about a ship. For officers and personnel in other service branches, the committee judged that rank alone did not provide information about a plausible location or movement during the tests and envisioned using analytic methods to assess the impact of various presumptions about their potential for exposure to test substances.
Quantitative Exposure Metrics
Quantitative exposure metrics were planned and explored in this study to capture varying degrees of exposure among the SHAD participants to provide an additional dimension for exploring whether an underlying exposure-response relationship exists. The metrics comprise three factors: the types of test agents used in the SHAD tests, the number of trials a person participated in and the number of exposure opportunities he had, and his assigned position (or bin) on the ship. The number of exposure opportunities and bin both provided a more quantitative representation of a person’s potential exposure. A categorical score such as 1, 2, and 3 for different bins would give the possibility of ordinal implication. For each test substance or class of substances, the committee considered the number of exposure opportunities and the bin as two separate metrics that would be included in the model both individually and simultaneously, with or without interaction between them. This approach would have allowed investigation of the impact of a metric individually, without or without adjustment to the other, or of a possible synergistic effect of both. Alternatively, if the bins were to demonstrate unequivocal ordinal trend in their impact, they could be used as a “weight” to be combined with the number of exposure opportunities (trials) to form a composite exposure metric. The metrics for individual test substances could also be utilized simultaneously in a model to capture the potential of synergistic effect of a person’s cumulative exposure to multiple substances. This could be done in a couple of different ways. One is to include the metrics for the individual
______________
7 The consultant for this task served in the U.S. Navy for 25 years, retiring in 1981 as a Commander. He served on destroyer escorts, destroyers, and guided missile destroyers in capacities of first lieutenant, weapons officer, operations officer, and executive officer.
substances simultaneously in the model. Another is to sum up relevant individual metrics to form a composite metric especially for similar substances, and include this composite metric in the analysis. The quantitative exposure metrics were planned for use in analyses of both mortality and morbidity. However, because of study circumstances, the use of quantitative exposure metrics described in this section, including the analysis of the possible impact of location on the ship, was not carried out.
REFERENCES
Benjamini, Y., and Y. Hochberg. 1995. Controlling the false discovery rate: A practical and powerful approach to multiple testing. Journal of the Royal Statistical Society: Series B 57(1):289-300.
CDC (Centers for Disease Control and Prevention). 2013. Classification of diseases, functioning, and disability. http://www.cdc.gov/nchs/icd.htm (accessed October 13, 2015).
Department of the Navy. 2015. Manual of Navy enlisted manpower and personnel classifications and occupational standards. Vol. I, Navy enlisted classifications (NECs). NAVPERS 18068F. Washington, DC. http://www.public.navy.mil/bupersnpc/reference/nec/NECOSVol1/Documents/NAVPERS_18068_FINAL_JUL15.pdf (accessed October 6, 2015).
IOM (Institute of Medicine). 2007. Long-term health effects of participation in Project SHAD (Shipboard Hazard and Defense). Washington, DC: The National Academies Press.
National Archives. 2015. Records of U.S. military casualties, missing in action, and prisoners of war from the era of the Vietnam War. http://www.archives.gov/research/military/vietnam-war/electronicrecords.html (accessed January 31, 2015).
NCHS (National Center for Health Statistics). 2015. National Death Index. http://www.cdc.gov/nchs/ndi.htm (accessed October 13, 2015).
O’Brien, S. M. 2004. Cutpoint selection for categorizing a continuous predictor. Biometrics 60: 504-509.
Sheather, S. J., and M. C. Jones. 1991. A reliable data-based bandwidth selection method for kernel density estimation. Journal of the Royal Statistical Society: Series B 53:683-690.
Tipton, J. 2015. Find a grave. http://www.findagrave.com/cgi-bin/fg.cgi?page=listFaqs#10 (accessed March 24, 2015).
WHO (World Health Organization). 2015. International Classification of Diseases (ICD). http://www.who.int/classifications/icd/en (accessed August 4, 2015).


