
5
Morbidity Results
The committee used information on diagnoses received by Shipboard Hazard and Defense (SHAD) test veterans and the comparison population to assess whether morbidity differed in the two groups. These data came from diagnoses recorded in Medicare (Parts A and B) claims for inpatient and outpatient care provided on a fee-for-service basis and from diagnoses recorded in Veterans Health Administration (VHA) records for inpatient and outpatient care, as described in Chapter 3. The committee carried out analyses of the overall population and tested specific hypotheses suggested by literature reviews on the agents, tracers, simulants, and decontaminants used in the SHAD tests.
DATA FROM MEDICARE AND THE VETERANS HEALTH ADMINISTRATION
An important source of information on illness in the study population was in records of claims made for inpatient or outpatient care through the Medicare system. People become eligible for Medicare insurance in the year in which they turn 65, or when designated as eligible for disability through the Social Security Administration. These records provide information about days of hospitalization and diagnoses reported as part of the claim for the health services provided. Table 5-1 shows percentages of the Project SHAD participant and comparison populations enrolled in the fee-for-service form of Medicare Part A or B during 1999-2011, the period for which data were obtained. Approximately similar proportions of both groups were enrolled, starting at about 9 percent in 1999 and increasing to nearly 40 percent by 2011. However, an evaluation using logistic regression found the enrollment levels of Project SHAD participants were statistically significantly higher than those in the comparison group over the period of 13 years, and the SHAD participants also had statistically significantly higher annual increases in enrollment than the comparison group.
The other source of morbidity data was records of health care encounters with VHA. In contrast to Medicare, which has an identifiable “enrolled” population, eligibility for VHA services can vary depending on the nature of the veteran’s military service, medical condition, and income status. Therefore the committee considered a record of any diagnosis in inpatient or outpatient records to be an indication that the individual was a user of the Department of Veterans Affairs (VA) health care services. Table 5-2 provides counts and percentages of Project
TABLE 5-1 Enrollment in Medicare Fee-for-Service Among Project SHAD Participant and Comparison Populations, 1999-2011
| Year | Enrolled in Fee-for-Service Medicare (%) | |||||||
| Project SHAD Participants N = 5,868 | Comparison Population N = 6,753 | |||||||
| 1999 | 538 (9.2) | 623 (9.2) | Test for differential Medicare enrollment between SHAD participants and comparison group was based on a logistic regression with over-dispersiona; (one-sided) p-value = 0.0005 for additional annual increases in enrollment among SHAD participants. | |||||
| 2000 | 606 (10.3) | 652 (9.7) | ||||||
| 2001 | 709 (12.1) | 789 (11.7) | ||||||
| 2002 | 853 (14.5) | 995 (14.7) | ||||||
| 2003 | 980 (16.7) | 1,114 (16.5) | ||||||
| 2004 | 1,100 (18.7) | 1,252 (18.5) | ||||||
| 2005 | 1,223 (20.8) | 1,380 (20.4) | ||||||
| 2006 | 1,396 (23.8) | 1,551 (23.0) | ||||||
| 2007 | 1,611 (27.5) | 1,783 (26.4) | ||||||
| 2008 | 1,843 (31.4) | 1,972 (29.2) | ||||||
| 2009 | 2,051 (35.0) | 2,208 (32.7) | ||||||
| 2010 | 2,213 (37.7) | 2,404 (35.6) | ||||||
| 2011 | 2,314 (39.4) | 2,523 (37.4) | ||||||
| Ever enrolled | 3,197 (54.5) | 3,506 (51.9) | Fisher’s exact test for greater level of overall enrollment among SHAD participants: (one-sided) p-value = 0.002. | |||||
a Within-group rate dependence over the years due to enrollment in multiple years by an individual was not explicitly accounted for in this analysis. R.3.1.1 was used for this analysis.
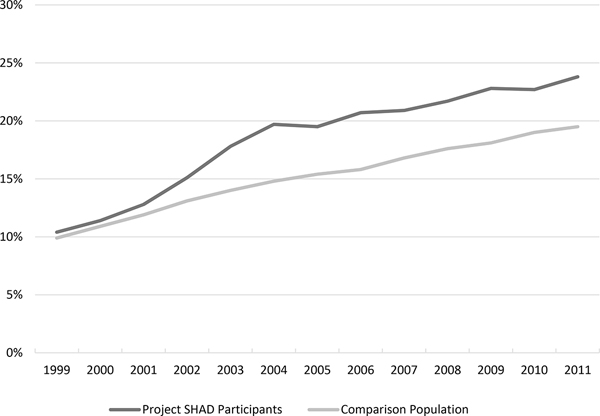
SHAD participant and comparison populations with diagnoses from inpatient and outpatient visits to VHA facilities. In each year, a higher percentage of Project SHAD participants had at least one diagnosis in VHA records. Over the period considered, nearly 40 percent of Project SHAD participants and one-third of the comparison population had at least some record of use of the VA medical system. As with Medicare, the SHAD participants had statistically significantly higher levels as well as annual increases in use of VHA services than the comparison group (see Table 5-2). As shown in Figure 5-1, VHA usage by the two groups was initially very similar, but there was a marked increase in Project SHAD participants’ use of the VA system starting in 2002. This coincides with VA’s notification of SHAD veterans of their participation in Project SHAD testing and an invitation to seek additional information. By 2005, usage among SHAD veterans remained higher than that of the comparison population, but the rate of increase in use from year to year became similar in the two groups.
TABLE 5-2 Percentage of Project SHAD Participant and Comparison Populations with Usea of VHA Medical Care by Year, 1999-2011
| Year | Received Diagnosis (%) | |||||||
| Project SHAD Participants N = 5,868 | Comparison Population N = 6,753 | |||||||
| 1999 | 612 (10.4) | 670 (9.9) | Test for differential level of VHA use between SHAD participants and comparison group was based on a logistic regression with over-dispersionb; (one-sided) p-value <10–6 for additional annual increase in use. | |||||
| 2000 | 669 (11.4) | 735 (10.9) | ||||||
| 2001 | 752 (12.8) | 804 (11.9) | ||||||
| 2002 | 884 (15.1) | 885 (13.1) | ||||||
| 2003 | 1,047 (17.8) | 947 (14.0) | ||||||
| 2004 | 1,155 (19.7) | 1,001 (14.8) | ||||||
| 2005 | 1,146 (19.5) | 1,039 (15.4) | ||||||
| 2006 | 1,217 (20.7) | 1,065 (15.8) | ||||||
| 2007 | 1,227 (20.9) | 1,136 (16.8) | ||||||
| 2008 | 1,273 (21.7) | 1,186 (17.6) | ||||||
| 2009 | 1,336 (22.8) | 1,225 (18.1) | ||||||
| 2010 | 1,333 (22.7) | 1,283 (19.0) | ||||||
| 2011 | 1,395 (23.8) | 1,314 (19.5) | ||||||
| Ever received VHA care (1997-2011) | 2,339 (39.9) | 2,235 (33.1) | Fisher’s exact test for greater use of VHAD care among SHAD participants: (one-sided) p-value <10–14. | |||||
NOTE: VHA = Veterans Health Administration.
a Any diagnosis in VHA inpatient or outpatient treatment records was considered indication of use of the VHA system.
b Within-group rate dependence over the years due to an individual’s use of services in multiple years was not explicitly accounted for in this analysis. R 3.1.1 was used for this analysis.
OVERALL MORBIDITY
The committee used hospital days as a broad measure of significant illness in the study population. This is not a typical measure of overall morbidity, but it has been shown to predict both mortality and other hospitalizations (e.g., Wolinsky et al., 1994). No existing comorbidity index covers the range of conditions that are hypothesized to potentially be associated with SHAD participation. Some indexes (e.g., the Charlson comorbity index [Charlson et al., 1987]) are calibrated to predict 1-year mortality. Others, such as the Elixhauser comorbidity index (Elixhauser et al., 1998), are calibrated to predict medical expenses. While the committee did not believe that SHAD participation would be linked to near-term mortality among the men for whom data on health care use were available, the committee was unsure whether it would be associated with expenses. Thus, overall days of hospitalization was chosen as one sign of morbidity. When comparing those who were hospitalized through Medicare during the period 1999-2011 (see Table 5-3), Project SHAD participants had lower median hospital days per person-year of enrollment than the comparison group, but the difference did not reach statistical significance using the Wilcoxon rank-sum test.
CAUSE-SPECIFIC MORBIDITY
The committee also explored whether SHAD participants may have been at increased risk of illness from particular causes. Two approaches were used to look at cause-specific morbidity. One
TABLE 5-3 Hospital Days Reflected in Medicare Fee-for-Service Claims for Project SHAD Participants and the Comparison Population Hospitalized Through Medicare, 1999-2011
| Project SHAD Participants Ever in Medicare N = 3,197 | Comparison Population Ever Medicare N = 3,506 | Wilcoxon P-value | ||||||
Hospitalized through Medicare |
1,335 (41.8%) | 1,473 (42.0%) | ||||||
Median hospital days per person-year of enrollment in Medicare (range), among those hospitalized |
2.00 (0.08-139.0) | 2.29 (0.08-163.0) | 0.18 | |||||
NOTE: SAS version 9.4 was used for a two-sided Wilcoxon rank-sum test.
approach looked at the numbers of individuals receiving diagnoses within broad categories of disease that are used in the ninth revision of the International Classification of Diseases (ICD-9) (WHO, 2015). The morbidity analysis also examined the specific health outcomes that were identified from the review of the literature on potential health effects associated with exposure to some of the substances used in the SHAD tests. The ICD codes that correspond to the categories of illness are provided in Appendix F.
Broad Categories of Illness
The morbidity experiences of the SHAD test participants and the members of the comparison population appeared very similar for all the diagnostic categories considered. Table 5-4 presents the numbers and percentages of the participant and comparison populations receiving a diagnosis in broad ICD-9 categories through Medicare fee-for-service during the years examined, out of the total that were ever enrolled during 1999-2011. An individual was counted as having a diagnosis in the category if there was either one inpatient diagnosis in the category, or two occurrences of an outpatient diagnosis in the category at least 1 day apart, within a 365-day period. Circulatory disease was the most common
TABLE 5-4 SHAD Participants and Members of the Comparison Group with a Diagnosis in Broad ICD-9 Categories, Based on Claims in Medicare Fee-for-Service, 1999-2011
| Category of Illness | Ever Enrolled in Medicare 1999-2011 | Fisher’s Exact Test Odds Ratio (95% CI) | ||||||
| SHAD Participants N = 3,197 (%) | Comparison Group N = 3,506 (%) | |||||||
|
Infectious disease |
403 (12.6) | 438 (12.5) | 1.01 (0.87-1.17) | |||||
|
Cancer |
546 (17.1) | 617 (17.6) | 0.96 (0.85-1.10) | |||||
|
Endocrine/metabolic disease |
1,475 (46.1) | 1,658 (47.3) | 0.95 (0.87-1.05) | |||||
|
Diseases of the blood and blood forming organs |
658 (20.6) | 732 (20.9) | 0.98 (0.87-1.11) | |||||
|
Mental disorders |
563 (17.6) | 648 (18.5) | 0.94 (0.83-1.07) | |||||
|
Nervous system and sense organs |
640 (20.0) | 772 (22.0) | 0.87 (0.79-1.00) | |||||
|
Circulatory disease |
1,622 (50.7) | 1,773 (50.6) | 1.01 (0.91-1.11) | |||||
|
Respiratory disease |
889 (27.8) | 995 (28.3) | 0.97 (0.87-1.08) | |||||
|
Digestive disease |
871 (27.2) | 942 (26.9) | 1.02 (0.91-1.14) | |||||
|
Genitourinary disease |
880 (27.5) | 966 (27.6) | 1.00 (0.90-1.11) | |||||
|
Skin disease |
315 (9.9) | 353 (10.0) | 0.98 (0.83-1.15) | |||||
|
Musculoskeletal |
861 (26.9) | 952 (27.1) | 0.99 (0.87-1.10) | |||||
|
Symptoms, signs, and abnormal clinical and laboratory findings, not elsewhere classified |
1,299 (40.6) | 1,442 (41.1) | 0.98 (0.89-1.08) | |||||
|
Injury/external causes |
1,439 (45.0) | 1,638 (46.7) | 0.93 (0.85-1.03) | |||||
|
Neurocognitive problems |
644 (20.1) | 749 (21.4) | 0.93 (0.82-1.05) | |||||
NOTES: CI = confidence interval. See Appendix F for the ICD-9 codes that correspond to the categories of illness. An individual was counted as having a diagnosis in the category if there was either one inpatient diagnosis in the category, or two occurrences of an outpatient diagnosis in the category at least 1 day apart, within a 365-day period. R 3.1.1 was used for the Fisher’s exact test and construction of confidence intervals with a two-sided alternative. No statistically significant differences were seen under the alternative of odds ratio greater than one.
diagnosis in both groups, with approximately 51 percent in each group having such a diagnosis. The proportions receiving diagnoses of other types were also comparable in the two groups. No statistically significant differences were seen. As an additional way to investigate evidence of chronic disease, the committee reviewed indicators in the Medicare records that were generated by the Chronic Condition Warehouse. These indicators mark claims related to treatment for one of 27 chronic conditions. They indicate whether “treatment for the condition appears to have taken place” using claims-based algorithms (CMS, 2015). The chronic condition data showed consistently similar percentages in the two groups (see Table 5-5).
The health experience of the SHAD participant and comparison populations also appeared very similar based on records of diagnoses from use of VHA services (see Table 5-6). As in the Medicare data, the percentages of diagnoses in various categories were similar in the SHAD veteran and comparison groups, with one exception. The percentage of SHAD veterans with an infectious disease or a musculoskeletal diagnosis was statistically significantly lower than that of the comparison population, but these differences were not in a direction of interest.
Testing Hypotheses Regarding Specific Exposures and Health Outcomes (Morbidity)
The committee’s review of literature on the agents, simulants, tracers, and decontaminants used in the SHAD tests (see Appendix C) led to the formulation of hypotheses about six of these substances, as noted in Chapter 3. It was able to test hypotheses for five of them in the evaluation of mortality in Chapter 4. In order to evaluate morbidity, it was of interest to assess the availability of information in the Medicare and VHA systems for these groups. Enrollment in fee-for-service Medicare (Part A or B) and indication of use of VHA medical care for each of these exposure groups is shown in Table 5-7. Medicare enrollment is not statistically different between in the participant and comparison groups. However, greater percentages of SHAD participants than the comparison group were seen using VHA medical care. When the committee applied an adjustment1 to take into account the multiple tests it carried out, p-values remained statistically significant for betapropiolactone, E. coli, sarin, and zinc cadmium sulfide. This higher overall use of VHA health care services by those in these SHAD participant exposure subgroups is consistent with the pattern seen in Table 5-2 and Figure 5-1 of greater use of VA health care services by SHAD participants than the comparison population in general.
______________
1 The committee used False Discovery Rate (FDR) rate adjustment to take into account the multiple tests carried out. Additional detail about the application of this adjustment is provided in Appendix D.
TABLE 5-5 Percentage of Study Subjects with a Record in the Medicare Chronic Condition Warehouse File with a Specified Diagnosis, 1999-2011
| Chronic Condition | Number (Percent) with Diagnosis | Fisher’s Exact Test Odds Ratio (95% CI) | ||||||
| Project SHAD Participants (N = 3,197) | Comparison Population (N = 3,506) | |||||||
|
Acquired hypothyroidism |
196 (6.1) | 214 (6.1) | 1.00 (0.82-1.23) | |||||
|
Acute myocardial infarction |
141 (4.4) | 147 (4.2) | 1.05 (0.83-1.34) | |||||
|
Alzheimer’s disease |
75 (2.3) | 73 (2.1) | 1.13 (0.80-1.59) | |||||
|
Alzheimer’s disease and related disorders or senile dementia |
192 (6.0) | 203 (5.8) | 1.04 (0.84-1.28) | |||||
|
Anemia |
977 (30.6) | 1,103 (31.5) | 0.96 (0.86-1.06) | |||||
|
Asthma |
190 (5.9) | 232 (6.6) | 0.89 (0.73-1.09) | |||||
|
Atrial fibrillation |
354 (11.1) | 350 (10.0) | 1.12 (0.96-1.32) | |||||
|
Cancer of the lung |
118 (3.7) | 151 (4.3) | 0.85 (0.66-1.10) | |||||
|
Cancer of the prostate |
276 (8.6) | 284 (8.1) | 1.07 (0.90-1.28) | |||||
|
Cataract |
1,011 (31.6) | 1,140 (32.5) | 0.96 (0.86-1.07) | |||||
|
Chronic heart failure |
617 (19.3) | 676 (19.3) | 1.00 (0.89-1.13) | |||||
|
Chronic kidney disease |
539 (16.9) | 596 (17.0) | 0.99 (0.87-1.13) | |||||
|
Chronic obstructive pulmonary disease |
729 (22.8) | 841 (24.0) | 0.94 (0.83-1.05) | |||||
|
Colorectal cancer |
69 (2.2) | 95 (2.7) | 0.79 (0.57-1.10) | |||||
|
Depression |
435 (13.6) | 488 (13.9) | 0.97 (0.85-1.12) | |||||
|
Diabetes |
921 (28.8) | 1,020 (29.1) | 0.99 (0.89-1.10) | |||||
|
Glaucoma |
300 (9.4) | 358 (10.2) | 0.91 (0.77-1.07) | |||||
|
Hip fracture |
38 (1.2) | 51 (1.5) | 0.81 (0.52-1.27) | |||||
|
Hyperlipidemia |
1,640 (51.3) | 1,803 (51.4) | 0.99 (0.90-1.10) | |||||
|
Hyperplasia, benign prostatic |
704 (22.0) | 806 (23.0) | 0.95 (0.84-1.06) | |||||
|
Hypertension |
1,815 (56.8) | 2,004 (57.2) | 0.98 (0.89-1.09) | |||||
|
Ischemic heart disease |
1,200 (37.5) | 1,295 (36.9) | 1.03 (0.93-1.13) | |||||
|
Osteoporosis |
88 (2.8) | 99 (2.8) | 0.97 (0.72-1.32) | |||||
|
Rheumatoid arthritis/osteoarthritis |
758 (23.7) | 865 (24.7) | 0.95 (0.85-1.06) | |||||
|
Stroke/transient ischemic attack |
282 (8.8) | 341 (9.7) | 0.90 (0.76-1.06) | |||||
NOTES: CI = confidence interval. Algorithms used to define the chronic conditions are available from the Chronic Conditions Data Warehouse (CMS, 2015). R 3.1.1 was used for the Fisher’s exact test and construction of confidence intervals with a two-sided alternative. No statistically significant differences were seen between the SHAD participant group and the comparison group under the alternative of odds ratio greater than 1.
TABLE 5-6 SHAD Participant and Comparison Populations with Diagnoses in Broad ICD-9 Categories from Use of VHA Inpatient or Outpatient Services, 1997-2011
| Diagnosis Category | Number (%) with Diagnosis | Fisher’s Exact Test Odds Ratio (95% CI) | ||||||
| Project SHAD Participants N = 2,339 | Comparison Population N = 2,235 | |||||||
|
Infectious disease |
682 (29.2) | 720 (32.2) | 0.87 (0.76-0.98) | |||||
|
Cancer |
979 (41.9) | 899 (40.2) | 1.07 (0.95-1.21) | |||||
|
Endocrine/metabolic disease |
1,740 (74.4) | 1,708 (76.4) | 0.90 (0.78-1.03) | |||||
|
Diseases of the blood and blood forming organs |
475 (20.3) | 488 (21.8) | 0.91 (0.79-1.05) | |||||
|
Mental disorders |
1,281 (54.8) | 1,257 (56.2) | 0.94 (0.84-1.06) | |||||
|
Nervous system and sense organs |
1,598 (68.3) | 1,559 (69.8) | 0.94 (0.82-1.06) | |||||
|
Circulatory disease |
1,791 (76.6) | 1,730 (77.4) | 0.95 (0.83-1.10) | |||||
|
Respiratory disease |
1,163 (49.7) | 1,118 (50.0) | 0.99 (0.88-1.11) | |||||
|
Digestive disease |
1,285 (54.9) | 1,256 (56.2) | 0.95 (0.84-1.07) | |||||
|
Genitourinary disease |
1,090 (46.6) | 1,064 (47.6) | 0.96 (0.85-1.08) | |||||
|
Skin disease |
1,043 (44.6) | 956 (42.8) | 1.08 (0.96-1.21) | |||||
|
Musculoskeletal |
1,412 (60.4) | 1,431 (64.0) | 0.86 (0.76-0.97) | |||||
|
Symptoms, signs, and abnormal clinical and laboratory findings, not elsewhere classified |
1,627 (69.6) | 1,578 (70.6) | 0.95 (0.84-1.08) | |||||
|
Injury/external causes |
2,246 (96.0) | 2,126 (95.1) | 1.24 (0.92-1.66) | |||||
|
Neurocognitive problems |
1,301 (55.6) | 1,282 (57.4) | 0.93 (0.83-1.05) | |||||
NOTES: CI = confidence interval. See Appendix F for the ICD-9 codes that correspond to the categories of illness. An individual was counted as having a diagnosis in the category if there was either one inpatient diagnosis in the category, or two occurrences of an outpatient diagnosis in the category at least 1 day apart, within a 365-day period. R 3.1.1 was used for Fisher’s exact tests and construction of confidence intervals with a two-sided alternative. No statistically significant differences were seen between the SHAD participant group and the comparison group under the alternative of odds ratio greater than 1.
All-Cause Morbidity for Selected Exposures
As with the complete study population, the committee used median Medicare hospital days per person-year of enrollment as a means to assess significant illness in the groups exposed to selected substances and their comparison groups (see Table 5-8). Median hospital days per person-year of enrollment were not statistically different between Project SHAD participants in the exposure groups and the comparison groups, except in the case of betapropiolactone where the median hospital days per person-year of enrollment were lower among those in the SHAD tests.
TABLE 5-7 Percentage of SHAD Participants with Specified Exposures and Their Comparison Groups Who Were Enrolled in Fee-for-Service Medicare (1999-2011) or Useda VHA Medical Care (1997-2011)
| Exposure and Data Source | Project SHAD Participants | Comparison Population | Fisher’s Exact Test Odds Ratio (95% CI) | P-value | ||||
| Coxiella burnetii | ||||||||
| N | 141 | 212 | ||||||
| Medicare | 60.3% | 62.7% | 0.90 (0.57-1.43) | 0.7181 | ||||
| VHA | 41.8% | 30.7% | 1.62 (1.02-2.60) | 0.02082 | ||||
| Betapropiolactone | ||||||||
| N | 595 | 607 | ||||||
| Medicare | 62.2% | 57.8% | 1.20 (0.95-1.52) | 0.06894 | ||||
| VHA | 40.7% | 30.5% | 1.56 (1.22-2.00) | 0.00014b | ||||
| Escherichia coli | ||||||||
| N | 141 | 228 | ||||||
| Medicare | 55.3% | 54.4% | 1.04 (0.67-1.62) | 0.4735 | ||||
| VHA | 46.8% | 34.2% | 1.69 (1.08-2.66) | 0.01084b | ||||
| Sarin | ||||||||
| N | 129 | 197 | ||||||
| Medicare | 65.1% | 60.4% | 1.22 (0.75-2.00) | 0.2296 | ||||
| VHA | 45.0% | 32.5% | 1.69 (1.05-2.75) | 0.01561b | ||||
| Zinc cadmium sulfide | ||||||||
| N | 681 | 773 | ||||||
| Medicare | 60.9% | 59.1% | 1.08 (0.87-1.34) | 0.2569 | ||||
| VHA | 42.4% | 32.5% | 1.53 (1.23-1.91) | 5.443e-5b | ||||
NOTES: CI = confidence interval; VHA = Veterans Health Administration. R.3.1 was used for the Fisher’s exact test and construction of confidence intervals with a two-sided alternative.
a Any diagnosis in VHA inpatient or outpatient treatment records was considered indication of use of the VHA system.
b P-values under the alternative of odds ratio greater than 1 were adjusted for a 5 percent false discovery rate (FDR) taking into account 10 tests; those with a b remained statistically significant at the 5 percent FDR level.
Morbidity from Health Outcomes with a Hypothesized Association with Certain SHAD Test Exposures
The committee also examined in both Medicare and VHA data diagnoses for the specific health outcomes that the committee concluded were suggested by the scientific literature to be a possible effect from certain exposures (see Table 3-1). Counts of those SHAD veterans potentially exposed to these substances who were diagnosed with the outcomes in Medicare or VHA records are presented in Table 5-9. Criteria for counting a diagnosis are shown in the table’s notes.
TABLE 5-8 Hospital Days Reflected in Medicare Fee-for-Service Claims for Project SHAD Participants with Specified Exposures and Comparison Groups Hospitalized Through Medicare, 1999-2011
| Exposure | Project SHAD Participants | Comparison Group | Wilcoxon Rank Sum Test P-value | |||||
| Coxiella burnetii | ||||||||
|
Number enrolled in Medicare |
85 | 133 | ||||||
|
Hospitalized through Medicare |
45 (52.9%) | 62 (46.6%) | ||||||
|
Median hospital days per person-year of enrollment in Medicare (range), among hospitalized |
1.78 (0.22-24.75) | 1.97 (0.17-46.0) | 0.76 | |||||
| Betapropiolactone | ||||||||
|
Number enrolled in Medicare |
370 | 351 | ||||||
|
Hospitalized through Medicare |
162 (46.1%) | 154 (41.6%) | ||||||
|
Median hospital days per person-year of enrollment in Medicare (range), among hospitalized |
1.70 (0.15-48.8) | 2.75 (0.15-75.0) | 0.03 | |||||
| Escherichia coli | ||||||||
|
Number enrolled in Medicare |
78 | 124 | ||||||
|
Hospitalized through Medicare |
32 (41.0%) | 56 (45.2%) | ||||||
|
Median hospital days per person-year of enrollment in Medicare (range), among hospitalized |
2.00 (0.33-47.4) | 2.34 (0.08-75.17) | 0.66 | |||||
| Sarin | ||||||||
|
Number enrolled in Medicare |
84 | 119 | ||||||
|
Hospitalized through Medicare |
34 (40.5%) | 58 (48.7%) | ||||||
|
Median hospital days per person-year of enrollment in Medicare (range), among hospitalized |
1.85 (0.23-42.0) | 1.50 (0.17-46.0) | 0.89 | |||||
| Zinc cadmium sulfide | ||||||||
|
Number enrolled in Medicare |
415 | 457 | ||||||
|
Hospitalized through Medicare |
190 (45.8%) | 199 (43.5%) | ||||||
|
Median hospital days per person-year of enrollment in Medicare (range), among hospitalized |
1.86 (0.15-47.4) | 2.40 (0.08-75.17) | 0.09 | |||||
NOTE: SAS version 9.4 was used for a two-sided Wilcoxon rank-sum test.
Taking into account the numbers of people enrolled in Medicare or seeking care through VHA, the SHAD veterans with exposures to C. burnetii, betapriopiolactone, or zinc cadmium sulfide had generally similar percentages with diagnoses for the hypothesized illnesses as those in the comparison groups. In addition, the percentages with diagnoses in the Medicare and VHA data were similar. In the group of SHAD veterans exposed to E. coli, a few cases of irritable bowel syndrome were seen in Medicare records (too few to allow reporting of a specific
number), but no cases were seen in the VHA records. In the comparison group for this exposure no diagnoses for irritable bowel syndrome were seen in either the Medicare or VHA records. A smaller percentage of the SHAD veterans than the comparison group had diagnoses potentially associated with exposure to sarin in the Medicare data, but the pattern was reversed in the VHA data, with a greater percentage of the SHAD veterans than the comparison group having diagnoses of interest. No statistically significant differences were seen in these comparisons.
TABLE 5-9 SHAD Participant and Comparison Groups with Specified Exposures and Diagnoses of Interest in Medicare Fee-for-Service Enrollees (1999-2011) and VHA Users (1997-2011)
| Exposure | Project SHAD Participants | Comparison Group | Fisher’s Exact Test Odds Ratio (95% CI) | |||||
| Coxiella burnetii | ||||||||
|
Number with any diagnosis of interesta in Medicare records |
≤10 | 13 | NR (0.27-2.35) | |||||
|
Number enrolled in Medicare |
85 | 133 | ||||||
|
Percent of Medicare enrollees with diagnosis of interest |
NR | 10% | ||||||
|
Number with any diagnosis of interest in VHA records |
≤10 |
≤10 |
1.23 (0.34-4.40) |
|||||
|
Number with any diagnosis in VHA |
59 | 71 | ||||||
|
Percent of the VHA users with diagnosis of interest |
NR | NR | ||||||
| Betapropiolactone | ||||||||
|
Number with any cancer in Medicare records |
59 | 52 | 1.09 (0.71-1.67) | |||||
|
Number enrolled in Medicare |
370 | 351 | ||||||
|
Percent of Medicare enrollees with diagnosis of interest |
16% | 15% | ||||||
|
Number with any cancer in VHA records |
53 |
45 |
0.87 (0.54-1.41) |
|||||
|
Number with any diagnosis in VHA |
242 | 185 | ||||||
|
Percent of the VHA users with diagnosis of interest |
22% | 24% | ||||||
| Escherichia coli | ||||||||
|
Number with irritable bowel syndrome in Medicare records |
≤10 | 0 | NR (0.28-2.35) | |||||
|
Number enrolled in Medicare |
78 | 124 | ||||||
|
Percent of Medicare enrollees with diagnosis of interest |
NR | 0 | ||||||
|
Number with irritable bowel syndrome in the VHA records |
0 |
0 |
||||||
|
Number with any diagnosis in VHA |
66 | 78 | ||||||
|
Percent of the VHA users with diagnosis |
0 | 0 | ||||||
| Exposure | Project SHAD Participants | Comparison Group | Fisher’s Exact Test Odds Ratio (95% CI) | |||||
|
of interest |
||||||||
| Sarin | ||||||||
|
Number with any diagnosis of interestb in Medicare records |
19 | 34 | 0.73 (0.36-1.46) | |||||
|
Number enrolled in Medicare |
84 | 119 | ||||||
|
Percent of Medicare enrollees with diagnosis of interest |
23% | 29% | ||||||
|
Number with any diagnosis of interest in the VHA records |
42 |
42 |
1.37 (0.59-3.22) |
|||||
|
Number with any diagnosis in VHA |
58 | 64 | ||||||
|
Percent of the VHA users with diagnosis of interest |
72% | 65% | ||||||
| Zinc cadmium sulfide | ||||||||
|
Number with any diagnosis of interestc in Medicare records |
61 | 61 | 1.12 (0.75-1.67) | |||||
|
Number enrolled in Medicare |
415 | 457 | ||||||
|
Percent of Medicare enrollees with diagnosis of interest |
15% | 13% | ||||||
|
Number with any diagnosis of interest in the VHA records |
42 |
43 |
0.82 (0.50-1.34) |
|||||
|
Number with any diagnosis in VHA |
289 | 289 | ||||||
|
Percent of VHA users with diagnosis of interest |
15% | 17% | ||||||
NOTES: CI = confidence interval; NR = not reported, cell size ≤10 could be back-calculated; VHA = Veterans Health Administration.
Medicare data: Counts represent individuals assigned a diagnostic code for the disease or condition of interest in Medicare fee-for-service records for the period 1999-2011. Diagnostic codes for these conditions are listed in Appendix F. For inpatient data, any record with the requisite code was counted. For outpatient data, a diagnosis was counted if it had at least two occurrences at least 1 day apart, within a 365-day period.
VHA data: Counts represent individuals assigned a diagnostic code for the disease or condition of interest in VHA records for the period 1997-2011. Diagnostic codes for these conditions are listed in Appendix F. For inpatient data, any record with the requisite code was counted. For outpatient data, a diagnosis was counted if it had at least two occurrences at least 1 day apart, within a 365-day period. R 3.1.1 was used for the Fisher’s exact tests and construction of confidence intervals with a two-sided alternative. Fisher’s exact tests were also conducted under the alternative odds ratio greater than 1; none of the tests was significant at the nominal level 0.05 before FDR correction.
a Diagnosis of endocarditis, fatigue, chronic hepatitis, osteomyelitis, or vascular infection.
b Diagnosis of central or peripheral system neurological effects, hearing loss, or psychological symptoms.
c Diagnosis of lung cancer or chronic kidney disease.
REFERENCES
Charlson, M. E., P. Pompei, K. L. Ales, and C. R. MacKenzie. 1987. A new method of classifying prognostic comorbidity in longitudinal studies: Development and validation. Journal of Chronic Diseases 40:373-383.
CMS (Centers for Medicare & Medicaid Services). 2015. Chronic conditions data warehouse: Condition categories. https://www.ccwdata.org/web/guest/condition-categories (accessed October 23, 2015).
Elixhauser, A., C. Steiner, D. R. Harris, and R. M Coffey. 1998. Comorbidity measures for use with administrative data. Medical Care 36(1):8-27.
WHO (World Health Organization). 2015. International Classification of Diseases (ICD). http://www.who.int/classifications/icd/en (accessed August 4, 2015).
Wolinsky, F. D., S. D. Culler, C. M. Callahan, and R. J. Johnson. 1994. Hospital resource consumption among older adults: A prospective analysis of episodes, length of stay, and charges over a seven-year period. Journal of Gerontology 49:S240-S252.


