
The Roundtable on Science and Technology for Sustainability held its winter meeting on December 10-11, 2014, in Washington, DC. As the fourth and final session of the Roundtable’s 2013-2014 initiative to examine the energy-water nexus, the December meeting featured panel discussions on improved data for water use, decision support tools, and frameworks for local and regional decision making. The panel discussions built on progress made at the three prior meetings of the Roundtable on Science and Technology for Sustainability, as well as a 2013 Massachusetts Institute of Technology (MIT)-Center for Strategic and International Studies (CSIS) workshop on the energy-water-land nexus and a 2013 National Science Foundation (NSF) workshop on developing a research agenda for the energy-water nexus. The Roundtable’s December meeting was convened in collaboration with the National Research Council’s Board on Energy and Environmental Systems and Water Science and Technology Board.
To open the Roundtable, David Dzombak, Carnegie Mellon University and co-chair of the Roundtable on Science and Technology for Sustainability provided an overview of the 2013-2014 Roundtable focus on the energy-water nexus. The first STS Roundtable meeting in June 2013 set the stage with a broad overview of the energy-water nexus, and highlighted data and research gaps and the regional and temporal elements of the energy-water nexus. The broad overview provided in the first meeting set the stage for the second meeting in December 2013, which focused on power plants and associated issues, including water availability, the role technology plays in addressing the energy-water nexus, public-private partnerships, and the need for comprehensive data on how water is used in energy production and on water supplies. The third meeting held in May 2014 focused on advances in technology, the effect technology has had on the energy-water nexus landscape, and the need for more integration of current technology. The need for improved data and decision support tools was also discussed at the third meeting, which set the stage for the fourth meeting in the series.
ADDRESSING THE ENERGY-WATER NEXUS: NEED FOR IMPROVED DATA AND DECISION SUPPORT TOOLS
Eric Evenson, coordinator for the Water for America Initiative at the U.S. Geological Survey (USGS), discussed the National Water-Use information Program at the USGS and the need for improved data. The National Water-Use Information Program analyzes sources and uses of water at different scales; documents trends in water use across the United States; collaborates with state and local agencies on water-related projects; and develops local, state, and national water use databases. 13 The program’s 2010 report describes eight principal categories of water use: thermoelectric power generation (45 percent of use), irrigation (33 percent), public supply (12 percent), self-supplied industrial (4 percent), aquaculture (3 percent), self-supplied domestic (1 percent), livestock (1 percent), and mining (1 percent). Every 5 years the USGS issues the report Estimated Water Use in the United States, said Dr. Evenson. The reports reveal that gross water use for all sectors peaked around 1975 (Figure 1). Since then use has declined to 1950 levels.
The reports also assess water use by geography and sector. Water use in the eastern United States is dominated by once-through water use for cooling in thermoelectric power generation, and in the West it is dominated by irrigation. The 2010 report identified other recent water use trends:
- Water withdrawals in 2010 were at 355 billion gallons per day—13 percent less than total withdrawals in 2005. This is the largest decline in water withdrawals nationally since records have been maintained.
__________________
13 Water use can be generally defined by water withdrawal and water consumption. Water withdrawal is the total volume of water removed from a source, and water consumption is the amount removed for use and not returned to its source.
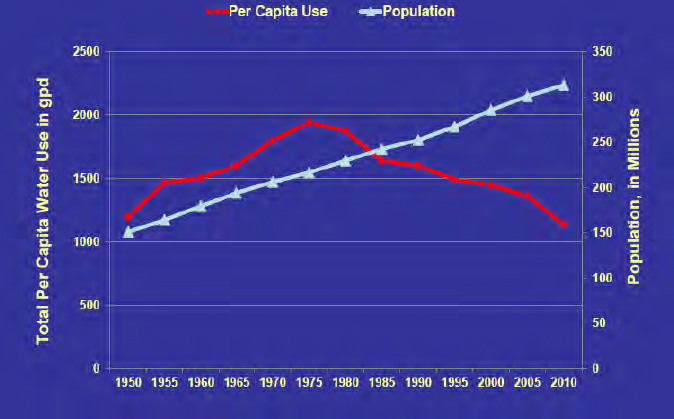
Figure 1 Change in gross per capita water use 1950-2010.
Source: Eric Evenson. December 10th presentation to the National Academies Roundtable on Science and Technology for Sustainability.
- Water withdrawals in 2010 were at levels not previously seen since 1970.
All sectors of use saw declines in water withdrawals, except for mining and aquaculture, which saw increases of 40 percent and 7 percent, respectively.
- Thermoelectric withdrawals declined by 20 percent. In 1950, it took 63 gallons to produce a kilowatt hour of energy; in 2010, it took 19 gallons.
- Many older municipal areas, such as New York City, have instituted water metering, which led to a decline in water use and the elimination of unaccounted water losses and leakage.
Water use information is acquired from other federal agencies, state agencies, and private industry. One challenge in gathering data from different sources is that there are differences in how the data are formatted, how frequently they are collected, what sectors are covered, and what thresholds are reported, said Dr. Evenson. Expanding the use of remote sensing could improve water use data, but characterizing consumptive use and improving how to quantify the uncertainty associated with water use data are key areas that need further improvement.
Sujoy Roy, principal engineer at Tetra Tech, presented on the need for improved data on water consumption, future growth, and new sectors associated with water use. Dr. Roy also attributed the largest water withdrawals to thermoelectric power generation. Dr. Roy noted that the term water use is nonspecific and often refers to withdrawal and consumption; however, these terms have distinctly different definitions.
Dr. Roy’s group investigated how water availability compares to consumption (i.e., for agricultural irrigation) and withdrawal (i.e., for electric generation), and possible future trends. Using the watershed model Soil and Water Assessment Tool (SWAT), Dr. Roy analyzed water consumption for irrigation at the county level, incorporating crop distribution and meteorological data from the U.S. Department of Agriculture and the National Weather Service into the model to improve its estimates. The modeling effort identified pockets of high consumption across the United States, particularly in the western states. Overall, the model demonstrated that 73,000 million gallons per day are consumed by irrigation. Approximately 50,000 million gallons per day are consumed by crops, lost at the farm level, or lost as surface runoff; the remainder is considered as base flow in the model and returns to water bodies for reuse.
Thermoelectric power generation withdraws water for cooling systems, Dr. Roy said.
There are two main types of cooling systems: recirculating systems, which use evaporation to reject a fraction of the heat captured; and once-through systems, which withdraw water for cooling purposes but discharge the water back to its source at a higher temperature. This discharged warmer water results in increased water lost to the atmosphere through evaporation.
A major challenge to the study was a lack of plant-level information on water use for many power plants—a problem more common in plants using recirculating systems than once-through systems. For plants lacking data on water use, estimates were made during the assessment. Consistency in how water use data were reported was another challenge, Dr. Roy noted.
Most power plants using once-through cooling systems were in the eastern half of the United States and were mainly coal and nuclear power plants. These plants are large sources of water withdrawal but are low in water consumption. In the western states, most plants use recirculating cooling systems, and so water withdrawal and consumption are closely aligned. Whereas once-through cooling systems in the eastern states consume less than 1 percent of withdrawals, recirculating cooling systems in the west can consume 60 percent of the water withdrawn.
Although there is extensive data available on water use from the USGS and other agencies, Dr. Roy said, more clarification is needed on the methodologies used to estimate water use quantities. Also needed are more information on data quality and greater consistency in how data are reported. More frequent reporting, additional temporal and spatial detail, and better integration with other types of data from various agencies would help to achieve a finer resolution of the data to better support decision making.
Tara Moberg, freshwater scientist with The Nature Conservancy’s Pennsylvania Chapter, discussed some of the challenges to freshwater species from water withdrawals for thermoelectric cooling and other uses. Although much is known about the water needs of some species, such as the Eastern Brook Trout, there are many freshwater species whose water needs are unknown. Research focused on ecological flows assesses the flow of water in natural rivers and lakes that sustains ecosystems and the goods and services they provide for humans. Ms. Moberg stated that there has been a shift—known as the natural flow paradigm shift—from protecting a minimum amount of flow in streams to protecting the flow regime as a whole. This new paradigm asserts that freshwater species depend not only on the physical habitat provided by a natural water system but also on the linkages that the natural variability of flows provides in mediating water quality conditions, such as dissolved oxygen and pH. The Nature Conservancy developed a set of ecological flow principles that recognize tradeoffs among shared resources. The overall goal of these principles is to create conditions adequate for the survival of these species and the systems on which they rely.
New demand on water resources for Marcellus shale development across Pennsylvania has put increasing pressure on the ecological flow of rivers in the region, said Ms. Moberg. Developing one natural gas well with hydraulic fracking, for example, requires approximately 4.5 million gallons of water. To better understand increased water demand on a basin-wide scale, the Nature Conservancy scaled up from stream- and species-specific studies to characterizing needs for specific river types and communities. The organization developed a research framework that includes scientific and social dimensions, with four clear steps that address the physical and ecological attributes of a basin. These attributes focus on the hydrologic foundation, river classification, flow alteration, and flow-ecology relationships.
A USGS-developed base flow simulation estimator tool was used to characterize the hydro-ecological settings of the framework, Ms. Moberg said. The hydrology at ungauged stream locations and reference sites was assessed using the Nature Conservancy’s indicators of hydrologic alteration software, which created a thumbprint for each of the streams characterizing the inter-annual, annual, and monthly statistics that differentiate a given stream from others. These measurements and modeling were used to help assess how ecosystems depend on stream flow and which processes, such as channel maintenance, are most important. This methodology resulted in the Nature Conservancy representing over 1000 species, with 25 groups and trait groups of species and about 70 individual species.
Ms. Moberg stated that part of the social component of the framework, including the selection, categorization, and classification processes for various species, was carried out with a broad range of stakeholders through a series of workshops. From these workshops, 80 flow ecology hypotheses were developed to describe how a particular species would be affected by a given flow component for a specific month or season within a given habitat. The research established how different species used high and low flows seasonally, and what might
change if those particular components were altered. The magnitude of the effect was determined by literature reviews to develop qualitative and quantitative support assessed through a weight-of-evidence approach. The end product was a list of recommendations for all river types for a given basin, which was a key communication tool for water managers and stakeholders in that region. An online tool is also being developed to help state and local water managers in the Susquehanna River Basin implement recommendations. This example of a decision support tool allows regulatory agencies to be better informed on water withdrawals and to account for limitations in predicting water availability.
Michael Webber, deputy director of the Energy Institute at the University of Texas at Austin, emphasized from the panel discussion that the quality of the data reported will strongly influence how those data are interpreted and used. The definitions for the terms in discussing water, such as use, consumption, and waste will also strongly influence how water data are communicated between organizations. More consistent use of terminology, units, and the type of data reported would aid communication efforts, he said.
Dr. Evenson then offered an example of data collection that provides accurate and useful irrigation data. The Georgia Soil and Water Conservation Commission has a program that requires all agricultural irrigation wells and pumps permitted by the Georgia Department of Natural Resources’ Environmental Protection Division to have a water metering device installed. Currently, over 11,000 metering devices have been installed to monitor water use in Georgia. In response to a question about how to catalyze improvements in data quality, Dr. Roy commented that data is reported well when there is a regulatory requirement. Generally, thermoelectric power plants are not required to provide information to the Energy Information Agency, and so data quality varies widely. In the absence of having regulatory compliance, a mechanism that provides feedback on the data, such as water use maps, could help to improve data quality, he said.
DECISION SUPPORT TOOLS FOR ADDRESSING THE ENERGY-WATER NEXUS
James Everett, manager of operations support for the Tennessee Valley Authority’s (TVA’s) River Forecast Center (RFC), discussed how the Tennessee River reservoir system is managed in an integrated manner in order to provide multiple benefits, including flood control, navigation, power, recreation, water quality, and water supply. Mr. Everett emphasized the importance of maintaining close relationships and collaborating with partnering federal agencies, including the U.S. Army Corps of Engineers, National Weather Service, and USGS. The Tennessee River Valley covers approximately 42,000 square miles, and the TVA owns and operates 49 dams across the valley. Twenty-nine of those dams have conventional hydroelectric power-producing facilities.
The seasonal cycle of reservoir levels drives the operating policies at TVA dams, said Mr. Everett. Tributary dams built in the mountains were designed primarily for flood protection. It is important to draw reservoirs down in the early fall so that they are ready to receive an increase in runoff during winter months. The Tennessee Valley is “water rich” due to an average annual rainfall of 52 inches; however, that amount of water needs to be carefully managed. Holding water in tributary dams reduces flow to the main stem river systems, and reduces damage from flooding. On average, $260 million in damages is averted each year due to this management. In 2013, the Tennessee Valley received over 65 inches of rainfall, and TVA estimates that nearly $1 billion in flood damages was averted in the City of Chattanooga.
TVA operates 109 conventional units for hydropower and is responsible for over 3,500 megawatts of generating capacity, Mr. Everett said. TVA operates an extensive network of over 240 rain and 60 stream gauges and conducts inflow and runoff modeling for storm events in conjunction with the National Weather Service. The data that result from modeling are fed into a routing model, which includes both simulation and optimization and is ultimately used to make decisions about reservoir releases. Optimization models were developed by the Center for Advanced Decision Support for Water and Environmental Systems (CADSWES) at the University of Colorado, Boulder. Riverware, a routing model developed by CADSWES, can be implemented in both simulation and optimization modes to make decisions about how much water to allow through reservoir systems.
TVA follows the National Weather Service’s lead when updating models for estimating inflows, Mr. Everett said. TVA is retiring legacy systems and instead using enhancements and utilizing partnerships with other agencies, such as the U.S. Army Corps of Engineers, to perform faster simulations and optimizations of their systems in order to make better decisions (Figure 2).TVA has a long history of operating the reservoir system, said Mr. Everett in conclusion, and the decision support tools it uses are evolving as demands on the system have evolved.
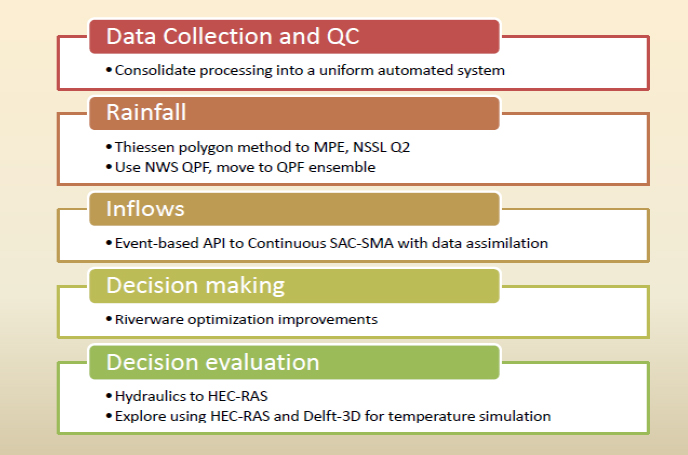
Figure 2 Models and decision support tools used by the Tennessee Valley Authority to manage their reservoir system.
Source: James Everett. December 10th presentation to the National Academies Roundtable on Science and Technology for Sustainability.
Alan Krupnick, co-director of Resources for the Future’s Center for Energy and Climate Economics (CECE), discussed the center’s risk matrix and survey as a decision tool in shale gas development. Better information needed to be brought into the debate on shale gas development, he said. CECE’s expert survey was designed to engage four key groups of stakeholders: government, industry, academia, and nongovernmental organizations (NGOs). The goal was to focus on activities where scientific knowledge could help advance practices, identify research priorities, and provide priority pathways for voluntary actions by industry or further regulation. CECE developed a risk matrix that listed a set of activities in shale gas development at well pads, and then identified the burden to the environment for each of those activities. The result was a series of impact pathways that linked activities to water, land, air, or community effects. For example, on-road vehicle activity resulted in air pollution, noise pollution, and road congestion. A total of 264 impact pathways were identified from the shale gas development activities. CECE then shared the matrix with 215 experts from the four different stakeholder groups to review the pathways and identify top accident and routine priority risks that need further attention from government or industry. Mapping the priorities from the different stakeholder groups in a Venn diagram resulted in 12 of each group’s top 20 priorities overlapping.
Dr. Krupnick listed a few surprises from the survey of routine priorities. First, concerns about surface water rather than groundwater dominated priorities across the groups. Only two of the pathways were unique to shale gas development relative to conventional gas development. Also, habitat fragmentation from roads and pad development were identified as a top priority. There were also differences among the stakeholder groups. Experts from NGOs were more concerned about conventional air pollutants, state and federal governments were more focused on groundwater, academia focused on landscape effects and groundwater withdrawal, and industry and academia were focused on seismic effects from fracking.
Diana Bauer, director of energy systems analysis and integration within the Office of Energy Policy and Systems Analysis at the U.S. Department of Energy (DOE), offered a high-level overview of the 2014 DOE report The Water-Energy Nexus: Challenges and Opportunities.14 The report was framed to assess the overall systems related to energy and water, future trends, and the decisionmaking landscape, said Dr. Bauer. Complexities in decision making arise because policies for water and energy are made by many different agencies and organizations at the federal, state, and local levels. The report examines technology, research and development, fundamental and applied science, and modeling and analysis that can inform decision making, and presents six strategic pillars:
- Optimize the freshwater efficiency of energy production, electricity generation, and end use systems;
- Optimize the energy efficiency of water management, treatment, distribution, and end use systems;
- Enhance the reliability and resilience of energy and water systems;
- Increase safe and productive use of nontraditional water sources;
- Promote responsible energy operations with respect to water quality, ecosystem, and seismic impacts; and
- Exploit productive synergies among water and energy systems.
Dr. Bauer presented a Sankey diagram showing the flow of energy and water through the national economy, derived from DOE and USGS data (Figure 3). An understanding of market drivers, such as water and energy prices and institutional factors, is key to developing decision-making tools, said Dr. Bauer. This understanding led to a more integrated framework that addresses the complexity of the decision-making landscape; the framework encompasses data modeling and analysis, technology and research, and policy analysis in a way that allows for information flow among these three key areas and also incorporates stakeholder involvement.
Another tool Dr. Bauer described was a stacked infrastructure model used for national to regional-scale assessments. It incorporates not only water and energy but also transportation, population dynamics, and other systems to allow for an understanding of indirect effects and trends over time. This type of tool can help estimate future energy demand by fuel type, link it to electricity systems, and evaluate water withdrawals and consumption for thermoelectric power. It is a system of linked models that can respond to changes in the assumptions and data embedded in those models, and help elucidate the implications for energy and water decision making in the future.
In response to a question about the availability of models, Dr. Everett explained that most of the models TVA uses were developed in-house and are not available to users in the general public; however, some other models from the U.S. Army Corps of Engineers and the National Oceanic and Atmospheric Administration are in the public domain. Similarly, Dr. Bauer said that her office uses the GREET model available from the Argonne National Laboratory; however, the modeling that links the different systems – the stacked infrastructure model – is not available for public use. DOE would like to better deliver tools to stakeholders and make them more universally accessible and usable, Dr. Bauer added.
DECISION-BASED FRAMEWORKS FOR LOCAL DECISION-MAKING
Michael Sale, executive director of the Low Impact Hydropower Institute, discussed the importance of hydropower as a renewable energy source and as part of the U.S. water sector. Hydropower is well established in the United States and has been a foundation of renewable energy, he said. Currently, over 225 hydropower plants in the United States produce an average of 280 terawatts daily. Hydropower is the largest water user in the United States but has largely not been counted in water statistics since 1995.
Advanced technology has helped to improve hydropower operations, Dr. Sale continued. For example, there have been advances in building better turbines, designing better fish passages and ladders, and better compliance with in-stream flow or environmental flow requirements. Excluding hydropower from Renewable Portfolio Standards programs results in lost opportunities to engage the hydropower sector and provide incentives to further improve operations, he said. Market-based incentives have led to improved coordination within river basins, better water quality within river basins that surpasses regulatory requirements, and benefits to local environments.
Gregory Characklis, professor of environmental sciences and engineering at the University of North Carolina, also focused his remarks on hydropower, which he described as a renewable energy source with a significant influence on the environment. One major advantage of
__________________
14http://energy.gov/downloads/water-energy-nexus-challenges-and-opportunities
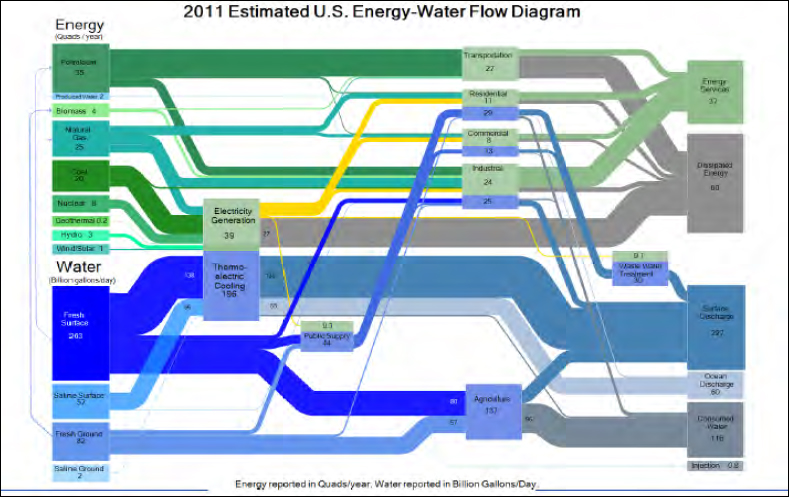
Figure 3 Sankey diagram showing the flow of energy and water through the national economy.
Source: Diana Bauer. December 10th presentation to the National Academies Roundtable on Science and Technology for Sustainability.
hydropower over coal or nuclear power generation is the ability to turn power generation on or off. Challenges to hydropower, however, include ensuring financial stability, managing variable flow, and maintaining ecosystem quality.
The key consideration with hydropower is its value as a peaking source for electricity generation. Coal and nuclear power generation are more efficient as base loading, and the variability associated with intermittent solar and wind energy production makes hydropower a more efficient peak energy source due to its ability to be turned on and off with fluctuating demand.
Dr. Characklis pointed to global trends that will impact both the energy and water markets in the future. For example, increasing water scarcity will be a key challenge, one that could potentially impact hydropower because of the water stored behind hydropower dams. The water can either be stored and used to generate electricity or released downstream to feed municipal water supplies; however, it may not be possible to meet both needs.
Dr. Characklis’s research in the Catawba Basin, which runs between North and South Carolina, demonstrated that if 100 percent water supply reliability was to be met at the demand projected for 2020, there would need to be a 25 to 30 percent reduction in energy production. One innovative approach to improving the regulatory and economic outcomes is introducing tradable flow credits, which municipalities receiving the water supply would use to pay the hydropower producers to retain water in the reservoirs.
Barton Thompson, Robert E. Paradise professor of Natural Resources Law and Perry L. McCarty director and senior fellow of the Woods Institute for the Environment at Stanford University, discussed the decision-making tools that local governments will need in order to navigate a complex landscape of water and energy policy.
In the future, because of increasing environmental constraints and regulation, local governments will rely less on long-distance imports of water supply such as the Federal Central Valley Project, which imports water from Northern California into the Central Valley and Southern parts of California. Competition for available water will also increase, he said. There are currently more cases involving water disputes before the U.S. Supreme Court than at any other point in recent history. A current case Dr. Thompson is involved in is a dispute between Montana and Wyoming over water in the Yellowstone River system. He noted how little information is available in the case and that more data would help those involved make more informed decisions. Dr. Thompson expects interstate water disputes to increase in the future.
Water supplies will need to place greater emphasis on recycling and desalination; however, these processes will need significant technological advances, said Dr. Thompson. Recycling in California has reached a stage at which it has proven to be economically viable; however, for much of the rest of the country it is still prohibitively expensive. Similarly, desalination is currently not an option for most municipalities because of the cost and the amount of energy required. Technological advances are taking place in research laboratories that would help drive down the energy requirements costs of these technologies. The pace of these developments, however, is slow and they are not being adopted into the market.
Innovative development is stronger in the energy sector than in the water sector, which is exemplified by the number of patents filed in each sector, said Dr. Thompson. A few key drivers explain this pattern: pricing, financing, and regulations. There is often a strong correlation between the price of a commodity and innovation in that particular field. For example, there is a strong relationship between the number of clean energy patents issued in the United States and the price of electricity. In contrast, the price of water in the United States is extremely low compared to other developed countries. Water is the only resource in the United States that can be obtained at no charge, and correcting for the underpricing of water will drive innovation in this sector, said Dr. Thompson.
Financing is another challenge to innovation, he continued. Water utilities face increasing challenges, particularly in replacing aging infrastructure. When the ratio of capital investment to revenue is assessed for various utilities, the water sector is clearly a highly capital-intensive sector. Electric utilities, for example, have a capital investment-to-revenue ratio of approximately 1.8, whereas water utilities have a ratio of approximately 3.8. Water utilities, therefore, are not able to invest in research, because they spend most available funds on operating costs and capital investments. Also, new technology is a challenge to adopt due to the often high capital costs associated with implementation. Another barrier to innovation in the water sector is regulation at local and state levels, he noted, which can result in many new technologies not being adopted. ![]()
PRESENTERS: Sujoy Roy, Tetra Tech R&D; Eric Evenson, U. S. Geological Survey; Tara Moberg, The Nature Conservancy; James Everett, Tennessee Valley Authority River Forecast Center; Alan Krupnick, Resources for the Future; Diana Bauer, U.S. Department of Energy; Michael Sale, Low Impact Hydropower Institute; Gregory Characklis, University of North Carolina; Barton Thompson, Jr., Stanford University.
PLANNING COMMITTEE: David Dzombak (NAE) (Chair), Carnegie Mellon University; Marilu Hastings, The Cynthia and George Mitchell Foundation; and Francis O’Sullivan, Massachusetts Institute of Technology.
NRC STAFF: Jerry Miller, director, Science and Technology for Sustainability Program (STS); James Zucchetto, director, Board on Energy and Environmental Systems (BEES); Jeffrey Jacobs, director, Water Science and Technology Board; Jennifer Saunders, senior program officer, STS; Dominic Brose, consultant, STS; and Emi Kameyama, program associate, STS.
DISCLAIMER: This meeting summary has been prepared by Dominic Brose as a factual summary of what occurred at the meeting. The committee’s role was limited to planning the meeting. The statements made are those of the author or individual meeting participants and do not necessarily represent the views of all meeting participants, the planning committee, STS, or the National Academies.
The summary was reviewed in draft form by Michael Kavanaugh, Geosyntec and Danny Reible, Texas Tech University. The review comments and draft manuscript remain confidential to protect the integrity of the process.


