
NATIONAL DATA ON THE PREVALANCE OF MENTAL DISORDERS
Kathleen Merikangas (National Institute of Mental Health, NIMH) began her presentation with a reference to Mental Health: A Report of the Surgeon General, a document that discusses definitions of mental disorders (albeit definitions that have changed over time), the perceived causal mechanisms of mental disorders, and the social and other contextual factors that influence mental disorders and treatment strategies. When it was first published in 1999,1 the report brought national attention to the public health relevance of mental disorders and also led to several initiatives by NIMH that focused on collecting data on the prevalence and magnitude of mental disorders, as well as on associated impairments in both adults and children.
One of the NIMH initiatives was to include the Strengths and Difficulties Questionnaire (SDQ) in the National Health Interview Survey (NHIS). The NHIS is a nationally representative annual household survey. The SDQ (described in further detail below) was included in the NHIS between 2001 and 2003. The sample included children aged 4-17, and the interviews were completed by their caretakers, in either English or Spanish. The children included in the NHIS sample are the youngest age group
______________
1U.S. Department of Health and Human Services. (1999). Mental Health: A Report of the Surgeon General. Washington, DC: Author. Available: http://profiles.nlm.nih.gov/ps/access/NNBBHS.pdf [October 2015].
for which national data are available, using this measure. The SDQ measures severe difficulties in emotional or behavioral functioning during the 6 months preceding the interview. The resulting estimates from the NHIS surveys were around 5 percent, with higher rates for boys than girls.
Another NIMH initiative described by Merikangas was to add selected modules from a structured interview, the Diagnostic Interview Schedule for Children (DISC), to the National Health and Nutrition Examination Survey (NHANES). The NHANES is another nationally representative annual survey. The DISC was included in the NHANES between 2001 and 2004. It was administered to children 8 and older. In the case of children under 16, a parent interview was also conducted. Although the DISC can measure a large number of disorders, only a subset of the disorders were selected for inclusion in the NHANES: generalized anxiety disorder, panic disorder, eating disorder, elimination disorder, major depression, dysthymic disorder, attention deficit hyperactivity disorder (ADHD), and conduct disorder. Merikangas pointed out that one challenge for researchers considering the use of the NHANES data is that in order to protect respondent confidentiality, these data can only be accessed on-site, through the Research Data Center of the National Center for Health Statistics.
NIMH was also involved in the development of the National Comorbidity Survey Replication Adolescent Supplement (NCS-A), a supplement to the National Comorbidity Survey Replication (NCS-R). The NCS-A was a nationally representative survey conducted between 2000 and 2004 that included adolescents aged 13-18. The dual sampling frame covered both households and schools, and the interviews with adolescents were supplemented with a self-administered questionnaire completed by parents. The survey included a modified version of the World Mental Health Organization Composite International Diagnostic Interview 3.0 (CIDI), and it collected data on the full spectrum of disorders. The sample was limited to adolescents 13 and older because there was a lack of agreement about the measures that would be appropriate for use with younger children. In addition to producing prevalence rates, the survey also provided information about correlates of mental disorders.
Merikangas said that it would be valuable to conduct a follow-up study with the adolescents (or a subsample of the adolescents) included in the NCS-A. Such a study could shed light on whether the presence of mental disorder in adolescence and the thresholds used are good predictors of impairment in young adult life.
The data from the surveys described illustrate several challenges encountered when deciding how to measure child serious emotional dis-
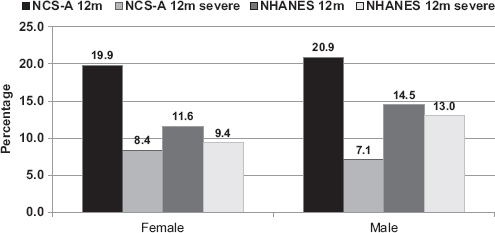
FIGURE 2-1 Prevalence of 12-month mental disorder by sex and severity, NCS-A and NHANES.
NOTES: Any mental disorder includes anxiety (generalized anxiety disorder and panic disorder), mood disorder (major depressive disorder and dysthymia), attention deficit hyperactivity disorder (ADHD), conduct disorder, and eating disorder. NCS-A, National Comorbidity Survey Replication Adolescent Supplement; NHANES, National Health and Nutrition Examination Survey.
SOURCE: Workshop presentation by Kathleen Merikangas, June 2015.
turbance in large-scale surveys.2Figure 2-1 shows the NCS-A and the NHANES data on the rate of mental disorders experienced in the 12 months preceding the survey. The gender differences in the data are well known. The more interesting differences are in the rates obtained from the two surveys, particularly the large differences that are a result of applying a severity threshold. When a severity criterion is applied, there is a larger drop in the case of the NCS-A (which measured a broader range of disorders) than in the NHANES. These differences illustrate the importance of obtaining input from experts with clinical experience and carefully considering what definitions to use and how the thresholds map onto what is intended by the diagnostic criteria.
Merikangas noted that another issue that deserves careful consideration is the role of informants. There has been a lot of discussion about
______________
2Merikangas, K.R., He, J.P., Brody, D., Fisher, P.W., Bourdon, K., and Koretz, D.S. (2012). Prevalence and treatment of mental disorders among U.S. children in the 2001-2004 NHANES. Pediatrics, 125(1), 75-81; Merikangas, K.R., He, J.P., Burstein. M., Swanson, S.A., Avenevoli, S., Cui, L., Benjet, C., Georgiades, K., and Swendsen, J. (2010). Lifetime prevalence of mental disorders in U.S. adolescents: Results from the National Comorbidity Survey Replication-Adolescent Supplement (NCS-A). Journal of the American Academy of Child and Adolescent Psychiatry, 49(10), 980-989.
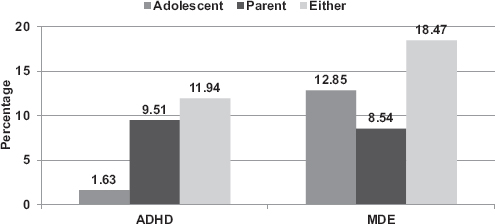
FIGURE 2-2 Lifetime prevalence of ADHD and MDE by different informants, NCS-A
NOTE: The “either” bars reflect adolescent and parent reports combined at symptom level using an “or” rule.
SOURCE: Workshop presentation by Kathleen Merikangas, June 2015.
the relative advantages of children’s reports and parents’ reports over the years: it seems that who is most knowledgeable depends on the specific question and the disorder. In addition, some research indicates that for children under the age of 12, teacher reports may also be necessary in order to increase reliability. Figure 2-2 shows differences in the NCS-A data in reporting between adolescents and parents for ADHD and major depressive episode (MDE). In the case of ADHD, the parents’ estimates are more than five times higher than those of the adolescents. In the case of MDE, a different pattern emerges: the adolescents were more likely to report criteria for major depression than the parents. In the case of disorders such as depression and anxiety, it appears that the older the child, the less likely parents are to be able to provide adequate information, Merikangas said. Teachers are also likely to underestimate mood disorders or anxiety disorders, particularly social anxiety.
Another consideration, Merikangas noted, is the large proportion of children with more than one disorder. In the NCS-A study, approximately 40 percent of the adolescents with a disorder had multiple disorders. In other words, reports of the percentage of children with various disorders tend to count the same children under several disorders. In addition, data from the recent Neurodevelopmental Genomics Study show that there is an association between the severity of mental disorders and physical disorders. This association suggests that in order to understand impairment, it is important to learn as much as possible about a child, including
information about the full spectrum of physical and mental conditions, and the home environment.
Merikangas said that the studies that have been conducted over the years have yielded a wealth of information about the magnitude and correlates of mental disorders in children, in addition to simple prevalence estimates. However, there are several limitations. The cross-sectional design of the studies means that the data collection is limited to one point in time. In some cases, such as the NHANES, the number of disorders captured is very limited. Measures of psychosis are missing from all the nationally representative surveys conducted in the United States, although they are usually included in similar surveys in other countries. Developmental disorders are also missing and would be important to include if there is an interest in impairment. Finally, there are inconsistencies in the reporting depending on the informant, and the lack of data from teachers is also a limitation. Merikangas pointed out that although the nationally representative surveys sometimes lack depth of information, there are several regional studies that have collected rich, comprehensive data, including in the Northwest, the Smoky Mountain region, New York state, and Puerto Rico.
Thinking about SAMHSA’s mandate to produce prevalence estimates of children with serious emotional disturbance, Merikangas said that there are several challenges that are particularly important to consider. One challenge is that the instruments available to measure child serious emotional disturbance are tied to the DSM system, which has limited predictive or biologic validity. In addition, Merikangas noted, there is increased dissatisfaction with the DSM-5, in particular, for certain applications. The DSM is also not typically used outside of the United States. Other countries use the International Classification of Diseases (ICD), currently the ICD-10, and the two systems are not comparable. The field as a whole needs to begin a discussion about why the United States has its own version of diagnostic criteria and how those can be mapped to the ICD-10.
Another challenge, Merikangas noted, is related to defining serious emotional disturbance for children younger than 6. The average 6- or 7-year-old with ADHD is likely to have had other difficulties by that age, so finding a way to expand the data collection to include children under 6 will be important. The NCS-A is an example of a project that involved expanding an existing survey to include adolescents, but something similar could not easily be done for children younger than 6 because the issues characteristic of that age group are very different. In addition, as mentioned, comorbidity, both among mental disorders and with physical conditions, is pervasive, and it will be important to find a way to integrate such information into defining impairment in children.
THE ROLE OF MEASURING FUNCTIONAL IMPAIRMENT
Glorisa Canino (University of Puerto Rico) provided an in-depth overview of the concept of functional impairment and its role as part of measuring serious emotional disturbance in children. She proposed defining impairment on the basis of the International Classification of Functioning, Disability and Health for Children and Youth (ICF-CY), which describes disabilities as negative functional outcomes resulting from health conditions, involving significant deviation from or loss of “normal” or “expected” function. Negative functional outcomes can occur at the individual level, for example, if a child has difficulties with some activities. They can also occur in a social context, for example, as difficulties with participation in contexts involving family, school, peers, or the community at large.
The ICF-CY definition implies that impairment should be viewed as separate from the disorder or health condition. However, Canino noted, in mental health, this separation is not possible because of the absence of biological markers or clinically useful measurements of severity: without such markers or measurements, it is not possible to separate normal and pathological symptom expressions. This is particularly true in the case of disorders in children, because it is very difficult to assess what is normal and what is pathological. As a result, a diagnostic criterion requiring distress and disability has been used to establish disorder thresholds in the DSM. Thus, the definition of the health condition is dependent on the presence of functional impairment.
However, as discussed during Russell’s presentation (see Chapter 1), the legislation governing the provision of mental health services separates diagnosis and impairment, and the presence of impairment is a necessary condition for the purposes of allocating funds. Insurance companies also use similar definitions.
Indeed, impairment is the best predictor of need for services, Canino said. Declines in functioning and unexpected deviations in behavior are the most common reasons that parents first seek mental health services for children. Impairment in functioning is more likely to lead parents to seek treatment for their children than a psychiatric disorder. Furthermore, most epidemiologic studies find that the perception of disability is more significant than a diagnosis in predicting the use of mental health services.
Impairment is also the pivotal information basis for decisions about interventions, Canino said. While diagnosis is important for prognosis, impairment tends to be the determining factor in planning and developing interventions. Furthermore, improvement in functioning is the main outcome used for determining the effectiveness of an intervention.
Another reason that impairment is important is its prevalence. As discussed by Merikangas, approximately 5 percent of children had a definite
or severe impact score based on the SDQ that was part of the 2001-2003 NHIS. Even higher prevalence rates were found in the 2010-2012 Medical Expenditure Panel Survey data, discussed by Benjamin Druss below, which estimated that 11 percent of children have severe mental health impairment, as measured by the Columbia Impairment Score (CIS). As Merikangas pointed out earlier, different definitions and instruments can lead to different prevalence estimates, which underscores the need for operationalizing substantial impairment.
Canino said that the criteria for establishing the symptom according to DSM IV or DSM-5 are well established. However, what constitutes substantial impairment in social, work, or other areas of functioning is variable and somewhat arbitrary, depending on the clinician, measurement instrument, and population-based statistical scores.
Because of the lack of conceptual clarity, some researchers determine impairment severity empirically, by establishing population norms (for example, one or two standard deviations from the mean) or by determining cutoffs based on cost or research purpose. Canino offered an illustration: for the 12-item adult World Health Organization Disability Assessment Schedule (WHO-DAS), RTI International uses a scoring system from 0 to 58. A WHO-DAS score of 17 will correspond to the 90th percentile of the population, and around 10 percent of the population will have a score higher than 17. A WHO-DAS score of 31 would translate into 5 percent of the population. Using the WHO-DAS, it is not straightforward to determine whether the 10 percent or the 5 percent figure represents the population with substantial impairment, and this is a decision that has to be made by SAMHSA.
There are other impairment scales, such as the Brief Impairment Scale (BIS) and the CIS. These instruments do not provide a severity score: rather, they simply determine whether impairment is present or not, based on the specificity and sensitivity of the instrument, using either a population-based or clinical sample.
Canino summarized the characteristics of an impairment measure that are best suited in her view to measure child serious emotional disturbance as follows:
- has scoring that is suitable to determine severity or significant impairment;
- able to assess functioning in a variety of contexts, such as school, family, friends (multidimensional);
- suitable for use with a wide range of ages;
- available for both parent and child reports;
- has good psychometric properties for the U.S. population in both English and Spanish; and
- does not require that the person administering the interview have prior knowledge of the child to make an assessment.
None of the existing measures meets all of these requirements, Canino said. The child WHO-DAS has potential because it is based on the ICF, which she considers to be the best definition of impairment or disability in children. However, use of the ICF for youth is not widely known or accepted by clinicians in the United States. There has been progress in the conceptual definition of the construct since the publication of the child ICF, but the problems for measurement persist because of the imprecise operationalization and validity of the construct for children.
Canino said she recognizes that there are both advantages and disadvantages to the ICF-CY. One of the advantages is that it is based on an international classification. Another advantage is that training manuals are available and offer criteria for clinicians for assessing different types of disability and the contextual factors (e.g., school, family, community) that can contribute to the presentation, occurrence, and outcome of disabilities. Finally, it can be useful for the treatment and prevention of both mental and physical impairments.
One of the disadvantages of the ICF-CY is that its applicability to children with serious emotional disturbance is limited, due to the operationalization challenges discussed. The WHO-DAS for adults was used successfully with adolescents in the NCS-A, but further research would be needed on the psychometric properties of the instrument, based on that study. A DSM-5 workgroup also developed a child version of the WHO-DAS, and it has been used in DSM-5 clinical trials, but psychometric data have not been published for either the English or Spanish version. Canino also noted that it is not clear who owns the copyright for the instrument, the American Psychological Association or the World Health Organization.
When thinking about other options, it is important to remember that a panel of experts convened by SAMHSA suggested that an instrument that is independent of psychiatric disorders and symptomatology should be used. This approach would exclude the impairment scales based on psychiatric symptoms, such as the DISC and the Child and Adolescent Psychiatric Assessment (CAPA).
Canino briefly covered several global and multidimensional measures that could also be considered. Table 2-1 summarizes the global measures, and Table 2-2 presents the multidimensional measures. In addition to the child WHO-DAS, there is one scale that does come close to meeting the SAMHSA criteria, and that is the Child and Adolescent Functional Assessment Scale (CAFAS). The CAFAS can be used for a wide range of ages, and it has very good psychometric properties in both English and Spanish. The disadvantage of the CAFAS is that it is long, and it does require
TABLE 2-1 Global Impairment Measures
| Impairment Measurea | Severity Score, Cutoff | Time to Administer (Minutes) | Age Range Covered | Respondent: Parent, Child, or Teacher | Advantages | Disadvantages |
| CIS | Cutoff No severity scores | 3 (13 items) | 7-17 | P, C | No training needed for administration; good psychometric properties in English and Spanish; short | No severity score, not applicable for children younger than 7; three items confounded with symptoms |
| C-GAS | Yes | 5 | 4-16 | P, C | Good psychometric properties in English and Spanish; short; severity cutoffs | Not applicable for children younger than 4; dependent on prior knowledge of the child and what interviewer/parent thinks is normal functioning; confounded with symptoms |
| SDQ-Impact | Yesb | 2 (5 items) | 2-17 | P, C, T | Good psychometrics and predictive validity in several languages, including Spanish; used in large national survey by the Centers for Disease Control and Prevention; wide age range; short | Not tested in children younger than 5; of five items, only three refer to impact; difficulty disentangling impact from symptoms; all items refer to difficulties with emotions, concentration, behavior, or getting along with others; measures outcome, not impairment |
aCIS, Columbia Impairment Scale; C-GAS, Child Global Assessment Scale; SDQ, Strengths and Difficulties Questionnaire.
bScores are 0-10: 0, no problem; 1, minor problem; 2-10, definite and severe problem.
SOURCE: Workshop presentation by Glorisa Canino, June 2015.
TABLE 2-2 Multidimensional Impairment Measures
| Impairment Measurea | Severity Score, Cutoff | Time to Administer (Minutes) | Age Range Covered | Respondent: Parent, Child, or Teacher | Advantages | Disadvantages |
| CAFAS | Yes | 30 (97 items) | 5-19 | P, C | Good psychometrics, Spanish version, severity cutoffs, wide age range, PCFAS version | Dependent on prior knowledge of the child’s symptoms and level of functioning for 10-minute administration, intertwines symptoms with impairment |
| PECFAS | Yes | 30 | 0-6 | P | Same as above | Same as above |
| BIS | Global cutoff, no severityb | 10 (23 items) | 4-17 | P | English/Spanish versions, good psychometrics, brief | No tested child version, not applicable for children younger than 4 |
| BERS | No | 15 (52 items) | 0-5, 6-18 | P, C, T | Wide age range; focuses on strengths; used mostly for placing children and treatment goals | Requires knowledge of child; has not been tested in populations other than whites; no Spanish version |
aCAFAS, Child and Adolescent Functional Assessment Scale; PECFAS, Preschool and Early Childhood Functional Assessment Scale; BIS, Brief Impairment Scale; BERS, Behavioral and Emotional Rating Scale.
bGlobal cutoff refers to results of receiver operating characteristic (ROC) curve analysis in which a cutoff is determined using external criteria (i.e., mental health service use, another instrument with known psychometric properties) to establish whether the participant is impaired or not. It does not determine severity of impairment.
SOURCE: Workshop presentation by Glorisa Canino, June 2015.
prior knowledge of the child, which is usually obtained by administering another questionnaire.
Canino concluded her talk by noting several areas where further research would be useful to narrow down the options. They include additional analysis of the psychometric properties of the child WHO-DAS or other data, such as the CIS from the Medical Expenditure Panel Survey (see below), as well as work on shortening the CAFAS. She added that forming a workgroup to assist SAMHSA with adapting or developing an impairment measure that meets the agency’s goals would also be useful.
ONGOING FEDERAL CHILD MENTAL HEALTH SURVEILLANCE SYSTEMS
Susanna Visser (Centers for Disease Control and Prevention, CDC) discussed the data available from ongoing federal child mental health surveillance systems. Her presentation was based on a report that was the culmination of a multiagency project to produce an inventory of ongoing and recurring federal efforts to monitor mental disorders in children.3 The goals of such efforts are to (1) document the impact of children’s mental health and mental disorders; (2) document the mental health needs of children; (3) build effective programs and services for children and families; (4) inform research on factors that increase risk and promote prevention; and (5) inform policy and resource allocation.
The report compiled information on the prevalence of specific mental disorders and other indicators of mental health among children, which is a first step toward better understanding of the disorders and their impact. With this initiative, the CDC wanted to contribute its expertise in the area of surveillance to an issue that is important to many agencies.
The surveillance systems reviewed are as follows:
- Autism and Developmental Disabilities Monitoring Network
- National Health and Nutrition Examination Survey
- National Health Interview Survey
- National Survey of Children’s Health
- National Survey on Drug Use and Health
- National Violent Death Reporting System
- National Vital Statistics System
- National Youth Risk Behavior Survey
- School-Associated Violent Death Surveillance Study
- National Comorbidity Survey Replication Adolescent Supplement
______________
3Centers for Disease Control and Prevention. (2013). Mental health surveillance among children—United States, 2005-2011. Morbidity and Mortality Weekly Report, 62 (Supplement 2).
Visser noted that the list does not include the NCS-R because it is not a recurring survey, and therefore it cannot be described as a surveillance system, but it does provide a wealth of information and it would be useful to repeat.
The report summarizes key information about the data collections, including who is included (e.g., age, sample size, any oversamples); the geographic coverage (e.g., national estimates, state estimates, limited number of sites); the topics covered (e.g., general health, conditions, diagnoses, symptoms); who provided the information (e.g., parents, self-reports); when the data were collected and what time periods are covered by the questions (e.g., current diagnosis, past month, past year, ever); and data collection mode (e.g., telephone, in-person, administrative records).
The report concluded that recurring information that meets surveillance criteria is available for seven disorders: ADHD, disruptive behavioral disorders, autism spectrum disorders, anxiety, depression, substance use disorders, and Tourette syndrome. In addition, there are also indicators available for suicide and mentally unhealthy days. Looking at all disorders across the different surveillance systems, Visser noted that it is clear that all demographic groups are affected by mental disorders. Another report finding is that the proportion of children with a mental disorder increases with age, with the exception of autism spectrum disorders. Among children, boys are more likely than girls to have most of the conditions.
The data from these various sources can also be used to focus in on a demographic group of interest. For example, for adolescents between the ages of 12 and 17, the 2010-2011 National Survey of Drug Use and Health (NSDUH) provides data on major depressive episode in the past year (8.1 percent), illicit drug use disorder in the past year (4.7 percent), alcohol use disorder in the past year (4.2 percent), and cigarette dependence in the past month (2.8 percent). The 2010 National Vital Statistics System shows that suicide was the second leading cause of death among adolescents aged 12-17 and that the suicide rate is 4.5/100,000 children. The 2005-2010 NHANES data show that 8.3 percent of 12- to 17-year-olds reported 14 or more mentally unhealthy days in the past month.
An advantage of having national surveys that include these types of indicators is that they provide population estimates that help in understanding the relative sizes of the groups with various disorders, which helps with resource planning: see Figure 2-3. However, Visser noted, there are also some data gaps and challenges. One limitation is that many surveillance systems exclude undiagnosed cases, instead relying heavily on parents’ receiving a diagnosis from a health care provider and then reporting that accurately. Another limitation is that data are not readily available on some conditions, especially specific anxiety disorders and
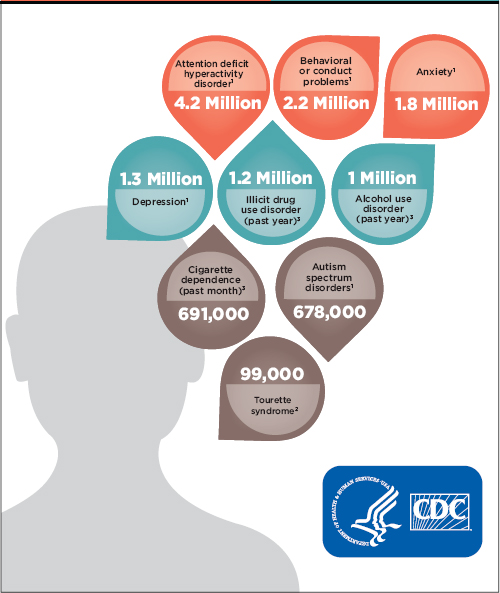
FIGURE 2-3 Estimates of U.S. children with mental disorders.
NOTE: The data cover children aged 3-17 except as follows: for Tourette syndrome, they cover children aged 6-17, and for illicit drug use disorder, alcohol use disorder, and cigarette dependence, they cover children aged 12-17.
SOURCE: Workshop presentation by Susanna Visser, June 2015, based on Centers for Disease Control and Prevention, available: http://www.cdc.gov/media/dpk/2013/docs/Child_menatal_health/Child_menatal_health_infographic.pdf [October 2015].
bipolar disorder. Due to the lack of consistency in the definitions among the surveys, it is not possible to calculate an overall estimate of the prevalence of all mental disorders in children. As others mentioned, the criteria for mental disorders can be subjective, especially in the case of ratings of impairment. Parents, children, and teachers frequently disagree on impairment. In addition, there is very little validation of case ascertainment methods for surveillance.
Visser said that sometimes it is necessary to rely on more than one type of data source to estimate prevalence rates. For example, for research on ADHD, the national survey data, community-based studies, and administrative records are complementary sources, each with its own strengths and limitations.
The national surveys, which typically include parents, are a very efficient method for collecting these data. With this approach, very large sample sizes are possible, and they produce estimates that are generalizable and sometimes available even at the state level. The repeated surveys also allow for monitoring trends over time. The main limitations of these surveys are declining response rates, coverage bias, recall bias, and reporting bias.
Data from community-based studies that involve either direct assessments of children or some other type of active surveillance case assessment tend to have more depth and breadth than data from the national surveys. These studies also allow for hypothesis generation and testing. However, Visser noted, coverage bias and lack of generalizability are among the main limitations of these data sources. Response rates are also declining in community-based studies, with families becoming increasingly more reluctant to engage in public health research in general.
In terms of administrative records, Medicaid data are available in every state and for a large number of cases. Using these data also allows for monitoring trends over time. However, the data are submitted for the purposes of payments and contain limited clinical information. Coverage bias is also a limitation for Medicaid records because only a subset of the population is included.
Visser used ADHD as an example of how different data sources can be combined to better understand a disorder. Table 2-3 shows that from 2007-2008 to 2011 there has been an increase in the prevalence of children ever diagnosed with ADHD or current ADHD in the NHIS, but the highest estimate comes from the 2007 National Survey of Children’s Health (NSCH). The two surveys ask about diagnosed ADHD in the same way, but the NSCH is a telephone interview, so the differences seem to indicate a mode effect. The rate of current ADHD in the 2007 NSCH was 6.8 percent.
The large sample sizes of the national surveys, such as the NSCH,
allow for detailed analyses of ADHD by age group, and the annual administration allows for the close monitoring of cohort effects. The NSCH also produces state-level estimates, and indeed there is great geographic variability in parent-reports of diagnosed ADHD among the states, Visser noted. Nevada has the lowest rate (4.2 percent), and Arkansas and Kentucky have the highest rates (14.6 and 14.8 percent, respectively). Nevada is the only state that requires preauthorization for psychotropic medications for children of all ages, and information about these policy differences among the states can be combined with the data for analytic purposes.
Visser mentioned the concerns associated with declining telephone survey response rates in the NSCH, which were also discussed by Kogan (see below). Despite those concerns, however, the survey estimates and data obtained from administrative records can be remarkably similar. For example, there is high convergent validity between the NSCH estimates of ADHD for insured children between the ages of 5 and 11 in the state of California (4.2 percent) and physician-diagnosed ADHD data from Kaiser Permanente Southern California (4.5 percent).
An analysis of survey data and administrative data in Georgia found that the percentage of children with administrative claims for ADHD, especially medicated ADHD, was comparable to state-based survey estimates of ADHD. In addition, use of administrative data, such as the Georgia Medicaid files, also allowed for further in-depth analyses. For example, the researchers found that the rate of ADHD medication increases with age, but the rate of psychological services does not increase, despite the fact that best practices call for a combination of both for children 6 and older.
The CDC currently operates four community-based sentinel sites, where it has been conducting direct assessments of children since 2003, using the DISC and other instruments. These sites also allowed CDC to examine how the changes in the DSM might affect the estimates of ADHD prevalence. Based on data from the Project to Learn about ADHD, the researchers found that approximately 30 percent of the children will meet the criterion when six or more symptoms are required.4 The estimate does not change when the criterion of onset before age 12 is added. When the criterion of two or more moderate impairments or one severe impairment is added, the estimate drops to 22 percent. The biggest drop, to 11 percent, occurs with the addition of teacher reports, specifically, at
______________
4McKeown, R.E., Holbrook, J.R., Danielson, M.L., Cuffe, S.P., Wolraich, M.L., and Visser, S.N. (2015). The impact of case definition on attention deficit hyperactivity disorder prevalence estimates in community-based samples of school-aged children. Journal of the American Academy of Child & Adolescent Psychiatry, 54(1), 53-61.
TABLE 2-3 Prevalence of Children Aged 3–17 Years Who Ever Received a Diagnosis of ADHD or Who Currently Have ADHD, by Sociodemographic Characteristics and Year
| Characteristic | Ever Received a Diagnosis of ADHD (Parent Report) |
|||||
| NHIS 2007–2008 (N = 14,970) |
NHIS 2009–2010 (N = 18,411) |
|||||
| % | (95% CI) | % | (95% CI) | |||
| Sex | ||||||
| Male | 10.6 | (9.7–11.4) | 11.5 | (10.7–12.3) | ||
| Female | 4.6 | (4.0–5.3) | 5.4 | (4.8–6.0) | ||
| Age Group | ||||||
| 3–5 | 2.1 | (1.5–2.8) | 2.5 | (1.9–3.4) | ||
| 6–11 | 7.4 | (6.6–8.3) | 8.2 | (7.4–9.0) | ||
| 12–17 | 10.8 | (9.8–11.8) | 11.9 | (11.0–12.9) | ||
| Race/Ethnicitya | ||||||
| Hispanic | 4.1 | (3.4–4.9) | 4.6 | (3.9–5.4) | ||
| Black, non-Hispanic | 8.1 | (6.9–9.5) | 10.3 | (9.1–11.7) | ||
| White, non-Hispanic | 9.1 | (8.3–10.0) | 10.0 | (9.2–10.8) | ||
| Multirace, non-Hispanic | 10.2 | (7.3–14.0) | 11.5 | (8.6–15.2) | ||
| Other, non-Hispanic | 3.1 | (1.8–5.3) | 2.0 | (1.4–2.9) | ||
| Highest Education in Householdb | ||||||
| Less than high school | 6.5 | (4.9–8.5) | 7.9 | (6.5–9.5) | ||
| High school graduate | 8.9 | (7.8–10.1) | 10.5 | (9.3–11.7) | ||
| More than high school | 7.4 | (6.8–8.2) | 8.0 | (7.4–8.7) | ||
| Health Insurance | ||||||
| Yes | 7.9 | (7.3–8.5) | 8.7 | (8.2.9.3) | ||
| No | 5.4 | (4.2–6.9) | 5.9 | (4.6–7.5) | ||
| Region | ||||||
| Northeast | 6.8 | (5.8–8.0) | 8.6 | (7.4–9.9) | ||
| Midwest | 8.8 | (7.5–10.2) | 9.4 | (8.3–10.7) | ||
| South | 8.9 | (8.0–10.0) | 10.1 | (9.2–11.0) | ||
| West | 5.1 | (4.3–6.0) | 5.2 | (4.4–6.1) | ||
| Poverty-Income Ratioc | ||||||
| ≤100% FPL | 8.9 | (7.5–10.4) | 11.4 | (10.1–12.7) | ||
| >100% to ≤200% FPL | 8.6 | (7.3–10.0) | 9.2 | (8.0–10.6) | ||
| >200% FPL | 6.9 | (6.3–7.6) | 7.1 | (6.5–7.8) | ||
| Total | 7.6 | (7.1–8.2) | 8.5 | (8.0–9.0) | ||
NOTES: ADHD, attention deficit hyperactivity disorder; CI, confidence interval; FPL, federal poverty level; NHIS, National Health Interview Survey; NSCH, National Survey of Children’s Health.
aOther, non-Hispanic, includes American Indian/Alaska Native, Hawaiian/other Pacific Islander, and Asian. Persons categorized as multirace selected more than one race.
bThe highest education in the household is based on the highest education of adults in the sample child’s family for NHIS and on the education of parents or respondents (adults) for NSCH.
| Current ADHD (Parent Report) | ||||||
| NHIS 2011 (N = 10,554) | NSCH 2007 (N = 78,042) | NSCH 2007 (N = 78,042) | ||||
| % | (95% CI) | % | (95% CI) | % | (95% CI) | |
| 12.0 | (11.0–13.1) | 12.3 | (11.6–13.1) | 9.6 | (8.9–10.4) | |
| 4.7 | (4.0–5.6) | 5.3 | (4.8–5.9) | 3.8 | (3.4–4.2) | |
| 2.1 | (1.4–3.0) | 1.5 | (1.1–1.9) | 1.1 | (0.9–1.5) | |
| 8.4 | (7.4–9.5) | 9.1 | (8.3–9.9) | 7.5 | (6.8–8.2) | |
| 11.9 | (10.7–13.2) | 12.4 | (11.5–13.3) | 8.8 | (8.1–9.6) | |
| 5.6 | (4.6–6.8) | 5.4 | (4.4–6.6) | 4.0 | (3.1–5.0) | |
| 8.8 | (7.3–10.5) | 10.0 | (8.8–11.4) | 7.7 | (6.6–9.0) | |
| 10.1 | (9.1–11.2) | 10.0 | (9.4–10.6) | 7.6 | (7.0–8.1) | |
| 5.5 | (3.4–8.6) | 13.0 | (10.4–16.2) | 10.2 | (7.9–13.0) | |
| 4.1 | (2.4–6.9) | 4.0 | (3.1–5.1) | 3.0 | (2.2–3.9) | |
| 7.7 | (6.1–9.7) | 8.5 | (7.1–10.2) | 6.6 | (5.3–8.1) | |
| 7.5 | (6.3–9.0) | 11.8 | (10.5–13.2) | 8.7 | (7.7–9.8) | |
| 8.8 | (8.0–9.7) | 8.1 | (7.6–8.7) | 6.3 | (5.8–6.8) | |
| 8.7 | (8.0–9.5) | 9.2 | (8.7–9.7) | 7.1 | (6.7–7.6) | |
| 4.7 | (3.2–6.7) | 6.3 | (4.9–8.2) | 3.5 | (2.7–4.5) | |
| 7.5 | (6.0–9.4) | 8.8 | (7.8–9.9) | 7.0 | (6.1–8.0) | |
| 8.7 | (7.3–10.3) | 9.3 | (8.6–10.1) | 7.1 | (6.5–7.8) | |
| 10.3 | (9.2–11.6) | 10.3 | (9.5–11.1) | 7.7 | (7.1–8.5) | |
| 6.0 | (4.9–7.3) | 6.6 | (5.4–7.9) | 4.8 | (3.9–6.0) | |
| 10.5 | (8.9–12.4) | 11.1 | (9.9–12.4) | 8.7 | (7.7–10.0) | |
| 6.7 | (5.6–8.1) | 9.7 | (8.6–11.0) | 7.2 | (6.3–8.3) | |
| 8.3 | (7.5–9.3) | 8.0 | (7.5–8.6) | 6.1 | (5.6–6.6) | |
| 8.4 | (7.8–9.1) | 8.9 | (8.4–9.4) | 6.8 | (6.4–7.2) | |
cFPL is based on family income and family size and composition using federal poverty thresholds that are updated annually by the U.S. Census Bureau using the change in the average annual consumer price index for all urban consumers. For details, see: http://www.census.gov/hhes/www/poverty/index.html [October 2015].
SOURCE: Workshop presentation by Susanna Visser, June 2015, based on Centers for Disease Control and Prevention (2013). Mental health surveillance among children—United States, 2005–2011. Morbidity and Mortality Weekly Report, 62 (Supplement 2).
least four teacher-reported symptoms. This difference underscores the importance of who is providing the information, especially in the case of direct assessments.
Visser concluded by saying that future comprehensive surveillance systems could benefit from consistent case definitions and validation of methodologies. To address SAMHSA’s goals of producing estimates of serious emotional disturbance in children, combining mixed and multiple methods will be necessary, because no one system has everything that is needed, and combining methods can improve the data. Leveraging partnerships among agencies will also be important in developing better estimates.
IMPAIRMENT DATA FROM THE MEDICAL EXPENDITURE PANEL SURVEY
Benjamin Druss (Emory University) began his presentation by synthesizing some of the themes from previous presentations. Some of the questions that the workshop and the overall study are addressing are long-standing, fundamental issues related to the classification of diseases. Prior to 1952, there was little agreement regarding definitions of various disorders and impairments, and a common language for how to think about these issues only emerged gradually with the different releases of the DSM.
One issue that has been discussed is the need to think of these disorders and impairments as a continuum, rather than as categorical diagnoses, Druss said. There is a tendency to think that a person either has a disorder or does not have it. This kind of characterization is also linked to how mental health services are reimbursed. Furthermore, especially for children, it is important to understand their functioning in different contexts, such as school, home, and with friends. This issue underscores the importance of thinking about the role of the survey informant (the parent, teacher, or child providing the information). Another challenge that has been discussed is separating impairment from symptoms, but impairment is how illness is generally defined, and ultimately it is impairment that matters. Yet this topic, too, deserves further discussion, Druss noted.
From the perspective of research on services, one limitation of the available administrative data is that they only include people who are receiving services. The denominator of interest would be the people who have the illness. Druss described some of his research, which has focused on attempting to match rising rates of service use with the rates of impairment that are measured by a large-scale survey. Between 1995 and 2010, there was a doubling in mental health visits and a fivefold increase in the use of psychostimulants in the United States among children under 18.
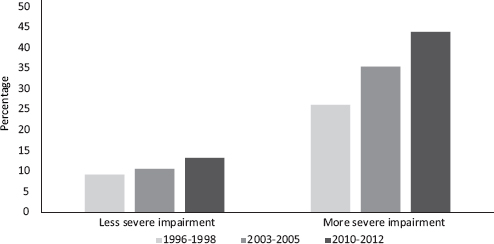
FIGURE 2-4 Percentage of children using any mental health services by impairment.
NOTE: More severe odds ratio 2.2 (1.76-2.75); Less severe odds ratio 1.51 (1.35-1.72).
SOURCE: Workshop presentation by Benjamin Druss, June 2015. Data from the Medical Expenditure Panel Survey.
It is important to understand whether these increases reflect a need that is now being better met (that is, whether there are more children with a demonstrated need who are being treated) or if there is an increase in the treatment of children with less serious symptoms. This question is also relevant because most treatments have only been tested among those with diagnosed conditions.
Druss described the work he and his colleagues, Mark Olfson (Columbia University) and Steven Marcus (University of Pennsylvania), conducted using data from the Medical Expenditure Panel Survey (MEPS).5 The MEPS is primarily a service use survey, rather than an epidemiological survey, and it has included the Columbia Impairment Scale since the 1990s. As discussed earlier, the CIS is a measure of impairment across different domains. Although similar to other measures, the CIS also makes it difficult to tease some of the concepts apart.
Comparing data from 1996-1998, 2003-2005, and 2010-2012, the study found that, contrary to what one might expect, there was a modest decrease in impairment among children and adolescents from 12.5 percent in 1996-1998 to 10.5 percent in 2010-2012. At the same time, there was an increase in service use, and the MEPS data show that the rate of increase was more rapid among children with more severe impairments: see Figure 2-4. If impairment is a proxy for need for services, then this is
______________
5Olfson, M., Druss, B.G. Druss, and Marcus, S.C. (2015). Trends in mental health care among children and adolescents. New England Journal of Medicine, 372, 2029-2038.
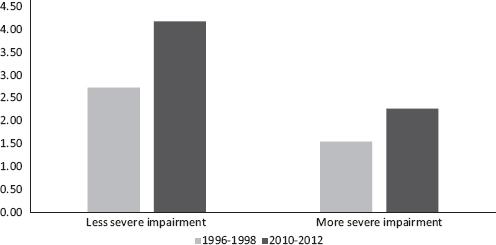
FIGURE 2-5 Number of children using any mental health services by impairment.
NOTES: 1.45 million increase in users with less severe impairment; 0.72 million increase in users with more severe impairment.
SOURCE: Workshop presentation by Benjamin Druss, June 2015. Data from the Medical Expenditure Panel Survey.
what one would want to see. However, the absolute numbers tell a different story. Between 1996-1998 and 2010-2012, there was a 1.45 million increase in the number of users of mental health services with less severe impairment and a 0.72 million increase in the number of users with more severe impairment: see Figure 2-5. In other words, while relative growth in treatment is greater among children with more severe impairment, absolute growth has been concentrated among those with less severe impairment.
Druss concluded by saying that epidemiological data can provide information about the need for services (the denominator), while service use data can provide the numerator for this type of research. The implications for SAMHSA, and possibly the NSDUH, are that including overall impairment data can be useful and may serve as a proxy for treatment need. Measuring disease burden alongside service use data can provide stronger policy relevance than either used alone.


