
3
Quantities Available for Beneficial Use and
Potential Impacts on Water Demand
Graywater and stormwater can be used in many applications to reduce the reliance on conventional water supply sources (Chapter 2), but the availability of that water varies in most cases locally, regionally, and by source area and land use. This chapter presents an approach that can be used to examine the quantities of graywater and stormwater available for beneficial uses and the potential impacts on water demand for various applications. The results from a medium-density residential scenario at six U.S. locations are discussed.
GRAYWATER
Graywater can be reused in the residential setting, at household, multi-residential, and even regional scales, and in commercial and industrial settings. Each offers different quantities available for reuse and different potential impacts on water demand.
Household and Multi-residential Use
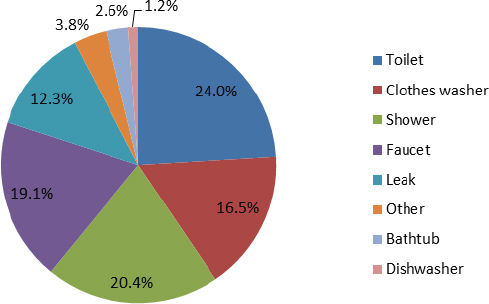
Indoor water use has been determined to be largely consistent throughout the United States and among varying socioeconomic groups (Mayer and DeOreo, 1999). Thus, residential graywater production does not vary regionally, and graywater can be considered a more consistently available source of water than stormwater in arid regions. A study by DeOreo et al. (2016)1 revealed that indoor water use in nine North American cities was on average 138 gallons per household per day (gphd) or 59 gallons per capita per day (gpcd; 522 liters per household per day [lphd] and 220 liters per capita per day [lpcd]). Based on these data, graywater2 comprises approximately 45 percent of household wastewater (Figure 3-1).
In a typical household, the graywater produced (63 gphd or 26 gpcd [240 lphd or 98 lpcd]) exceeds the demand for toilet flushing (33 gphd or 14 gpcd [120 lphd and 53 lpcd]; Figure 3-1), enabling use of graywater to meet the total toilet flushing demand in residential settings, with excess graywater available for irrigation or other nonpotable uses (DeOreo et al., 2016). Use of graywater for toilet flushing alone would reduce indoor water demand on average by 24 percent. For comparison, a study on 10 homes using graywater to flush toilets showed consistent reductions in water use of 6 gpcd (23 lpcd; City of Guelph, 2012). This is lower than the previous reported savings of 14 gpcd above, but 8 of the 10 homes were using low-flow toilets (1.2 gallons [4.5 liters] per flush). Case studies report savings from toilet flushing ranging from 5.4 gpcd [20 lpcd] in a dormitory setting (Box 2-2) and 20 gpd [76 lpd] per inmate in a prison setting (Box 1-1).
Indoor water use does not vary substantially between single residence and multi-residential units when reported on a per-capita basis (Mayer and DeOreo, 1999). Thus, water savings reported in this chapter also apply to multi-residential units and regional-scale applications. For example, if graywater were used for all of the toilet flushing needs in a multi-residential unit with 100 housing units, then assuming 33 gphd water use for toilet flushing and no change in water use behavior as the result of graywater reuse, a total of 3,300 gallons (12,000 liters) water per day could be saved in the building.
Water savings achieved by using graywater instead of potable water for irrigation will depend on irrigation demand. If all residential graywater is used for irrigation to replace prior watering using potable supplies, then potable water demand can be reduced by 63 gphd (240 lphd), the av-
__________________
1 When this report was written and then approved by the National Academies of Sciences, Engineering, and Medicine, the committee referenced a research paper, DeOreo and Mayer (in press), which was subsequently published as DeOreo et al. (2016). The per capita water use data reported in the final paper differed from the preliminary data provided to the committee (M. Hodgins, WaterRF, personal communication, 2013)—the same household water use data were reported but the final analysis reported fewer persons per household, resulting in higher per capita water use values (for details, see Box 3-1). The newer data did not change the committee’s findings, conclusions, or recommendations; however, the text and Figure 3-4 were updated with the newer data.
2 As defined in Chapter 1, graywater includes water from bathroom sinks, showers, bathtubs, clothes washers, and laundry sinks but does not include water from toilets, kitchen sinks, or dishwashers.
erage graywater available. This is typically not enough water to meet the entire outdoor residential demand in most areas, depending on the vegetation being irrigated. Native vegetation requires minimal additional irrigation, while turfgrass in arid regions could demand substantial irrigation volumes. In areas where irrigation is seasonal, the noted reduction in irrigation demand resulting from graywater use will only occur during irrigation months. Thus, water demand reduction associated with seasonal graywater irrigation will be lower than 63 gphd over the course of the year.
A common practice at the household scale is to use laundry water to irrigate landscape vegetation, particularly because systems can be installed in existing households without major plumbing retrofits (SFPUC, 2012; see Box 2-4). Laundry water makes up about 36 percent of household graywater on average, or 9.6 gpcd (DeOreo et al., 2016). Thus, savings of approximately 23 gphd (87 lphd) can be achieved when all of the laundry water is used for landscape irrigation, compared to 63 gphd when all graywater is used. These savings can only be realized if irrigation rates do not increase with installation of the graywater system. Laundry-to-landscape initiatives in Long Beach and San Francisco, California (Box 2-4) documented more households with water demand increases than decreases after installation of graywater systems. In Long Beach, only 7 of the 33 homes showed a reduction in water use, and program-wide an average household increase of 700 gallons (2,600 liters) per month was observed (City of Long Beach, 2013). In San Francisco, 29 sites had increased water use compared to 27 sites with reduced water use (P. Kehoe, SFPUC, personal communication, 2014), likely from new landscape installations, variability in the data, or changes in behavior during the study period. More research is needed to evaluate the quantity of water savings actually achieved when graywater is used for irrigation and whether there are behavioral changes that result in increased use of water when graywater systems are installed (see Chapter 10).
Published Assessments of Graywater Impact on Water Demand
A modeling study evaluated potential water demand reduction from graywater use with varying irrigation demand (Reichel et al., 2011). This study calculated a 5 to 6 percent reduction in municipal water demand when 50 percent of the population adopted graywater reuse at the residential level (10 percent use for toilet flushing, 30 percent use for irrigation, 10 percent use for combined toilet flushing and irrigation). The study cities were Fort Collins, Colorado; Orlando, Florida; Philadelphia, Pennsylvania; San Diego, California; and Seattle, Washington. Although total per capita water demand reduction was greater in areas with year-round irrigation (Orlando and San Diego), the higher irrigation demand in those regions resulted in similar percentage reductions as those cities with seasonal or limited reductions. Although average water savings of 63 gphd in water demand are possible through graywater reuse, the largest savings are only likely to be achieved in new development or redevelopment
areas. Retrofitting existing homes to either collect graywater or use treated graywater for toilet flushing is a large barrier for adoption. However, new homes can easily be built with dual plumbing systems for graywater collection and use at a low marginal cost (see also Chapters 6 and 7).
Committee’s Assessment of Graywater Impact on Water Demand
To examine potential potable water savings from graywater use, the committee developed scenarios of wide-scale adoption of graywater use in six U.S. cities (Los Angeles, California; Seattle, Washington; Lincoln, Nebraska; Madison, Wisconsin; Birmingham, Alabama; and Newark, New Jersey), representing a range of climatic conditions and geographical distribution. These cities were also selected because comparable data were available on land use characteristics for all six locations that would support parallel analyses of potential water savings from stormwater or graywater use. The committee conducted an original analysis to examine changes in potable water demand for a hypothetical 100-acre (40-ha), medium-density, residential community (with 12 persons per acre) in each of the six cities. The analysis considered the following four water demand and graywater use scenarios detailed in Box 3-1:
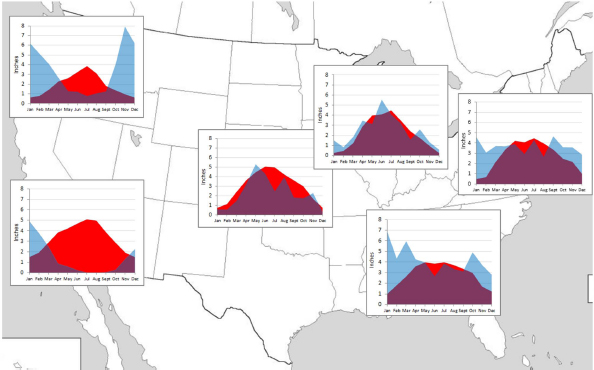
- Base scenario: Potable water is used for all indoor and outdoor household water needs. Outdoor irrigation demand was calculated as that necessary to meet the minimum evapotranspiration deficit for turfgrass (the most common household irrigated vegetation), which varies by location (see Figure 3-2).
- Scenario 1 (irrigation): Graywater and supplemental potable water as needed is used to irrigate turfgrass to barely meet the evapotranspiration deficit (see Box 3-1). Indoor potable water use is unchanged.
- Scenario 2 (toilet flushing): Water demand for toilet flushing is entirely met by graywater. Potable demand for outdoor irrigation is unchanged from the base scenario.
- Scenario 3 (irrigation and toilet flushing): Toilet flushing demands are entirely met by graywater, and remaining graywater is available to address irrigation demand, as needed.
Graywater production was estimated considering typical wastewater generation from showers, baths, laundry, and one-third of faucets (excludes kitchen sink faucets) based on preliminary data from the DeOreo et al. (2016) survey of indoor water use (M. Hodgins, WaterRF, personal communication, 2013). In each scenario, it was assumed that 100 percent of the residential population in a 100-acre, medium-
density, residential area adopted the specified graywater use practices. These scenario analyses were intended to provide an estimate of the maximum possible potential for demand reduction that can be achieved through graywater reuse and does not reflect what can be realistically achieved in the near future. See Box 3-1 for a full description of the scenario assumptions. The results were calculated by a simple spreadsheet analysis, described in Box 3-1.
The results of the scenario analysis of a medium-density residential community based on climate data from 1995 to 1999 (1996-1999 for Lincoln) (see Figure 3-3 and Table 3-1) show that average potable water demand reductions ranging from 13 percent (Los Angeles) to 26 percent (Madison, Wisconsin) are possible with graywater reuse for both irrigation and toilet flushing (Scenario 3). Such savings assume that indoor and outdoor water use habits are unchanged by this new low-cost water source, an assumption that remains untested (see Box 3-2 for discussion of key uncertainties, including behavioral factors). Reductions in potable water demand resulting from the use of graywater for irrigation vary widely with climate. Among the six cities analyzed, the lowest potential irrigation demand savings are noted for Newark, New Jersey, where there is only an irrigation demand for 4 months of the year (see Figure 3-3). Los Angeles has the highest irrigation demand of the study cities, resulting in 11 percent potable water savings, although only 17 percent of the minimum irrigation demand for turfgrass in Los Angeles is met through graywater reuse in the irrigation-only scenario. A scenario using more acreage of native vegetation would enable graywater to meet a greater percentage of irrigation demand. Additionally, areas with year-round irrigation requirements would result in greater savings than those with limited seasonal irrigation requirements. Results from these hypothetical scenarios demonstrate that use of graywater for toilet flushing decreases indoor use by 24 percent across all regions, although this savings as a fraction of overall water use is dependent on the amount of water used for irrigation (see Table 3-1).
Laundry-to-landscape systems result in even lower potential water savings, because graywater is derived only from the washing machine. Table 3-2 shows average potential water savings for laundry-to-landscape systems in the six cities analyzed, although savings would be less with water-conserving washers and greater with older washers that use more water.
Downstream Impacts from Graywater Use. In many areas of the western United States, it is important to consider impacts to downstream water users in conjunction with water savings because of considerations of water rights and environmental uses (see Chapter 8). Graywater use for toilet flushing is a nonconsumptive use of water, because water used for toilet flushing will flow either to a wastewater treatment plant or septic tank, without any significant losses in downstream flows. On the contrary, using graywater for irrigation results in evapotranspiration losses and is considered a consumptive use of water. If existing landscape irrigation with potable water is replaced with graywater, then the property would have the same effect on downstream water availability as it did prior to graywater use assuming that the wa-
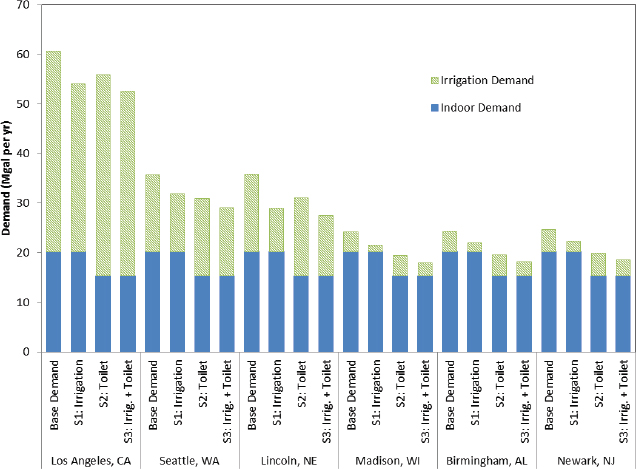
TABLE 3-1 Potential Potable Water Savings in Six Cities from Various Graywater Use Scenarios Based on a 100-Acre, Medium-Density, Residential Area
| Volume Potable Water Savings | Potable Water Savings | ||||||
| Base demand (Mgal/yr) | S1: Irrigation use only (Mgal/yr) | S2: Toilet flushing (Mgal/yr) | S3: Irrigation and toilet flushing (Mgal/yr) | S1: Irrigation use only (%) | S2: Toilet flushing (%) | S3: Irrigation and toilet flushing (%) | |
| Los Angeles, CA | 60.7 | 6.7 | 4.8 | 8.1 | 11 | 7.9 | 13 |
| Seattle, WA | 35.7 | 3.9 | 4.8 | 6.7 | 11 | 13 | 19 |
| Lincoln, NE | 35.8 | 6.8 | 4.8 | 8.4 | 19 | 14 | 23 |
| Madison, WI | 24.2 | 2.7 | 4.8 | 6.3 | 11 | 20 | 26 |
| Birmingham, AL | 24.3 | 2.3 | 4.8 | 6.2 | 9.5 | 20 | 25 |
| Newark, NJ | 24.7 | 2.3 | 4.8 | 6.2 | 9.3 | 20 | 25 |
NOTE: These savings assume that indoor and outdoor water use habits are unchanged by this new low-cost source of water, an assumption that remains untested.
TABLE 3-2 Potential Potable Water Savings Calculated for Six Cities from Laundry-to-Landscape Systems Based on a 100-Acre, Medium-Density, Residential Area
| Laundry to Landscape | ||
| Volume Potable Water Savings (Mgal/yr) | Potable Water Savings (%) | |
| Los Angeles, CA | 2.5 | 4.1 |
| Seattle, WA | 1.4 | 3.9 |
| Lincoln, NE | 2.8 | 7.7 |
| Madison, WI | 1.1 | 4.6 |
| Birmingham, AL | 1.1 | 4.5 |
| Newark, NJ | 1.1 | 4.4 |
NOTE: These savings assume that indoor and outdoor water use habits are unchanged by this new low-cost source of water, an assumption that remains untested.
ter supply is from the same watershed and not imported (the details are discussed in Box 3-3). However, if irrigation with graywater exceeds the prior irrigation rates, then impacts would be felt on downstream users. Thus, graywater use for toilet flushing, as a nonconsumptive use of water, does not pose the water rights issues that graywater irrigation does.
Graywater and Water Conservation. The committee’s estimates of potential potable water savings associated with the use of graywater (Figure 3-3) are based on the most recently available data on indoor water use in North America. Trends in indoor water use in the United States show substantially decreased water use over the past 10-15 years (Figure 3-4) from 69 gpcd (260 lpcd; Mayer et al., 1999) to 59 gpcd (220 lpcd; DeOreo et al., 2016). Water use data collected from efficient new homes (36 gpcd [140 lpcd]; DeOreo et al., 2011) suggest continued reductions in indoor water demand. Meeting targets for water efficient homes will decrease the amount of graywater available for use, although graywater is projected to continue to meet toilet demand even in a highly water efficient home (Figure 3-4). For comparison, water use in Germany (32 gpcd; leaks not included) is closer to meeting high-efficiency targets than are U.S. water users in 2014. Shower water use remains relatively constant over all samples, including older U.S. data and high-efficiency new homes (Figure 3-4), suggesting a relatively steady source of graywater. In contrast, significant reductions in laundry water use have been documented between 1999 and 2014, and further reductions are possible, reducing the contributions of a key graywater source.
As indoor water conservation fixtures continue to be installed, there is likely to be an impact on graywater quality. Despite the decrease in water used, use of personal care and cleansing products are likely to be used in similar amounts and pathogenic organisms would be loaded similarly. For example, graywater quality in a peri-urban area of Durban, South Africa, where water use was limited to 52 gphd (200 lphd), graywater chemical constituents were greater than those reported for European and U.S. homes by a factor of 2-10 (Salukazana et al., 2005). To date, a consistent trend of increasing concentrations of graywater constituents has not been observed in the United States despite decreased indoor water use over the past 10-15 years. Graywater quality is so variable (Eriksson et al., 2002; see Chapter 4), that such a trend would be difficult to detect. Nonetheless, aggressive indoor water conservation practices could render graywater of a quality in terms of organic matter and salt concentrations not suitable for use for irrigation and could increase the extent of treatment needed for all end uses as a result of increases in concentrations of pollutants due to lower dilution rates. Additional research could improve the understanding of the implications of water conservation trends on the quality and quantity of graywater and impacts on the cost-effectiveness and feasibility of specific uses (see Chapter 10).
Commercial Use
In general, commercial water use is highly variable (Dziegielewski et al., 2000; see Figure 3-5), and most commercial facilities do not generate enough graywater to render its use for either irrigation or toilet flushing worthwhile. Gleick et al. (2003) reported that restroom and laundry water represented only 16 and 2 percent, respectively, of California’s commercial and industrial sectors water use. Of the restroom water, only 11 percent was graywater (showers and hand washing basins), with the remainder used by toilet and urinal flushing. In contrast, landscaping water accounted for 35 percent of the total commercial and industrial water use, which is the largest water demand (including industrial process water). Overall, the amount of graywater generated is substantially less than the amount that could be used for irrigation or toilet flushing. Some commercial facilities and offices have on-site showers and/or facilities (e.g., hotels, fitness, and aquatic centers). Use of graywater can be beneficial at such facilities as long as showers or laundry facilities are frequently used. Although the quantity of graywater generated at hospitals is likely enough to meet toilet demands, on-site recycling of graywater at hospitals is not recommended because of the potentially large load of pathogens and high sensitivity of the population in contact with the treated graywater.
A study of water use was conducted at an office building located in Fort Collins, Colorado, occupied by nearly 1,700 employees daily that had an on-site gym with show-
ers that were perceived to be used often (Vandegrift, 2014). However, an analysis of building water use showed that the showers actually contributed less than 1 percent of the total building water use, while the toilets accounted for 10 percent. This study only evaluated one such building, so broad conclusions cannot be made. However, the data indicate that showers in office buildings may not contribute enough graywater to render graywater reuse projects feasible. On-site laundry machines in offices, hotels, and other commercial facilities may result in enough graywater generation to render reuse feasible. In this same study, 79 percent of water generated at a fitness facility was estimated to be graywater, which would easily meet the toilet demand with much excess water available for irrigation. In addition, a hotel was found to produce a substantial quantity of graywater, with an estimated 25 percent of water use in laundry, showers, and sinks (Vandegrift, 2014). Site-specific analysis of the availability of commercial graywater for onsite use is therefore necessary to determine the potential for water savings.
STORMWATER
This section explores the amount of stormwater potentially available for various beneficial uses at different scales in a community, from the smallest on-site capture of roof runoff for irrigation of surrounding landscaped areas, to large-scale community collection of stormwater in regional impoundments to augment the water supply. The amount of stormwater generated greatly depends on the amount of rainfall in the area, the land development characteristics, and the effectiveness of the stormwater collection system. The amount of the stormwater that can be effectively used by the different beneficial uses is based on complex interactions of timing of the rainfall and the desired use patterns, the ability to collect and store the runoff, and coordination with other uses and supplies. Thus, estimating the availability of stormwater to address water demands across the United States is much more complex than for graywater. This committee presents (1) an approach to identify the amount of water available from different source areas and land uses and (2) the results of an original analysis to approximate potential water savings from household-scale stormwater capture for various uses in medium-density, residential development in six different locations in the United States.
Factors Affecting the Quantity of Stormwater from Different Areas
Key factors that affect the quantity of stormwater available for beneficial use are rainfall and land development characteristics. The total amount of rainfall and the distribution of rain depths for different periods of the year vary dramatically throughout the country, affecting the quantities of runoff available for different beneficial uses. Land uses also vary by region, affecting the quantity of runoff available for large-scale stormwater collection for beneficial uses.
Rainfall Characteristics
Important factors affecting stormwater runoff quantities across the United States include the amount of the rainfall, depth of individual events, and seasonal patterns of the rains. The six locations examined by the committee represent a range of climatic conditions in the United States and are not intended to represent all of the conditions in each region, or all regions.
- Los Angeles, California, in the Southwest, having a median rainfall of about 12 inches per (30 cm) year over the long-term record (17 inches [43 cm] average during the 5-year calculation period)
- Seattle, Washington, in the Northwest, having a median rainfall of about 37 inches (94 cm) of rainfall per year (42 inches [110 cm] average during the 5-year calculation period)
- Lincoln, Nebraska, in central United States, having a median rainfall of about 26 inches (66 cm) of rainfall per year) (28 inches [71 cm] average during the 4-year calculation period)
- Madison, Wisconsin, in the Great Lakes region, having a median rainfall of about 32 inches (81 cm) of rainfall per year (30 inches [76 cm] average during the 5-year calculation period)
- Birmingham, Alabama, in the Southeast, having a median rainfall of about 54 inches (140 cm) of rainfall per year (50 inches [130 cm] average during the 5-year calculation period)
- Newark, New Jersey, in the East Coast region, having a median rainfall of about 43 inches (110 cm) of rainfall per year. (44 inches [110 cm] average during the 5-year calculation period)
Rainfall can vary greatly from year to year, and the committee’s analyses examined 4-5 years of data for each city (1995-1999). The seasonal distributions of rains at these six locations vary greatly, as shown on Figure 3-2. The West Coast locations (Los Angeles and Seattle) experience most (or all) of their rains during the winter months, the central and Great Lakes locations (Lincoln and Madison) experience more rain during the summer months, and the Southeast and the East Coast locations (Birmingham and Newark) experience more evenly distributed rains throughout the year. One of the main challenges with effective beneficial uses of stormwater, therefore, is matching water needs with available stormwater runoff, which may necessitate significant storage.
The depth of individual rainfall events also varies across the country, necessitating varied designs to appropriately capture stormwater. Medium-size rains (from about 0.5 to 2 inches [1.3 to 5 cm]) account for the majority of the annual runoff from the most common land uses in all areas, but higher percentages of the rainfall occur as runoff as the rain depth increases. For example, about 900 gallons (3,400 liters) of roof runoff would be produced from a typical 1,500 ft2 (140 m2) roof area during a 1-inch (2.5 cm) rainfall. In comparison, a more common 0.25-inch rain would produce about 200 gallons (760 liters) of runoff for this same roof area. Median rains in these six areas between 1995 and 1999 range from about 0.1 (Seattle) to 0.25 inches (Birmingham),
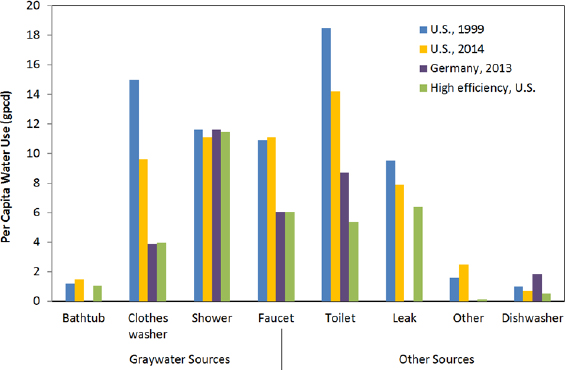
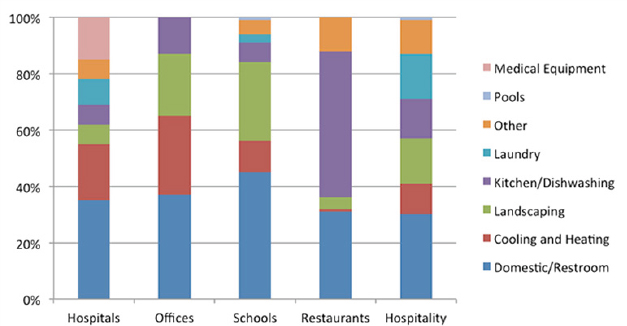
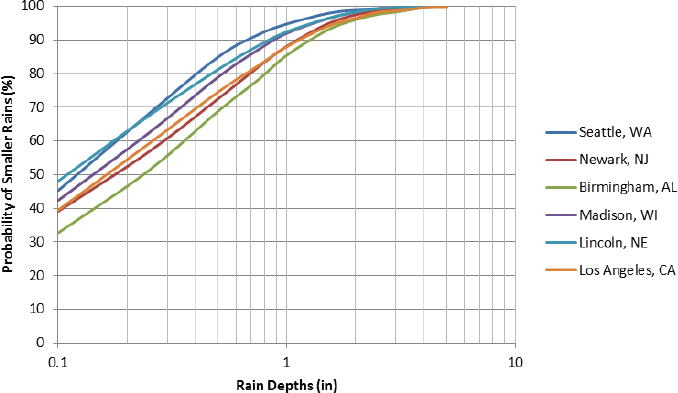
TABLE 3-3 Summary of Major Land Use Characteristics
| Los Angeles, CA | Seattle, WA | Lincoln, NE | Madison, WI | Birmingham, AL | Newark, NJ | |
| Commercial | 320,000 | 730,000 | 490,000 | 560,000 | 940,000 | 820,000 |
| Industrial | 250,000 | 630,000 | 460,000 | 450,000 | 610,000 | 710,000 |
| Medium-density residential | 210,000 | 380,000 | 260,000 | 270,000 | 310,000 | 490,000 |
NOTES: Represents more than 100 research sites in the United States. The coefficient of variation is the ratio of the standard deviation to the average value, an indication of the spread in the data. SOURCE: Pitt (2011a).
and some locations (e.g., Birmingham, Newark, and Los Angeles) have a greater percentage of heavy rainfall (greater than 1 inch) (Figure 3-6).
Land Development and Source Area Characteristics
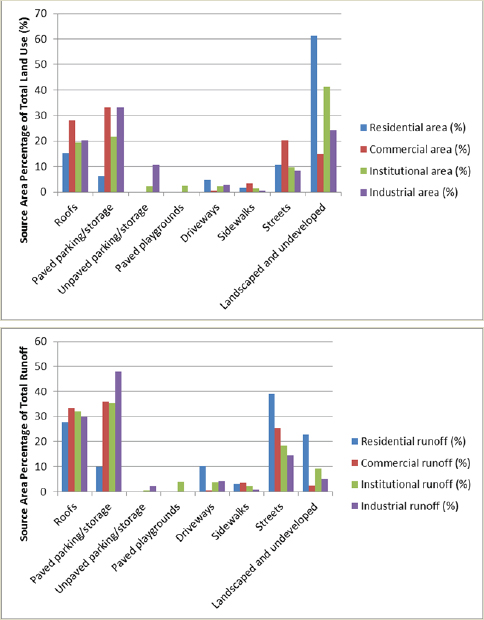
Directly connected impervious areas (e.g., roofs, streets, and paved parking areas connected directly to the drainage system) are usually responsible for most of the runoff in developed urban areas and are therefore the major source areas of runoff available for capture for beneficial uses. Partially connected impervious areas (e.g., roof drains or paved areas draining to pervious areas before entering the drainage system) contribute smaller amounts of runoff that occur later times during larger rains, while the pervious areas contribute small flows and only after substantial rain has occurred. However, pervious areas can be important sources of runoff in residential areas and other land uses where landscaped and undeveloped land comprise a large portion of the land area (Figure 3-7). Average percentages of directly connected impervious areas, partially connected impervious areas, and pervious areas for six major land use categories from locations throughout the country are shown in Table 3-3.
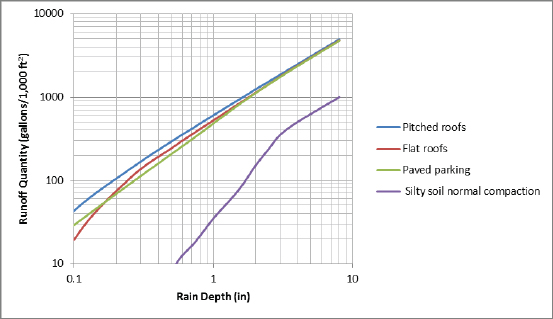
Mathematical models can be used to calculate the stormwater runoff available for different rainfall events, surface materials, and land characteristics, highlighting both the quantities available for beneficial use and the associated storage challenges (Figure 3-8). Table 3-4 shows the calculated associated annual stormwater runoff yields for the six locations examined. These runoff amounts and the fraction of rainfall that is converted to runoff (or runoff coefficient, see Table 3-5) vary significantly for different land uses and locations. However, the extent to which conventional water demand can be reduced will depend upon the amount of storage provided, the water demand, and the timing of rainfall relative to water demand.
The feasibility of household- or building-scale stormwater capture for irrigation purposes depends on the ratio of the roof area to the area to be irrigated. Areas having relatively small roofs and large landscaped areas may not be able to supply sufficient quantities of water to meet irrigation demands, depending on the rainfall patterns and storage tank sizes. Areas having large roof areas compared to the adjacent landscaped areas (e.g., commercial buildings) could have abundant water for irrigation, in which case excess stormwater could be made available for other beneficial uses.
Committee Scenario Analysis of Stormwater Availability for Household-scale Water Uses
Roof runoff offers the most suitable source for building-scale stormwater collection for beneficial uses because of its generally better water quality (see Chapter 4), high runoff yield per unit area, and elevation above storage tanks and irrigated land (which reduces energy use). To assess the capacity for rooftop runoff to address on-site water demands, the committee analyzed four scenarios in each of six geographical locations in the United States (Los Angeles, California; Seattle, Washington; Lincoln, Nebraska; Madison, Wisconsin; Birmingham, Alabama; and Newark, New Jersey), parallel to the graywater analysis (detailed in Box 3-1):
- Base scenario: Potable water is used for all household water needs (indoors and outdoors), using the same base scenario assumptions as described in the graywater analysis discussed earlier in this chapter. The land surface characteristics represented by medium-density, residential development in each of the six locations (e.g., percentage landscaped area [needed for irrigation calculations] and roof area [needed for runoff quantities]) vary based on site characteristics and are outlined in Appendix A.
- Scenario 1 (irrigation): Rooftop runoff is captured and used to irrigate landscaped areas and offset potable water demand to meet the evapotranspiration deficit for turfgrass.
- Scenario 2 (toilet flushing): Rooftop runoff is captured and used for toilet flushing.
- Scenario 3 (irrigation and toilet flushing): Both irrigation and toilet flushing demands are addressed using captured rooftop runoff.
The capacity to capture and use stormwater at the building scale is strongly dependent upon storage tank size. The optimum tank size is best determined through continuous simulation of stormwater model analyses for a given location. However, for simplicity, only two stormwater storage volumes were considered for each of the above scenarios, using continuous simulations for 4 or 5 years:
- 70 gallons (260 liters) per household, representing two rain barrels at 35 gallons each, and
- 2,200 gallons (8,300 liters) per household, representing a single larger tank (8 ft [2.4 cm] diameter and 6 ft [1.8 m] tall).
These tank volumes reflect commonly used household-scale, rooftop-runoff capture systems, although larger tanks are certainly possible and may offer additional benefits.
Given the number of factors that affect stormwater runoff and availability for beneficial use, assessments of stormwater availability are most effectively conducted using a continuous stormwater model. The committee performed its analyses using the continuous stormwater model WinSLAMM, using similar procedures as described by Pitt et al. (2011) to assess the potential contributions of stormwater to reduce conventional water supplies in six cities in different regions of the country. WinSLAMM3 (Pitt, 1997) was selected for these analyses because of the committee’s familiarity with the model and the similar analyses conducted previously by Pitt et al. (2011). Specifically, WinSLAMM was able to conduct continuous, long-term analyses considering different water uses, storage tank volumes, and rainfall records with minimal pre- and post-processing. The model calculated the amount of water available in the storage tanks and how much of the irrigation demand could be satisfied during a 5-year period (1995 through 1999 for all areas, except for Lincoln, where 1996 through 1999 rains were used). Details of the committee’s analysis are described in Appendix A. Other models, such as the U.S. Environmental Protection Agency’s (EPA’s) SWMM model4 or SUSTAIN model5 may be used to perform these analyses, but they do not incorporate the features needed for these analyses without modifications. However, for large-scale projects, it is always worthwhile to use complementary models having different approaches to obtain better insights and understandings of complex systems.
Beneficial Use Scenarios
As in the graywater analysis, the committee considered two beneficial uses of on-site nonpotable water—irrigation and toilet flushing. In addition to the factors described in Box 3-1, specific stormwater considerations are discussed below.
Irrigation. Three primary irrigation strategies are relevant to the use of stormwater for irrigation: conventional irrigation, conservation irrigation, and land application. Each strategy involves a different approach to the rate at which water is applied to landscaped areas. In conventional irrigation, a consistent, average amount of water is applied to plants on a fixed schedule, independent of water losses due to evapotranspiration or infiltration. Conservation irrigation strategies apply only the minimum amount of water needed to meet the vegetation demand, considering local deficits between evapotranspiration requirements and available rainfall. Finally, land application strategies are intended to maximize the use of stormwater for irrigation by applying water, when available, at the maximum rate that does not produce runoff while preventing damage to plants. Land application, therefore, provides substantial stormwater runoff reduction benefits, while providing potable water conservation benefits that are often similar (depending on climate) to other stormwater capture systems used only for irrigation. Irrigating to barely satisfy the evapotranspiration deficits (conservation irrigation) is typically recommended when minimizing water use and is the focus of the committee’s analysis, although many homeowners use much more water than recommended under conservation irrigation.
One of the primary considerations for determining conservation irrigation requirements involves comparing the time series of evapotranspiration and available rainfall for an area (as shown in Figure 3-2). The methodology for the analysis and calculations of irrigation demand are summarized in Box 3-1 and documented in more detail in Appendix A. Table 3-1-1 (Box 3-1) shows irrigation demands for conventional warm season turfgrass for residential areas by month for the six locations examined.
__________________
3 See http://winslamm.com. Robert Pitt, committee member, is one of the developers of WINSLAMM.
4 See http://www2.epa.gov/water-research/storm-water-management-model-swmm.
5 See http://www2.epa.gov/water-research/system-urban-stormwater-treatment-and-analysis-integration-sustain.
Toilet Flushing. At all locations examined in this scenario analysis for medium-density, residential land use, the available roof runoff on an average annual basis is greater than the toilet flushing water requirements (see Box 3-1 and Table 3-4). However, the ability to use this water is dependent on storage facilities (see Chapter 6), especially in arid areas where seasonal rainfalls result in greatly uneven amounts of runoff throughout the year. The committee analyzed the capacity for two rooftop capture systems to meet toilet flushing demand throughout the year at the six locations to bracket typical conditions. These scenario analyses were designed to examine the potential for stormwater capture at the household scale to address common nonpotable water demands (irrigation and toilet flushing) and to allow direct comparison with the graywater scenarios considered earlier. The committee recognizes that small-scale rooftop capture systems (e.g., rain barrels) are not typically used for toilet flushing, but the scenario could represent other year-round nonpotable uses. The larger storage tank option could enable more effective use of the roof runoff for toilet flushing, as well as other potential nonpotable uses not considered in this scenario.
Scenario Analysis Results
The calculated water savings associated with each of the beneficial use scenarios for the six locations are summarized in Tables 3-5 and 3-6. Table 3-7 shows the percentages of roof runoff used for these beneficial use options, of most interest to stormwater managers interested in runoff volume reductions. The use of irrigation plus toilet flushing in the central United States can use most (74 percent) of the roof runoff for beneficial uses when the larger tank volume is considered. The other locations use from about 31 to 62 percent of the total roof runoff for conservation irrigation plus toilet flushing when the large water storage tank option is used. Some of this roof runoff could therefore be made available for shallow groundwater recharge using rain gardens, but this infiltration was not considered in these analyses. The
TABLE 3-4 Calculated Annual Runoff Quantities (in gallons/year/acre) for Different Land Uses in Six Cities, 1995-1999
| Los Angeles, CA | Seattle, WA | Lincoln, NE | Madison, WI | Birmingham, AL | Newark, NJ | |
| Commercial | 320,000 | 730,000 | 490,000 | 560,000 | 940,000 | 820,000 |
| Industrial | 250,000 | 630,000 | 460,000 | 450,000 | 610,000 | 710,000 |
| Medium-density residential | 210,000 | 380,000 | 260,000 | 270,000 | 310,000 | 490,000 |
NOTE: Calculated using WinSLAMM (see Appendix A). Calculations are based on 100 percent of a single land use type. Lincoln data represents only 1996-1999. See Appendix A for methods used to derive these data.
TABLE 3-5 Calculated Run off Coefficients for Different Land Uses in Six Cities, 1995-1999
| Los Angeles, CA | Seattle, WA | Lincoln, NE | Madison, WI | Birmingham, AL | Newark, NJ | |
| Commercial | 0.70 | 0.65 | 0.65 | 0.70 | 0.64 | 0.69 |
| Industrial | 0.55 | 0.55 | 0.60 | 0.56 | 0.42 | 0.60 |
| Medium Density Residential | 0.46 | 0.34 | 0.35 | 0.34 | 0.21 | 0.42 |
NOTE: The runoff coefficient (Rv) values represents the fraction of the rainfall that is converted into runoff. Calculations are based on 100 percent of each land use type. Source area components for each land use type are determined by local data for each location. Roof runoff represents approximately 25 to 30 percent of the total residential area flows. Lincoln data represents only 1996-1999. See Appendix A for methods used to derive these data.
TABLE 3-6 Potential Potable Water Savings in Six Cities Based on a 100-Acre, Medium-Density, Residential Area Using Two 35-gallon Rain Barrels per Household
| Volume Potable Water Savings | Potable Water savings | ||||||
| Base use (Mgal/yr) | S1: Irrigation use only (Mgal/yr) | S2: Toilet flushing (Mgal/yr) | S3: Irrigation and toilet flushing (Mgal/yr) | S1: Irrigation use only (%) | S2: Toilet flushing (%) | S3: Irrigation and toilet flushing (%) | |
| Los Angeles, CA | 60.7 | 0.6 | 0.8 | 1.1 | 1.0 | 1.2 | 1.8 |
| Seattle, WA | 35.7 | 1.1 | 2.3 | 3.0 | 3.1 | 6.4 | 8.3 |
| Lincoln, NE | 35.8 | 1.8 | 1.5 | 2.3 | 5.0 | 4.2 | 6.3 |
| Madison, WI | 24.2 | 0.9 | 1.7 | 2.1 | 3.8 | 7.0 | 8.6 |
| Birmingham, AL | 24.3 | 0.6 | 1.6 | 1.8 | 2.6 | 6.4 | 7.3 |
| Newark, NJ | 24.7 | 0.9 | 2.1 | 2.5 | 3.5 | 8.6 | 10 |
use of two rain barrels per house only allows about 14 to 19 percent of the roof runoff to be used because of the limited storage provided.
The results are also presented in Figures 3-9 to 3-10 to illustrate the total amount of water demand per household, separated by indoor and outdoor uses. For the base condition and the irrigation or toilet flushing scenarios, the indoor and outdoor water uses can be shown separately. However, for the combined irrigation and toilet flushing use, the flows are withdrawn from the tank as a combined demand in the model, and separate data are not available.
Regional Differences in Potable Water Demand Reduction. Figures 3-9 and 3-10 show the domestic water use for all six cities examined in the committee’s scenario analyses. The least potable water savings are shown for Los Angeles, California, located in the arid Southwest. Even with the 2,200-gallon storage tank, water use is reduced by very small amounts (up to 5.4 percent), because of the poor alignment of periods of rainfall and irrigation demand and the normal, long, dry periods during the summer months that outlast the availability of stored roof runoff. Only 42 percent of the roof runoff water is captured with the larger tank in the modeled scenario, showing the impact of intense rainfalls that overfill the tank before it can be used. In areas with similar climate conditions, shallow groundwater recharge using on-site rain gardens and/or larger capture and reuse options (such as regional groundwater recharge projects) may be needed to achieve greater contributions to local water supplies and reductions in stormwater runoff, especially considering the very large variability of rainfall in the area. In the arid Southwest, outdoor irrigation demand is very high for typically used landscaping plants (because of the large evapotranspiration requirements and limited rainfall). Significant water conservation potential is possible through the use of native plants that do not rely on applied irrigation water. Compared to stormwater, graywater is a larger and more consistent source of water in the arid Southwest.
Seattle, Washington, located in the northwest, has a similar seasonal precipitation pattern as Los Angeles with irrigation demands concentrated in the summer when rainfall is lower (Figure 3-2). The longer-duration and less-intense rains and smaller evapotranspiration demands in Seattle allow for more efficient capture of roof runoff for beneficial uses. However, even with large storage tank use and both toilet flushing and conservation irrigation, the potential water demand reduction is only 15 percent (Table 3-6).
At Lincoln, Nebraska, located in the central United States, on average, precipitation occurs simultaneously with periods of irrigation demand (see Figure 3-2), which results in greater opportunities for capturing roof runoff for onsite irrigation. The potential potable water savings for these scenarios ranges from about 11 to 26 percent when using a 2,200-gallon tank, with 21 percent savings for irrigation only (the largest irrigation savings by volume and by percentage of the six sites; see Table 3-8).
The precipitation in Madison, Wisconsin, also matches irrigation demands reasonably well, with irrigation demand in only 4 months of the year, which limits potential water savings from conservation irrigation with captured stormwater (see Figure 3-2 and Table 3-1-1). With 2,200-gallon tanks, water use savings of up to 28 percent are possible. Because of the low irrigation demand in this area, toilet flushing with captured runoff offers greater potential potable water savings (18 percent) compared to irrigation alone (13 percent).
At Birmingham, Alabama, located in the Southeast, and at Newark, New Jersey, located on the East Coast, the irrigation requirements are relatively modest compared to the large amounts of rainfall in these areas (see Figure 3-2). The largest beneficial use potential for roof runoff in these locations is associated with toilet flushing (17 and 18 percent). The maximum potential potable water savings is about 24
TABLE 3-7 Potential Potable Water Savings in Six Cities Based on a 100-Acre, Medium-Density, Residential Area Using One 2,200-gallon Stormwater Tank per Household
| Volume Potable Water Savings | Potable Water Savings | ||||||
| Base use (Mgal/yr) | S1: Irrigation use only (Mgal/yr) | S2: Toilet flushing (Mgal/yr) | S3: Irrigation and toilet flushing (Mgal/yr) | S1: Irrigation use only (%) | S2: Toilet flushing (%) | S3: Irrigation and toilet flushing (%) | |
| Los Angeles, CA | 60.7 | 2.4 | 2.7 | 3.3 | 4.0 | 4.5 | 5.4 |
| Seattle, WA | 35.7 | 2.8 | 4.2 | 5.5 | 7.8 | 12 | 15 |
| Lincoln, NE | 35.8 | 7.6 | 3.9 | 9.2 | 21 | 11 | 26 |
| Madison, WI | 24.2 | 3.2 | 4.3 | 6.8 | 13 | 18 | 28 |
| Birmingham, AL | 24.3 | 2.4 | 4.3 | 5.8 | 9.7 | 18 | 24 |
| Newark, NJ | 24.7 | 3.2 | 4.2 | 6.9 | 13 | 17 | 28 |
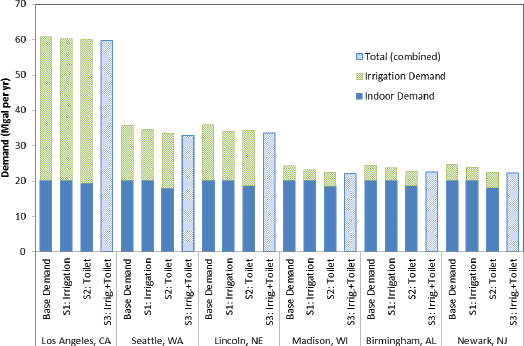
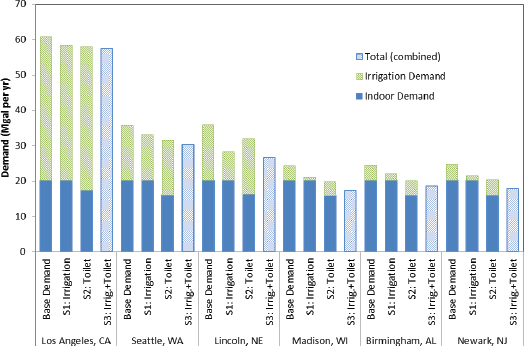
TABLE 3-8 Percentage Reduction in Roof Runoff in Six Cities Using Two Rain Barrels or One 2,200-gallon Stormwater Tank per Household
| Reduction in Roof Runoff Using Two 35-gallon Rain Barrels | Reduction in Roof Runoff Using a 2,200-gallon Stormwater Tank | |||||
| S1: Irrigation use only (%) | S2: Toilet flushing (%) | S3: Irrigation and toilet flushing (%) | S1: Irrigation use only (%) | S2: Toilet flushing (%) | S3: Irrigation and toilet flushing (%) | |
| Los Angeles, CA | 7.7 | 10 | 14 | 31 | 35 | 42 |
| Seattle, WA | 6.1 | 13 | 17 | 16 | 24 | 31 |
| Lincoln, NE | 14 | 12 | 18 | 61 | 31 | 74 |
| Madison, WI | 8.4 | 15 | 19 | 29 | 39 | 62 |
| Birmingham, AL | 5.7 | 14 | 16 | 21 | 38 | 52 |
| Newark, NJ | 4.9 | 12 | 14 | 18 | 24 | 39 |
NOTE: Based on analysis considering 100-acre, medium-density, residential area.
percent in Birmingham and 28 percent in Newark when using the larger storage tanks and with both toilet flushing and irrigation uses (only 10 and 13 percent, respectively, with irrigation alone).
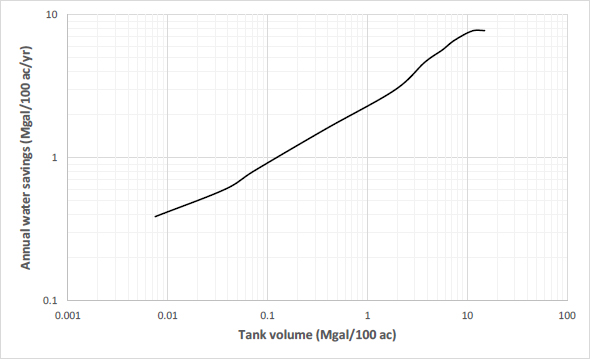
Tank Size. Larger water storage volumes result in more potable water savings, but the differences are related to the magnitude and timing of precipitation relative to the demand. Figure 3-11 shows the effects of increasing water storage tank sizes on the annual domestic water savings based on simulated capture of rooftop runoff in medium-density, residential areas in Los Angeles. In this case, all of the annual roof runoff was used for irrigation when the total storage tank volume for the area was about 11 Mgal (42,000 m3) of storage per 100 acres of medium-density, residential area (a very large storage volume corresponding to about 10 tanks of 8 ft diameter and 6 ft tall per house). The annual domestic water savings in this maximum situation is about 7.7 Mgal (29,000 m3) per 100 acres. For this maximum roof runoff storage amount, the corresponding total stormwater runoff reduction for this area is about 37 percent (the percentage of roof runoff to the runoff from the whole area). For this arid area, more reasonably sized water storage tanks result in much less of the roof runoff being available for on-site use.
Based on the scenario analysis for irrigation use only, the 2,200-gallon tanks can result in savings of 2.5 to 4.8 times more potable water than the use of two 35-gallon rain barrels, for the six regions examined, but the large water tanks are 32 times larger than the two rain barrels. Rain barrels saved the largest amount of potable water (5 percent) in Lincoln, Nebraska, which has a low but near-year-round irrigation demand, and the lowest amounts in Los Angeles (where the storage needs are huge) and Birmingham (where the runoff volumes are huge) (Table 3-6). Ultimately, the selection of tank size is dependent upon local climate conditions, stormwater runoff area relative to on-site water demands, site conditions, overall objectives, costs, and benefits (see Chapter 7). Many factors affect the interaction of storage volumes and domestic water savings (most notably demand vs. availability patterns and roof areas vs. landscaped areas), requiring continuous simulations for site-specific analyses, as was conducted for these analyses. The scenarios examined here show typical ranges of conditions and resulting expectations over a broad range of geographical conditions.
Runoff Reduction. Runoff reductions are a common goal of most stormwater management plans and options to use that runoff on site and prevent its discharge during rain events. This can be an important secondary benefit of beneficial use strategies. The results of these scenario analyses show that tank capture and beneficial use of roof runoff lead to maximum reductions (assuming use for irrigation and toilet flush-
ing) between 31 percent (Seattle) and 74 percent (Lincoln; see Table 3-7) of annual roof runoff in residential areas. Rain barrels result in significantly smaller maximum reductions in runoff, ranging from 14 percent (Los Angeles and Newark) to 18 percent (Lincoln); for irrigation only, rain barrels reduce runoff by 5 to 14 percent (Newark and Lincoln, respectively). Factors influencing the magnitude of runoff reduction include the timing of rainfall relative to irrigation and toilet flushing demand as well as the ratio of rooftop area to irrigated land in each area (which varies depending on local development patterns, see Table A-2 in Appendix A). Again, because of the nature of these analyses using multi-year modeling, some years will have greater benefits than these estimates, while other years will have smaller benefits.
Other Land Uses. Water savings from irrigation uses are typically much smaller in industrial and commercial areas compared to the above residential area examples because they have less irrigated landscape areas compared to roof areas. However, the large roof areas offer potential for other nonpotable uses, such as cooling water, toilet flushing, or industrial uses. In most regions of the country, high-density, residential and institutional areas result in the greatest water savings potentials from irrigation for similar storage tank sizes, although the water savings vary (greatest in the central and East Coast areas, and the least in the Southwest).
Water Savings Compared to Shallow Groundwater Infiltration. Rain gardens are popular on-site controls that have relatively low costs compared to other options and can significantly reduce the discharges of roof runoff from homes. The water infiltrating in a rain garden contributes to shallow groundwater recharge, which, depending on the local hydrogeology, may or may not eventually augment regional drinking water supplies. In analyses of rain gardens in Kansas City, Missouri, Pitt et al. (2014) reported that 10 Mgal/ yr per 100 acres (38,000 m3/yr per 40 ha) could be infiltrated with rain gardens in a community having about 600 homes per 100 acres and 39 inches of rain per year. Only a small fraction of the incoming water was lost through evapotranspiration in the rain garden (usually less than 10 percent) because of the large amount of water applied to relatively small areas. This total groundwater infiltration is about the same as the maximum potable water savings from the committee’s scenario analysis for Lincoln, Nebraska (9.2 Mgal/yr per 100 acres [35,000 m3/yr per 40 ha] for toilet flushing and irrigation uses; Table 3-6), although water supply savings would depend on whether groundwater supplies are under stress from excessive withdrawals and whether shallow groundwater infiltration projects ultimately recharge deeper aquifers used for water supply.
Stormwater Availability from Neighborhood-scale Projects
Neighborhood-scale stormwater capture for beneficial use commonly mixes stormwater flows originating from several areas located close together. The most common situation is collecting gutter flows in areas that are several acres to a few hundred acres in size. The captured stormwater is either stored in large subsurface tanks for nearby nonpotable use (e.g., irrigation, toilet flushing, washwater, aesthetic water features [see Chapter 2]) or used for aquifer recharge.
Overall, the potential water savings from neighborhood-scale stormwater capture is related to the available stormwater storage volume and the groundwater infiltration rate, source area, land development types, and correlation of water demand with rainfall. Several examples of neighborhood-scale projects are highlighted in Chapter 2. In the Sun Valley neighborhood of Los Angeles, a new neighborhood stormwater capture and infiltration project is expected to add 300 Mgal/yr (900 AF/yr or 1.1 million m3/yr) to the groundwater supply based on drainage from a 929-acre area (3.8 km2; Box 2-6). The new stormwater capture project for irrigation of the National Mall in Washington, DC, is anticipated to save 7.5 Mgal/yr (28,000 m3/yr; Box 2-5). Because neighborhood-scale stormwater capture projects are centrally managed, they offer the opportunity to reduce conventional water use over a larger area without necessitating investment and maintenance by individual homeowners, simplifying implementation and increasing the reach of stormwater capture programs.
The stormwater flows for neighborhood-scale projects are greater compared to just capturing roof runoff. Table 3-4 summarizes average annual runoff quantities from 1995 to 1999 for the most common three land uses (i.e., commercial, industrial, and medium-density residential) for six locations in the United States. Flow from a given mixed land use area would need to be calculated based on the percentages of various land use types (see Appendix A). For a simplified example, Los Angeles in the Southwest has total runoff ranging from 210,000 to 320,000 gallons/yr/acre (2,000 to 3,000 m3/yr/ha), depending on land use (Table 3-4). Even if sufficient storage is not available to capture some periods of very high flows, most of the annual runoff could be retained for beneficial uses at the neighborhood scale. These flows provide roughly four times the annual volumes needed to meet toilet flushing demand for a medium-density residential community6 (48,000 gallons/yr/acre or 450 m3/yr/ha), leaving substantial water available for other nonpotable uses. Yet, total
__________________
6 Assuming a population density of about 12 persons/acre and average toilet flushing water use of about 11 gallons/person/day.
capture of stormwater in the Los Angeles area could supply roughly only one-half of the outdoor irrigation requirements for medium-density, residential areas having turfgrass (410,000 gallons/yr/acre or 3,800 m3/yr/ha). For the Lincoln and Newark scenarios, the available flows shown in Table 3-4 provide more than enough water to meet medium-density, residential toilet flushing (48,000 gallons/yr/acre) and irrigation needs (150,000 gallons/yr/acre [1,400 m3/yr/ha or 450 m3/yr/ha] in Lincoln, Nebraska; 45,000 gallons/yr/acre [420 m3/yr/ha] for Newark, New Jersey; see Appendix A). All of the stormwater used for these beneficial uses would directly decrease demand on the normal public water supply system. However, this would require substantial investments in infrastructure (e.g., storage, treatment, and a dual-water distribution system to deliver the water to the buildings, plus substantial building modifications to accommodate a dual-water system). The design of such systems is discussed in Chapter 6, and the costs and benefits are broadly discussed in Chapter 7.
Stormwater Availability from Regional-Scale Projects
Regional-scale systems for the beneficial uses of stormwater collect runoff from many different land uses in relatively large areas. These may incorporate the complete community, ranging from several to many square miles in area. Given the large scale of these projects, the typical applications of the captured stormwater are aquifer recharge through large infiltration basins designed to recharge water supply aquifers or surface impoundments used to augment the conventional water supply. The amount of stormwater potentially available from regional-scale projects has been estimated for the entire Los Angeles basin as part of a stormwater conservation study (RMC, 2014). This study is intended to provide an understanding of the potential benefit of additional stormwater capture systems that could be implemented across the basin by the Los Angeles County Flood Control District and its partners. Considering centralized stormwater capture—such as spreading basins for managed replenishment/recharge of local groundwater basin in an engineered facility—the estimate for the next 20 years is 239,000 AF/yr (295 million m3/yr) increasing potentially to 494,000 AF/yr (609 million m3/yr) by 2095.
Calculations of stormwater availability at a regional scale could be similar to those in the prior section on neighborhood-scale. For the Los Angeles area, average annual runoff ranges from 210,000 to 320,000 gallons/yr/acre (2,000 to 3,000 m3/yr/ha), based on land use and data from 1995-1999 (Table 3-4). Assuming a population density of about 12 persons/acre and a total indoor water use of about 46 gallons/ person/day, the total water demand would be about 200,000 gallons/acre. Therefore, if entirely captured and stored for later use through a regional stormwater infiltration system, based on 1995-1999 data, then Los Angeles stormwater could supply all of the total annual domestic indoor water demand, although outdoor water requirements would not be met. Under wetter East Coast and Southeast conditions, stormwater at a regional scale could supply at least twice the water demand for indoor use, providing sufficient additional water for irrigation and other beneficial uses.
The runoff volumes shown in Table 3-4 are modeled runoff averages based on five years of data, and annual runoff would be expected to vary widely. In addition, extensive infrastructure would likely be needed to collect, store, treat, and deliver this water to the points of use (see Chapter 6). Not all of the water that is used for groundwater recharge is withdrawn, and non-recovered groundwater and seepage and evaporation losses would also need to be considered in the water supply evaluations using more complex regional groundwater modeling. Water rights laws may also restrict regional scale water capture unless water utilities can secure the water rights to stormwater that is recharged into a water supply aquifer (see Chapter 8).
Downstream Effects of Stormwater Use in Existing Developments
On-site beneficial uses of stormwater can raise water rights concerns for downstream users. Therefore, it is important that, when water rights present an issue (see Chapter 8), the impact of potential beneficial uses of stormwater on various components of the local water budget (Figure 3-3-1) and its effects on downstream water availability be understood in existing developments. For new developments, there will be increased runoff from the development compared to the undeveloped landscape that further complicate any evaluation of impacts to downstream water availability and would necessitate more detailed water budget analysis to determine the overall effects of on-site stormwater capture. When stormwater is used for toilet flushing, potable water use is reduced by the volume used for flushing, as is the amount of stormwater runoff from the property. Therefore, there is no net effect on regional hydrology in terms of downstream water availability because reduction in stormwater runoff is balanced by reduction in potable water demand (see Table 3-9), assuming that the water supply is from the same watershed. If potable water supply is provided by imported water, then widespread stormwater use for nonconsumptive applications could reduce the need for water imports. In such a case, downstream water availability in the basin with stormwater use could be reduced, although the basin from which the water is imported would see increased water flows.
TABLE 3-9 Summary of Water Budget Effects from the Beneficial Use of Stormwater at Existing Developments
| Water Quantity Effects | Water Quality Effects | ||||
| Potable water use | Wastewater volume generated | Off-site stormwater runoff | Water available to downstream water users | Stormwater contaminant loading | |
| Stormwater use for toilet flushing | Reduced | No change | Reduced | No change | Reduced |
| Stormwater use for irrigation of existing landscapea | Reduced | No change | Reduced | No change | Reduced |
| Stormwater use for irrigation of expanded landscape | May be slightly reduced, unchanged, or increased | No change | Reduced | Reduced | Reduced |
| Stormwater irrigation of existing landscape at increased rates | Reduced | No change | Reduced | Dependent on local hydrogeologic conditions | Reduced |
a Assumes irrigation rates throughout the year are the same before and after installation of the stormwater capture system.
If stormwater is captured for landscape irrigation in existing development, then potable water use is reduced by the volume of stormwater used for irrigation, assuming the amount of water applied to landscaping is not increased after installation of the stormwater capture system. Use of stormwater for irrigation results in the same water losses to the hydrologic cycle from consumptive use because of evapotranspiration and recharge to groundwater, as would have been the case for potable water applied to existing landscaping that the stormwater replaced. The amount of stormwater runoff from the property is reduced by the amount used for irrigation, which can result in decreased flows to local receiving water bodies or to a regional stormwater collection system by the amount used for irrigation. However, there is no net effect on regional hydrology in terms of water availability within a watershed because reduction in stormwater runoff is balanced by reduction in potable water demand, again if the domestic water is not imported.
If the use of stormwater for irrigation results in a greater demand for irrigation water use on a property (such as from additional plantings), then this could result in little or no reduction in potable water use (i.e., potable water continues to be used for irrigation but is supplemented by stormwater). With an expanded area of irrigated landscape, there would be increased evapotranspiration losses compared to the base case, resulting in reduced flows to downstream users. If the area of irrigated landscape is unchanged but the irrigation rate increases, then the downstream impacts are less clear. There could be increased evapotranspiration losses but groundwater recharge would likely also increase, and these gains and losses to downstream users would need to be compared to the base conditions of evapotranspiration and groundwater recharge in the environment.
CONCLUSIONS
The following conclusions are based on the committee’s scenario analyses of graywater and stormwater uses for conservation irrigation of turfgrass, toilet flushing, or both, as well as other assessments of potable water savings in the literature. The committee’s analyses primarily focused on on-site capture and use of graywater or stormwater at the medium-density, residential scale, using 1994-1999 precipitation data. However, the potential for neighborhood and regional stormwater capture was also considered. These analyses were not intended as a definitive assessment of potential potable water savings and should not be considered as such, given the assumptions of the analysis and the inherent uncertainties (see Box 3-2). However, broad lessons can be learned from a comparative analysis of the results.
Water savings associated with beneficial use of stormwater are dependent on tank size and the amount and timing of precipitation relative to water demand. Substantial, potential, household-scale water savings (24 to 28 percent) from the capture and use of roof runoff were calculated for scenario analyses in four of the six cities analyzed using one moderately sized (2,200-gallon) storage tank per house. These cities—Lincoln, Nebraska; Madison, Wisconsin; Birmingham, Alabama; and Newark, New Jersey (all located in the Midwest or East Coast)—have year-round rainfall closely matching irrigation demands. In contrast, the scenario analysis showed lower potential potable water savings for Los Angeles and Seattle (5 and 15 percent, respectively). In much of the arid West, the timing and intensity of rainfall limits the capacity of stormwater collection to reduce potable water use at the household scale. Very small stormwater water storage volumes provide much lower water savings benefits (less than 2 percent in Los Angeles to up to 10 percent in Newark using two 35-gallon rain barrels per house, for example).
Neighborhood- and regional-scale stormwater capture projects can contribute significantly to urban water supplies. This is especially important for arid climates in which stormwater can be stored in aquifers for use during drought or the dry season. The committee’s scenario analyses showed that average 1995-1999 stormwater runoff for medium-density, residential developments in Los Angeles would be roughly sufficient to meet indoor, residential, water needs in those areas. However, extensive infrastructure for large-scale collection, treatment, and storage or infiltration would likely be needed.
Graywater reuse offers the potential for substantial potable water savings and could provide a reliable source of water for arid regions. Based on the committee’s scenario analyses, graywater reuse provides greater potable water savings than does stormwater capture (based on a 2,200-gallon tank per house) in Los Angeles and Seattle, because graywater provides a steady water source during summer months with little or no rainfall. Additionally, the analyses showed that graywater can more effectively meet toilet flushing demand compared to stormwater in all cities analyzed. Graywater use for toilet flushing has been demonstrated to achieve potable water savings as theoretically expected, but water savings associated with graywater irrigation at the household scale have not been demonstrated with confidence. Little is known about the impact of installing onsite nonpotable water systems on human water use behavior, which points to the need to study behavioral responses to conservation measures.
Beneficial use of graywater is more appropriate for residential and multi-residential applications than for commercial application. Most commercial facilities do not generate enough graywater to justify use for toilet flushing or irrigation. Even offices that have showers on site are not likely to generate enough graywater to meet end use demands (toilet or irrigation). Some commercial applications for which graywater use may be appropriate include fitness facilities, hotels, and laundromats.
If water conservation is the primary driver for stormwater and graywater investments, then strategies that reduce outdoor water use should first be examined. In arid regions, potential potable water savings for residential and multi-residential use of stormwater and/or graywater are significant, but small relative to today’s outdoor water demand. Although use of graywater or roof runoff for toilet flushing can reduce indoor demand by up to 24 percent, the potential annual reduction in domestic water demand for the Los Angeles area estimated in the committee’s scenario analyses averaged only 13 percent for graywater reuse (and significantly less for stormwater capture, even using large tanks). These limited reductions in total demand result from the very high irrigation demand in arid regions. Irrigation demand accounted for 67 percent of the total demand in Los Angeles in the hypothetical scenarios examined here. Thus, the largest reductions in water demand in arid regions would be provided by approaches to reduce or eliminate irrigation demand, such as lawn-removal rebate programs and the use of xeriscaping and other types of climate-appropriate, low-water-use landscapes. In these circumstances, graywater could be used to supply irrigation water to meet specific small irrigation needs. Otherwise, graywater and stormwater may help facilitate the continued use of landscaping that is not sustainable in the long term and inappropriate for local climate conditions.
On-site use of nonpotable water for toilet flushing is a proven way to achieve potable water savings that does not impact the water availability to downstream users. Reductions in flows to sanitary sewers and stormwater runoff are balanced by reductions in potable water demand, assuming these flows occur in the same watershed. Water savings and effects on regional water availability from irrigation with graywater or stormwater in existing developments depend on whether irrigation rates or the area of irrigated landscape increases compared to the base case. If irrigation rates and landscaped areas are not increased, then potable water savings would occur that do not impact water availability to downstream users. If the irrigated landscape is expanded (or the supplemental irrigation water rate increased), then potable savings may be reduced and additional consumptive losses would occur from evapotranspiration, potentially impacting downstream users.


