
For a variety of socioeconomic, demographic, technological, and environmental reasons, an increasing number of urban travelers are turning to shared mobility services to reach their desired destinations. Shared mobility services—including carsharing, bikesharing, transportation network companies (TNCs), and microtransit, as well as traditional shared services such as taxis and limousines—have been increasing rapidly in recent years in terms of both number of companies and number of trips provided. As technologies and systems are more widely deployed and become more reliable and convenient, these modes may continue to increase their modal share and possibly reduce single-occupancy motor vehicle trips. Although in the context of all travel by motor vehicle, these services provide relatively few trips, they often are essential means of travel for certain types of trips and circumstances, with particular importance for disadvantaged populations. Many of the emerging companies may fail or merge within a few years, but if the rapid growth of private innovation in transportation markets continues, it could have fundamental long-term effects on travel behavior, with significant associated mobility, economic, and environmental consequences.
This chapter provides context for the rest of the report, beginning with an overview of how technology is affecting all types of transportation. It then describes the new mobility services that rely on innovations in information and communication and other new technologies and what is known about the current use of shared mobility services. Finally, the chapter addresses the potential impacts of these new services on vehicle ownership and the environment.
Effects of Technology on Transportation
Rapid changes now under way in transportation are due in part to the opportunities afforded to firms and individuals by new information and communication technologies. The rapid evolution of wireless communications, high-speed computing, enhanced sensors, and global positioning systems (GPS), among many other technologies, is helping to optimize logistics and freight delivery, facilitate planning for personal vehicle and public transportation trips, and simplify payments for tolls and transit fees. The new technologies, combined with new business and service models, are key elements of the next generation of transportation infrastructure and services. The sharing economy and on-demand business model are enabling a more nimble and cost-effective set of options for moving people and goods that require modest amounts of new infrastructure or capital spending. These changes in transportation also are opening up new industries and employment options, although not without negatively affecting some established interests, and potentially end users, in the process.
Many technological innovations are affecting transportation and enabling shared mobility. In some cases, these innovations make using established modes easier, quicker, more reliable, and more predictable, attracting new customers and encouraging new types of trips by reducing uncertainty and increasing the convenience and efficiency of system use. Technological innovations also have enabled the coordination of services within larger networks and allowed system managers to optimize the use of employees and vehicles.
With the advent of open-source transit data, riders can easily know the details of transit service in real time, thereby avoiding the frequently voiced frustration of not knowing when the next transit vehicle will arrive (Brakewood et al. 2015; Ferris et al. 2010; Multisystems, Inc. 2002). Public transit also has benefited in recent years from new payment options that reduce the burden of fare collection while giving riders more choices. Traffic and GPS data can be combined in navigation systems and apps, making it easier for drivers to reroute around congestion and travel through places
with which they are unfamiliar. The challenges of parking in urban areas are evolving as well with access to real-time data on parking availability; variable pricing to manage demand; and options to pay by cell phone, credit card, or online account. Collectively, highly accurate GPS data, online and application-based payment systems, remote locking and unlocking capabilities, and the ability to manage extremely large and dynamic data sets are enabling real-time rideshare matching, convenient shared-use and ownership opportunities, and bundling of multimodal travel options into packages analogous to health care or cable services. Both travelers and transportation providers can reduce costs through the new technologies. Real-time dynamic data make it possible for fleet owners and service brokers to optimize the number of vehicles needed to serve their customers, while the same data allow travelers to reduce their wait times and consider alternatives that were previously unknown or too uncertain. With more transportation options and better real-time information about them, travel by means other than personally owned vehicles is becoming a much more viable option in urban settings.
The Millennial generation that grew up with computers and mobile phones is at the forefront of the many changes described above. In the last 2 years, much has been made of the slower rate at which teens and young adults have been securing driver’s licenses and the declining number of vehicle miles they have been driving, although many questions remain about the causes of these declines and whether they represent a long-lasting trend (Blumenberg et al. 2013; Fulton 2014; Polzin et al. 2014; Schoettle and Sivak 2014). For now, it appears that many young adults depend on technology-enabled connections as much as, if not more than, those provided by personal vehicles.
There are many possible ways to categorize the existing set of innovative mobility services, even as newly developing options continually blur the lines demarcating one from another. The descriptions that follow, summarized in Table 2-1, provide brief overviews of the
Table 2-1 Selected Taxonomy of Innovative Mobility Services
| Service | Role of Technology | Problems Technology May Solve | Factors in Success |
| Carsharing (examples: Zipcar, car2go) | Reservations and tracking of vehicles; billing | Convenience in making and changing reservations and in locating and dropping off vehicles; national branding encourages use while traveling | Critical mass of users to support availability of vehicles at a sufficient array of pickup or drop-off locations |
| Bikesharing (examples: Citi Bike, Divvy, Capital Bikeshare) | Reservations and tracking of bikes; billing | Convenience in finding bikeshare stations and information on bike availability; management of rebalancing | Critical mass of users to support a sufficient array of bike stations; rebalancing of bikes to ensure availability |
| Transportation network companies—sequential sharing (examples: Uber, Lyft) | Reservations and tracking of vehicles; billing; quality control via online customer feedback | Convenience of arranging ride just prior to travel; customer tracking of vehicles and wait times reduces uncertainty; national branding encourages use while traveling | Critical mass of users to support widespread vehicle availability |
| Transportation network companies—concurrent sharing (examples: UberPool, LyftLine) | Reservations and tracking of vehicles; billing; matching of riders for shared rides; quality control via online customer feedback | Convenience of arranging ride just prior to travel; customer tracking of vehicles and wait times reduces uncertainty; national branding encourages use while traveling | Critical mass of users to support widespread vehicle availability; comfort with riding with strangers; critical mass to match riders for shared rides |
| Microtransit (examples: Bridj, Chariot) | Reservations and tracking of vehicles; determining routes from public demand; billing | On-board wi-fi and efficient routing to match customer demand; customer tracking of vehicles and wait times reduces uncertainty | Critical mass of users to support a variety of routes; comfort with riding with strangers; price points that, while higher than those of standard transit, allow for regular commuting |
| Taxi apps or e-hail (examples: Flywheel, Curb, myTaxi) | Easier reservations, both advance and just prior to travel | Apps may cover multiple taxi companies and estimate wait time, reducing uncertainty; national branding could encourage use while traveling | Critical mass of participating taxi companies; integration with traditional taxi operations; app use by traditional customer base |
services that are the focus of this report; much more information about these and other services is available in Appendix A.
In general, carsharing is the short-term provision of vehicles to individuals who drive themselves and return the vehicles to set locations. It differs from traditional car rental in that most carsharing rentals are for minutes or hours instead of days or weeks, although there are some variations. By providing members with access to vehicles on demand, carsharing organizations can reduce the need for personal vehicle ownership. The most common variations include round-trip carsharing, whereby the vehicle is returned to a “home” parking space at the end of each trip, and one-way carsharing, whereby the vehicle can be parked anywhere within a relatively large service area. A newer variation is peer-to-peer carsharing, in which individuals make their vehicles available for rent in a shared fleet that is managed by a third party.
Carsharing first appeared in Europe in the 1940s but did not become popular until the 1990s, also primarily in Europe. Carsharing developed later in North America, but it is now the largest carsharing region in the world as measured by membership (Shaheen et al. 2015). There were 45 carsharing operators in the Americas in January 2015—including for-profit, nonprofit, and cooperative business models—with approximately 1.5 million members and 22,134 vehicles (Shaheen and Cohen 2015). As of early 2015, Zipcar and car2go were the largest carsharing companies in the world (PR Newswire 2014). The public sector’s role in carsharing is typically limited to encouraging its deployment and leasing street-level or other convenient parking to facilitate its use.
Bikesharing, like carsharing, entails members paying daily, weekly, or annual fees for access to a fleet of bicycles for their use. Members can pick up bikes from any station and return them to that station or any other. Bikesharing, like carsharing, originated in Europe in the 1960s. After some notable failures, it gained new life in 2007 with the implementation of Paris’s Vélib program, which provided more than 19,000 bikes at 1,230 stations. Since then, bikesharing has grown rapidly in Europe, and it eventually spread to North America and the rest of the world. Today, the Chinese cities of Wuhan and Hangzhou are home to the world’s largest bikesharing operations, with more
than 50,000 bikes each (Guilford 2014). As of May 2015, 880 cities and communities worldwide had some sort of a technology-enabled bikesharing system, providing 1 million bikes; 80 percent of bikesharing bikes were located in China. In the United States alone, 72 cities provided approximately 24,700 bikes and 2,440 stations (Shaheen 2015).
A number of public bikesharing business models have evolved in the United States. They include (1) nonprofit, (2) privately owned and operated, (3) publicly owned and operated, (4) publicly owned and contractor operated, and (5) vendor operated. These models can overlap as a result of variations in ownership, system administration, and operations (Shaheen et al. 2014). One notable exception is New York City, in which the program is publicly owned but does not take public subsidies outside of infrastructure and staff support. New York and other cities also facilitate bikesharing by providing public space for stations and bike parking.
Transportation network companies (TNCs) are on-demand ride services that have seen considerable growth in recent years. While some have termed the function of these firms “ridesourcing” or “ride hailing,” they are increasingly known simply as TNCs. Rides are arranged through mobile apps that connect a traveler with a driver operating his or her personal vehicle. Drivers may be either licensed vehicle-for-hire drivers or private individuals without a commercial license. Fares are based on both distance and time and paid from the traveler’s credit or debit card account, which is registered with the TNC. Fares are charged automatically at the end of the trip; the driver does not engage the passenger regarding payment. As of 2015, the two largest TNCs were Uber and Lyft, with Uber being by far the largest. Data on the size of these companies are difficult to obtain, but as of June 2015, Uber alone was reported to provide more than 1 million rides daily worldwide (Geier 2015). In the United States in June 2015, Lyft operated in 60 cities with more than 100,000 drivers, and Uber operated in 311 cities with more than 162,000 drivers (Shaheen 2015). Together, these figures represent approximately 80 percent of the number of taxi and limousine drivers, but Uber and other TNC drivers work mainly
part-time, sometimes only a few hours a week. Additional rides and drivers are certainly being offered through other TNCs, but Uber’s data were the only relatively detailed numbers publicly available at the time this report was being written. The public sector’s role in TNCs has been evolving rapidly as these companies have proliferated. As described in Chapter 3, TNCs are being regulated, but much more lightly than traditional taxi and other for-hire transportation services.
Microtransit encompasses flexible private transit services that use small buses (relative to traditional transit vehicles) and develop routes based on customer input and demand. Companies in this category include Bridj, Loup, and Chariot. Data on these services, including number of vehicles, routes, or riders, are not yet available. Microtransit services are aimed at those who could otherwise use the traditional public transit system but are willing to trade off a higher fare for a more convenient trip. Microtransit companies are private and unsubsidized. The degree to which they are integrated with existing transit services appears to be fairly minimal.
Some of the services described above are effectively peer-to-peer; TNCs, for example, typically rely on drivers using their own vehicles. Others, including microtransit, many taxi operations, bikesharing, and carsharing, have a centralized fleet. Bikesharing, UberX, and Lyft provide exclusive rides, while other services, including microtransit and the shared-ride TNC services (UberPool and LyftLine) provide shared rides. (Carsharing does not fit neatly into either exclusive or shared rides, but instead can consist of an individual driver or a group of individuals traveling in a vehicle that is shared among nonowner individuals.)
Current Use of Shared Mobility Services
The eventual role of shared mobility services remains to be determined as these new business models are deployed more fully and mature in the marketplace. Their role may be as an adjunct to or partial replacement for traditional taxi, limousine, and transit services, or they may be part of a more profound transformation of urban
mobility options if enough travelers find their performance characteristics sufficiently attractive to meaningfully alter travel preferences. For example, anecdotal data suggest that some travelers are substituting TNC services for biking, walking, and transit and personal vehicle travel, as well as for traditional taxi or limousine services. Others have speculated that broadly available and affordable TNC services could affect vehicle ownership decisions and more substantially alter household travel behavior. While acknowledging those prospects, it is nonetheless important to add perspective by understanding current travel behavior as it relates to shared mobility services.
Carpooling
Conventional carpooling as a mode of commuting has declined substantially over the last few decades, from nearly 20 percent in 1980 to less than 10 percent today (AASHTO 2013). There are many reasons for the decline: metro areas have more spatially dispersed job centers than in the past; work schedules are more flexible, and teleworking is increasing; and driving alone is a relatively inexpensive and convenient option, particularly when commuters need not pay for parking. (It is also important to note that commute trips make up a minority of total travel: only about 16 percent of total trips and 28 percent of vehicle miles traveled [VMT] are for work travel [AASHTO 2013].) In general, moreover, the trends in carpool commuting illustrate the popularity of single-occupant, personal-vehicle trip making, which accounts for three-quarters of work trips, a share that has been steady since 2010. About 87 percent of daily trips occur in personal automobiles (U.S. BTS 2015a).
Taxis
Information about the scale and share of trips using conventional taxi and limousine services provides important context. Taxis and limousines represent the only private shared-used mode that is established enough for significant publicly available data on their use to be available.
In 2012, there were 7,500 establishments with employees providing taxi and limousine service in the United States, with revenues of nearly $6.6 billion and roughly 76,000 employees (see Appendix B). Taxi and limousine businesses without employees (most taxi drivers are independent contractors) account for an additional $7.5 billion in revenue, for an overall industry revenue of $14.1 billion. The U.S. census recorded more than 300,000 taxi and limousine drivers in 2006–2010, providing about 890 million trips annually. The taxi and limousine industry has grown substantially since 2000, with revenue increasing by 42 percent, the number of operators by 54 percent, and the number of drivers by 32 percent (Appendix B). (Trend data on passenger miles traveled by taxi is not available.)
In the context of the overall ground transportation system in the United States, however, taxis and limousines account for a small proportion of trips. Taxi and limousine services represent 0.30 percent of person trips, 0.20 percent of household VMT, and 0.16 percent of person miles traveled in the United States. These figures are higher in larger metropolitan areas and lower in smaller metro and nonmetropolitan areas. Taxi and limousine trips account for 0.39 percent of all trips in metro areas with populations of 1 million or more, compared with less than 0.1 percent in metro areas with populations of less than 500,000 (Appendix B).
Taxi use constitutes just 0.19 percent of all person trips, but these trips total about 738,000,000 annually.1 Using another metric, there are an estimated 164,000 usual taxi commuters in the United States, representing 0.11 percent of all commuter trips.2 Whether considered relative to all travel or only travel to work, taxis are a modestly used travel mode in terms of all person trips nationally. Given that taxi trips are generally shorter than the trips made by other travel modes, moreover, taxis almost certainly constitute an even smaller
______________
1 Data on taxi use are generated from the 2009 National Household Travel Survey (NHTS), arguably the most comprehensive and reliable source of national data on taxi use.
2 Data on commuting are gathered in the American Community Survey (ACS). This annual survey, conducted by the Census Bureau continuously throughout the calendar year, queries respondents about their usual means of commuting to work in the prior week. Taxi is one response category that respondents can choose.
share of person miles of travel.3,4 Nonetheless, taxis are an important component of the overall transportation system. They may be the only option available to fill transportation needs, particularly for those without a personal vehicle, and can provide out-of-town travelers with flexible door-to-door service.
Public Transit
The scale and organization of public transportation generally are much better understood than is the case for the taxi industry, and therefore are described in less detail here. Notably, transit use, in passenger miles, has increased by 25 percent since 2000 (U.S. BTS 2015b), and transit trips have increased by 16 percent (National Transit Data Publications 2009 and 2011).5 Transit, like taxis, is critical to the functioning of major urban areas, particularly for work trips. Transit’s share of commuting in metropolitan areas with greater than 5 million population is almost 13 percent, and its share of work trips in metropolitan areas with populations between 2.5 and 5 million is almost 6 percent (U.S. BTS 2015b, p. 28). Even so, its share of total national person miles is modest—roughly 1.5 percent—and its share of total person trips is about 2 percent. For some people, transit (as with taxis) may be their only option for some or most of their travel. In particular, public transit systems provide services to people with disabilities, who often use on-demand, door-to-door service.
______________
3 NHTS data.
4 For example, the ability to take a taxi to the airport leaves a household vehicle home for other family members to use and avoids the time and cost of airport parking, providing an attractive ground access option for travelers. Similarly, a transit commuter can use taxi services during the workday to reach a business meeting or lunch appointment, thereby making it easier to commute by means other than driving, including public transit. Taxi service is particularly important in large metro areas and enables their critically important urban cores to function (Rode and Floater 2014; Rodrigue 2013). In addition, as revealed in the data, taxis are a critical lifeline for many individuals without access to personal vehicles who make trips, including medical trips, not well served by fixed-route public transit. Taxi services also frequently are relied upon by social service agencies as a mobility option for transporting their clients, often through the use of vouchers, as described in greater detail in Chapter 8.
5 See National Transit Summary and Trends reports for 2009 and 2011 for unlinked passenger trips trend data (http://www.ntdprogram.gov/ntdprogram/pubs.htm#dt).
Car- and Bikesharing
Some forms of shared mobility are more robustly understood than others. There are notable bodies of research on the scale and use of car- and bikesharing, while other forms, such as TNCs, microtransit, and employer shuttles, are less well understood. The section below on impacts provides results of research on car- and bikesharing in selected urban areas, including estimates of their impacts on single-occupant vehicle travel, vehicle ownership, and use of other modes.
Transportation Network Companies
The growth of TNCs has been rapid, even meteoric, but surprisingly little is known about the scale and performance of these private firms, which are subject to limited public regulation. Among TNCs, Uber and Lyft have emerged as the largest to date, as described in Chapter 3 in greater detail. As of March 2015, the number of Uber vehicles in New York had overtaken the number of medallion cabs (Licea et al. 2015); the company had been in operation for 4 years at that point. The number of TNC vehicles overall had overtaken the number of cabs prior to March 2015, as other companies, including Lyft, also operate in the city. However, the New York Taxi and Limousine Commission reported that yellow cabs still make 10 times the number of trips made by Uber cars (Licea et al. 2015), reflecting the part-time nature of much TNC car use. By mid-2015, Uber reportedly had 2 million customers in the New York City area (Badger 2015).
As of January 2015, the taxi market in San Francisco was about $140 million per year, while Uber’s gross revenues in that city in 2014 were reportedly approximately $500 million and growing at a rate of 200 percent per year (Blodget 2015). Uber’s CEO reported that trips in San Francisco were increasing three-fold year by year and that trips in New York were increasing four-fold (Blodget 2015). Some of this growth may be attributable to service quality: Rayle and colleagues (2015) found that in San Francisco, 90 percent of TNC rides occurred within 10 minutes of the request at all times of day, compared with only 35 percent of taxi rides during the day and 16 percent at night and on weekends.
The Rayle et al. (2015) study of 380 TNC users in San Francisco found that they were generally younger and more highly educated than city residents as a whole (84 percent of riders had a bachelor’s degree or higher as compared with 52 percent of city residents [U.S. Census 2014]). UberX provided the majority of trips (53 percent), while other Uber services (UberBlack, UberSUV) represented another 8 percent. Lyft provided 30 percent of trips, and other services the remainder. The survey conducted for the study also asked respondents for key trip data, including trip purpose, origin–destination, and wait time. Responses revealed that 67 percent of all trips were social or leisure trips (bar, restaurant, concert, visit friends or family), and only 16 percent were work related. Forty-seven percent of trips began somewhere other than home or work (e.g., restaurant, bar, gym), while 40 percent originated at home. Thirty-nine percent of respondents said that if TNCs had not been available, they would have taken a taxi, while 24 percent would have traveled by bus. Four percent cited a public transit station as their origin or destination, suggesting that TNCs occasionally provide first- or last-mile service to and from public transit. Forty percent of TNC users reported that they had reduced their driving because of the service. TNC trips within San Francisco averaged 3.1 miles in length, whereas taxi trips averaged 3.7 miles. This study was exploratory in nature and did not include “ridesplitting” services, such as Lyft Line and UberPool.
This study also did not examine e-hail taxi services, as they were not widely deployed at the time of the survey. Since then, there has been a dramatic increase in use of e-hail taxi services. As of October 2014, for example, 80 percent of San Francisco taxis (1,450 taxis) were reportedly using the e-hail app Flywheel, which has brought taxi wait times closely in line with those of ridesourcing (Sachin Kansal, unpublished data).
Business travelers appear to be using TNCs in particularly large numbers. Concur, a travel expense management company, reported a ninefold increase in client use of Uber between 2013 and 2014 (White 2015). The travel expense management company Certify reported that among business travelers, use of Uber (55 percent) surpassed that of taxis (43 percent) in the second quarter of 2015, a near reversal of
the shares observed (Uber 43 percent, taxis 53 percent) in the first quarter of that year (Certify 2015). Lyft accounted for only 1 percent of business trips in the second quarter of 2015, but its market share grew by 153 percent between the first and second quarters of the year (Certify 2015). Average fares may be the reason that TNCs are gaining market share: Certify results show average fares for Lyft to be $22.51, for Uber $30.03, and for taxis $34.48 (Certify 2015).6
The rapid expansion of TNCs, as partially described in Box 2-1, has also led to changing beliefs about the total potential size of the market for shared rides. The global taxi and car service market saw relatively minor changes for decades, although it has grown substantially in recent years. The changes that TNCs have brought to the car-for-hire market appear to have accelerated this growth, although it is as yet difficult to know how many rides may merely shift from single vehicles, taxis, or transit to TNCs. Given the rapid growth in TNC drivers and revenues, some of the rides are apparently new to for-hire transportation, resulting in an increased overall market size for TNCs and potentially shrinking the share of other modes, from private vehicle to transit.
While Millennials living in urban areas are the predominant users of TNCs, what happens in the years ahead will depend on such factors as how life-cycle and cohort effects begin to shape TNC use. For example, it is not known whether Millennials who are faithful TNC users will continue to use and demand TNCs if they move to lower-density suburbs when they have children. Also unknown is whether new and older urban residents such as retirees, the cohort with the least use of TNCs, will increase their TNC use when settling into urban areas.
Summary of Current Use
The preceding sections draw on fragmentary and disparate data sources in an attempt to place the scale and growth of TNCs and
______________
6 These data, derived from business trip expense reports compiled by Certify, enable direct comparison of TNC and taxi fares in the same cities for the types and lengths of trips taken by business travelers (e.g., between airports and hotels and between hotels and meeting places).
BOX 2-1
Frequency of Use of Ridesharing Applications: Results from a National Tracking Poll of Registered Voters
A national tracking poll conducted online by Morning Consult, June 29–30, 2015, asked a national sample of 2,173 registered voters, “How often do you use ridesharing applications on your smartphone such as Uber or Lyft?” About 3 percent of registered voters reported almost daily use of ridesharing applications, about 5 percent reported using them once or twice per week or once or twice per month, and 72 percent said they had never used them.
As shown in the figure below, frequency of use varies with age. About 10 percent of respondents 18 to 44 years of age reported using ridesharing applications once or twice per week or month, and about 6 percent reported using them almost daily. Fewer than 1 percent of those
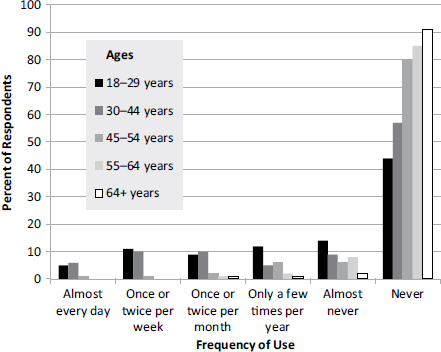
Figure 2-1 Frequency of ridesharing.
Source: Morning Consult 2015.
older than 45 reported using ridesharing applications as much as once or twice per week or month. About 50 percent of respondents 18 to 44 years of age said they never had used ridesharing applications, compared with about 85 percent of those older than 45. Only 1 percent of student registered voters said they used ridesharing applications almost every day, but 7 percent used them once or twice per week or month.
About 11 percent of Hispanics reported using ridesharing applications once or twice per week or month, compared with 4 percent of whites and 7 percent of African Americans. Six percent of Hispanics said they used the applications almost every day, compared with 3 percent of African Americans and 2 percent of whites. Seventy-five percent of white respondents but only 51 percent of Hispanics and 59 percent of African Americans reported never having used ridesharing applications.
A greater percentage of those living in urban areas (about 8 percent) than of those living in suburban (4 percent) or rural (3 percent) areas reported frequent use of ridesharing applications. Seventy-nine percent of those living in rural areas and 75 percent of those living in suburban areas reported never using ridesharing applications, compared with 59 percent of urban residents. Four percent of residents polled from the South and Midwest said they used ridesharing applications once or twice per week or month, compared with about 6 percent from the West and Northeast. Fewer respondents from the Midwest reported almost daily use (1 percent) compared with those from the South and West (3 percent) and Northeast (4 percent).
Females and males reported comparable levels of use: about 2 percent of females and 3 percent of males said they used ridesharing applications almost daily; about 4 percent of females and 6 percent of males said they used them once or twice per week or month; and 74 percent of females and 69 percent of males said they had never used them. About 8 percent of those polled with a bachelor’s or postgraduate degree reported using ridesharing services once or twice per week or month, compared with 4 percent who had less than a bachelor’s degree. Three percent of respondents earning up to $50,000 annually said they used the applications once or twice per week or month, compared with 6 percent of those with annual incomes over $50,000. The percentage reporting almost daily use ranged from 2 to 3 percent across all income categories.
The same poll asked registered voters, “How often do you use traditional taxi services?” Three percent of the registered voters polled said they used taxi services almost every day, and about 5 percent said they used them once or twice per week or month—the same percentages as for ridesharing applications. About 10 percent of respondents 18 to 44 years of age (and 9 percent 18 to 29 years of age) said they used taxis once or twice per week or month—the same as for ridesharing applications. About 5 percent of those who were 19 to 44 years old reported using taxis almost every day—again, similar to ridesharing (6 percent). Thirty-five percent of 18- to 44-year-olds reported never using taxis (versus 50 percent who had never used ridesharing applications). Fifty percent of those older than 45 said they never used taxis, compared with 85 percent who had never used ridesharing applications. Four percent of student registered voters said they used taxi services almost every day (versus 1 percent who reported almost daily use of ridesharing applications). Five percent of students said they used taxi services once or twice per week or month, compared with 7 percent who used ridesharing applications that often.
Four percent of respondents earning up to $50,000 annually said they used taxis once or twice per week or month (compared with 3 percent for ridesharing). Among those with annual incomes greater than $50,000, about 6 percent said they used taxi services once or twice per week or month—the same percentage that reported this frequency of use for ridesharing. Almost daily use of taxis ranged from 2 to 3 percent across the reported income levels—the same as for ridesharing.
Nine percent of urban respondents said they used taxis once or twice per week or month, and a similar 8 percent said they used ridesharing applications that often. Five percent of urban residents reported using taxis almost daily—the same percentage that reported almost daily use of ridesharing applications.
other urban mobility services in context. In the broadest context, the private automobile remains the dominant mode of travel nationwide, accounting for 87 percent of daily trips. Carpooling, a conventional form of shared-use travel, has been declining steadily for decades, dropping from almost 20 percent of work trips in 1980 to less than 10 percent today. However, other forms of conventional shared-use travel—taxi and transit—have been growing. Trend data on taxi trips and passenger miles are not available, but industry revenues, operators, and drivers have increased by 42, 54, and 32 percent, respectively, since 2000. Taxis are estimated to represent 0.2 percent of person trips, a figure that appears small at the national level but nonetheless represents 738 million trips annually. Transit passenger trips and miles have also been growing—up 16 and 25 percent, respectively, since 2000—and transit accounts for about 2 percent of person trips.
The current scale and growth of TNCs, bikesharing, carsharing, and microtransit can only be approximated based on a variety of different sources. A recent national poll (Morning Consult 2015) suggests that TNC use today is roughly comparable to use of taxis (3 percent of respondents reporting “almost daily” use of both modes), but use of TNCs appears to be growing rapidly. Uber reports an annual tripling of trips in San Francisco and a quadrupling of trips in New York City, a doubling of gross revenues, and enrolled drivers increasing by tens of thousands annually. In 2013 and 2014, enrolled drivers at Uber doubled every 6 months, with 40,000 new drivers gained in December 2014 alone (Hall and Krueger 2015). Survey data on business travelers’ use of TNCs indicate that such travelers are selecting TNCs more frequently than taxis, perhaps because of lower average fares. As fragmentary as these indicators of scale and growth may be, they exceed what is known about the use of other TNCs.
Information about the use of carsharing and bikesharing is also limited, but as reported in the previous section, as of the beginning of 2015 there were 45 operators offering carsharing to 1.5 million members, and bikesharing had spread to 72 cities offering almost 25,000 bicycles. Whereas these services remain quite small at the national level, in combination their impacts could be greater if they continue to grow, as described next.
The features of the new shared-use modes and business models influence travel behavior by affecting important considerations in travel decisions such as cost, convenience, and security. This influence, in turn, potentially affects trip-making rates, mode choices, and perhaps trip destinations or paths. Ultimately, these changes in travel behavior can influence the role of transportation in society and the economy—specifically affecting personal mobility, the safety and capacity of the transportation system, and the environmental and economic impacts of transportation.
Respondents to surveys of carsharing and bikesharing members report substantial effects on mode use, vehicle ownership, and travel behavior. In a survey of members of four different bikesharing programs in North America, 50 percent of respondents reported reducing their automobile use as result of bikesharing (Shaheen et al. 2014). Other studies suggest that bikeshare survey respondents may reduce their driving by 25 to 52 percent (Houle 2011; DeMaio 2009). These results, however, should be interpreted with caution because of low response rates and possible response bias toward the most enthusiastic supporters of the programs. Shaheen and colleagues (2012) also found that 39 percent of bikesharing survey respondents reduced their use of public transit. Of interest, bus use decreased among bikesharing respondents in larger cities but increased among those in smaller cities—this increase being attributed to the fact that bikesharing improves access to bus lines. Rail usage increased among respondents in smaller cities but decreased among those in larger cities because of the faster travel speeds and cost savings associated with bikesharing (Martin and Shaheen 2014). Buck and colleagues (2013) corroborate this shift away from public transportation, reporting that among survey respondents, 35 percent of casual users and 45 percent of annual members of Capital Bikeshare in Washington, D.C., replaced a public transit trip with bikesharing.
Respondents to surveys of carsharing members report similarly substantial shifts in travel behavior. For example, Martin and Shaheen (2011) found that carsharing survey respondents, on average,
decreased their household VMT by 27 percent and reduced their greenhouse gas (GHG) emissions by 0.58 metric tons over 1 year (corresponding to a 34 percent reduction in GHGs). As part of the same study, Martin and colleagues (2010) found that for every carsharing vehicle, 9 to 13 personal vehicles were shed, and that carsharing vehicles had a 10-mpg greater average fuel economy relative to the vehicles shed by survey respondents. These results, however, may not be representative because of the low response rate (10 percent of potential respondents). Mishra and colleagues (2015) found that vehicle holdings among urban carsharing residents were lower by 10–40 percent, while transit, biking, and walking trips were all higher. These results corroborate the work of earlier studies. Cervero and colleagues (2007) examined the final results of a before-and-after study of City Carshare in San Francisco and found that VMT among carsharing members had fallen far more than the VMT of a control group; in addition, each carsharing vehicle replaced up to six personal vehicles. Lane (2005) similarly found that carsharing members reported reducing their VMT by several hundred miles per month and that each carsharing vehicle removed more than ten personal vehicles from the road. Whether the effects noted above would be as large for subsequent bikeshare and carshare users is uncertain, since many of the studies cited rely on nonrandom surveys with low response rates that may be biased by responses from the programs’ most enthusiastic users. Even if early adopters are representative of the first generation of users, they may have different preferences about personal mobility relative to the general population.
Comparable data on TNC services and microtransit are not yet available, although at least one study has shown that TNCs may be substituting for both transit and driving trips (Rayle et al. 2015). Transit agencies are watching the evolution of these services carefully to understand how they may interact with and affect transit services.7
Ultimately, travelers and transportation policy makers are interested in understanding the consequences of TNCs and related
______________
7 In mid-2015, the Transportation Research Board’s Transit Cooperative Research Program (TCRP) began Project J-11: The Impact of New Technology-Enabled Mobility Services on Public Transportation. The TCRP project report is expected to be completed in early 2016.
technology-enabled transportation services and business models for travelers and for the economy and the environment. In some cases, the interrelationships and consequences are subtle and can vary depending on the behavioral response. For example, a direct impact of TNCs may be to reduce personal vehicle trips, but the TNC pickup and drop-off mileage may result in more total travel. On the other hand, if TNCs enable or encourage higher vehicle occupancies or skew overall travel behavior away from single-occupant vehicle travel by reducing personal vehicle ownership, they may have positive impacts in terms of minimizing VMT.
Many of the new mobility services have the potential to increase average vehicle occupancies as shared rides become more common. Increased vehicle occupancies would lead to significantly smaller carbon footprints per passenger. In addition, the ability to aggregate trips and increase vehicle occupancy would improve energy efficiency and enable the capacity of transportation systems to increase and accommodate growing needs without adding to congestion or requiring proportional increases in infrastructure.
Not only might existing services continue to promote shared rides, but they and other new services could provide first- and last-mile service to fixed-route buses and rail lines. Other microtransit services might proliferate. If it becomes easier for individuals to travel without owning a private vehicle, car ownership may be reduced, much as has been seen with carsharing services but on a far greater scale.
Reduced vehicle ownership creates a positive feedback loop in which even larger VMT reductions result. This phenomenon occurs when car owners sense very low marginal costs in deciding whether to take a trip, since they perceive the marginal costs to be limited mainly to the cost of gasoline and parking (and tolls). Evidence is overwhelming that car owners do not consider the full cost of trips in making their travel choices. If consumers own fewer vehicles and use other mobility services, they may become more accustomed to considering the marginal cost of each trip, possibly thereby making fewer discretionary trips.
Reduced private vehicle ownership needs may also result in reduced parking requirements as residents reconsider their options
for traveling easily without a private vehicle. Reduced parking needs may allow for increased densification, depending on zoning codes and community support for the conversion of parking space to other uses, which in turn can make transit and active transportation modes (particularly walking and bicycling) more realistic options. The combination of more rational trip making and the proliferation of multirider services creates the potential for dramatic reductions in VMT—and therefore in pollution, GHGs, road infrastructure needs, and parking facilities.
It is also possible, however, that these new services will have the opposite effects. Convenient and inexpensive shared rides in TNC and other vehicles may attract transit riders who currently travel in much more space- and energy-efficient buses and trains. Moreover, the lower cost and reduced driving associated with shared vehicles may induce additional trip making or longer trips, again contributing to increases in VMT, congestion, and GHG emissions.
Technology advances have fostered a broad array of innovations in passenger transportation in recent years. Carsharing, bikesharing, and more recently TNCs and microtransit have emerged as important and growing components of urban passenger transportation. For several decades, policies designed to increase transit use so as to reduce reliance on the private automobile and its associated contributions to congestion and emissions have met with marginal success. In contrast, private companies offering shared vehicles and rides—particularly TNCs but carsharing and bikesharing as well—have recently emerged and appear to be experiencing rapid expansion and success.
Whereas the number of trips made using these services is large and growing, it is still small in the broader context of total national trips. Taxis and limousines, the main existing services against which TNCs compete, account for fewer than half a percent of trips in metropolitan areas of 1 million or more population. In one national poll of registered voters, about 3 percent of respondents reported “almost daily” use of a TNC (the same percentage that reported “almost
daily” use of taxis) (Morning Consult 2015). Uber alone reportedly had 2 million customers in the New York City area in mid-2015.
TNCs aside, taxi and transit trips have been increasing in number and share in recent years, perhaps because of the attraction, particularly among Millennials, of urban lifestyles less dependent upon personal automobiles (Blumenberg et al. 2015). At the same time this trend is occurring, however, reliance on personal vehicles for single-occupant commute trips has been growing, while conventional carpooling has declined. Whether urban mobility services, and TNCs in particular, will affect the broad and enduring trend of single-occupant vehicle trips is of considerable interest and importance in planning for infrastructure capacity and managing vehicle emissions.
Carsharing and bikesharing, which have a longer history than TNCs and microtransit, are reducing automobile ownership and VMT in personal vehicles—as well as drawing travelers away from transit—among the small share of early-adopting urbanites that currently use these services. Among North American bikesharing users, survey respondents have reported declines in automobile use of up to 50 percent, along with similar declines in transit use. Respondents to surveys of carsharing member households have reported reductions in VMT of 20 to 40 percent and in automobile ownership of 10 to 50 percent. While these results may not be altogether scalable to the general population, they nonetheless are encouraging and dramatic. TNCs are garnering the most attention in the media at present, but their broader effects on travel choices are not yet known. By all accounts, they are meeting growing demand with better service and fare options relative to taxis, but also may be increasing total travel, congestion, and emissions in the near term by replacing walking and transit trips, or as a result of the extra travel entailed in picking up passengers. Over the longer term, TNC carpooling options and other mobility services may facilitate more higher-occupancy trips and support the trend toward urban living and its broader environmental benefits.
What form the new mobility services will take as they evolve and whether and how they will affect travel behavior and demand, the use of all other modes (including taxis and limousines), private vehicle
ownership, and residential and commercial location preferences remain to be seen as these options grow and serve different market segments and geographic areas. Studying and documenting these developments will be important to inform public policy debates. However, the lack of information about the scale, growth, and operations of these new services constrains the ability to understand their impacts and, as described in succeeding chapters, to plan intelligently for them and determine whether or to what extent they should be regulated.
References
Abbreviations
| AASHTO | American Association of State Highway and Transportation Officials |
| U.S. BTS | United States Bureau of Transportation Statistics |
AASHTO. 2013. Commuting in America 2013: The National Report on Commuting Patterns and Trends. http://traveltrends.transportation.org/Pages/default.aspx.
Badger, E. 2015. Uber Triumphs as New York City Officials Abandon Plans to Limit Transportation Company. The Washington Post, July 22. http://www.washingtonpost.com/blogs/wonkblog/wp/2015/07/22/uber-triumphs-as-new-york-city-officials-abandon-plans-to-limit-transportation-company.
Blodget, H. 2015. Uber CEO Reveals Mind-Boggling New Statistic That Skeptics Will Hate. Business Insider, Jan. 19. http://www.businessinsider.com/uber-revenue-san-francisco-2015-1.
Blumenberg, E., B. D. Taylor, M. Smart, K. Ralph, M. Wander, and S. Brumbaugh. 2013. The Next Generation of Travel: Statistical Analysis. Federal Highway Administration, U.S. Department of Transportation, Washington, D.C. http://www.fhwa.dot.gov/policy/otps/nextgen_stats/nextgen.pdf.
Blumenberg, E., A. Brown, K. Ralph, B. D. Taylor, and C. T. Voulgaris. 2015. Back to the City: Are Millennials Moving to Greener Urban Environments? Journal of the American Planning Association. Forthcoming.
Brakewood, C., G. S. Macfarlane, and K. Watkins. 2015. The Impact of Real-Time Information on Bus Ridership in New York City. Transportation Research Part C, Vol. 53, pp. 59–75.
Buck, D., R. Bueler, P. Happ, B. Rawls, P. Chung, and N. Borecki. 2013. Are Bikeshare Users Different from Regular Cyclists? First Look at Short-Term Users, Annual Members, and Area Cyclists in the Washington, D.C., Region. In Transportation Research Record: Journal of the Transportation Research Board, No. 2387, pp. 112–119.
Certify. 2015. Sharing Economy Q2 Report. Room for More: Business Travelers Embrace the Sharing Economy. http://www.certify.com/CertifySpendSmartReport.aspx.
Cervero, R., A. Golub, and B. Nee. 2007. City CarShare: Longer-Term Travel Demand and Car Ownership Impacts. In Transportation Research Record: Journal of the Transportation Research Board, No. 1992, pp. 70–80.
DeMaio, P. 2009. Bike-Sharing: History, Impacts, Models of Provision, and Future. Journal of Public Transportation, Vol. 14, No. 4, pp. 41–56.
Ferris, B., K. Watkins, and A. Borning. 2010. OneBusAway: Results from Providing Real-Time Arrival Information for Public Transit. Proceedings of the SIGCHI Conference on Human Factors in Computing Systems, Atlanta,
Georgia, pp. 1807–1816. http://citeseerx.ist.psu.edu/viewdoc/download?doi=10.1.1.170.6351&rep=rep1&type=pdf.
Fulton, W. 2014. Are Millennials Truly Different—Or Just Poor? California Planning & Development Report, Nov. 23. http://www.cp-dr.com/node/3629.
Geier, B. 2015. 10% of All Uber Rides Happen in China. Time, June 9. http://time.com/3914378/uber-china.
Guilford, G. 2014. The World Leader in Bike-Sharing Is . . . China. Quartz.com, Aug. 25. http://qz.com/255054/the-world-leader-in-bike-sharing-is-china.
Hall, J., and A. Krueger. 2015. An Analysis of the Labor Market for Uber’s Driver-Partners in the United States. Princeton University Industrial Relations Section Working Paper 587, Jan. http://dataspace.princeton.edu/jspui/bitstream/88435/dsp010z708z67d/5/587.pdf.
Houle, M. H. 2011. 4 174 917 Déplacements en BIXI en 2011 - BIXI Atteint le Seuil des 40 000 Membres. Newswire, Nov. 11. http://www.newswire.ca/fr/news-releases/4-174-917-deplacements-en-bixi-en-2011---bixi-atteint-leseuil-des-40-000-membres-509107401.html.
Lane, C. 2005. PhillyCarShare: First-Year Social and Mobility Impacts of Carsharing in Philadelphia, Pennsylvania. In Transportation Research Record: Journal of the Transportation Research Board, No. 1927, pp. 158–166.
Licea, M., E. Ruby, and R. Harshbarger. 2015. More Uber Cars Than Yellow Taxis on the Road in NYC. New York Post, Mar. 17. http://nypost.com/2015/03/17/more-uber-cars-than-yellow-taxis-on-the-road-in-nyc.
Martin, E., and S. Shaheen. 2011. Greenhouse Gas Emission Impacts of Carsharing in North America. IEEE Transactions on Intelligent Transportation Systems, Vol. 12, No. 4.
Martin, E., and S. Shaheen. 2014. Evaluating Public Transit Modal Shift Dynamics in Response to Bikesharing: A Tale of Two U.S. Cities. Journal of Transport Geography, Vol. 41, pp. 315–324.
Martin, E., S. Shaheen, and J. Lidicker. 2010. The Impact of Carsharing on Household Vehicle Holdings: Results from a North American Shared-Use Vehicle Survey. In Transportation Research Record: Journal of the Transportation Research Board, No. 2143, pp. 150–158.
Mishra, G. S., R. R. Clewlow, K. F. Widaman, and K. P. Laberteaux. 2015. Carsharing Reduces Vehicle Holdings and Increases Sustainable Travel—Evidence from the San Francisco Bay Area. Transport Policy. [Paper accepted for publication.]
Morning Consult. 2015. Crosstabulation Results: National Tracking Poll #150505. June. http://morningconsult.com/wp-content/uploads/2015/06/150505_crosstabs_mc_v2_AD.pdf.
Multisystems, Inc. 2002. TCRP Synthesis 48: Real-Time Bus Arrival Information Systems. TRB, National Research Council, Washington, D.C. http://onlinepubs.trb.org/onlinepubs/tcrp/tcrp_syn_48.pdf.
Polzin, S. E., X. Chu, and J. Godfrey. 2014. The Impact of Millennials’ Travel Behavior on Future Personal Vehicle Travel. Energy Strategy Reviews, Vol. 5, pp. 59–65.
PR Newswire. 2014. car2go Reaches 1,000,000 Members, Marking Its Spot as the Largest Carsharing Company in the World, Dec. 10. http://www.prnewswire.com/news-releases/car2go-reaches-1000000-members-marking-its-spot-as-the-largest-carsharing-company-in-the-world-300007578.html.
Rayle, L., S. Shaheen, N. Chan, D. Dai, and R. Cervero. 2015. App-Based, On-Demand Ride Services: Comparing Taxi and Ridesourcing Trips and User Characteristics in San Francisco. Presented at 2015 Annual Transportation Research Board Meeting, Washington, D.C., Jan.
Rode, P., and G. Floater. 2014. Accessibility in Cities: Transport and Urban Form. LSE Cities at the London School of Economics and Political Science. http://newclimateeconomy.report/wp-content/uploads/2014/11/Transport-and-urban-form.pdf.
Rodrigue, J.-P. 2013. The Geography of Transport Systems, 3rd ed. Routledge, New York.
Schoettle, B., and M. Sivak. 2014. The Reasons for the Recent Decline in Young Driver Licensing in the United States. Traffic Injury Prevention, Vol. 15, No. 1, pp. 6–9.
Shaheen, S. 2015. Shared Mobility Trends and Highlights. Presentation at City Innovate Conference, San Francisco, California, June.
Shaheen, S., and A. Cohen. 2015. Innovative Mobility Carsharing Outlook: Carsharing Market Overview, Analysis, and Trends: Summer 2015. Transportation Sustainability Research Center—University of California, Berkeley. http://innovativemobility.org/wp-content/uploads/2015/07/Summer2015-Carsharing-Outlook_Final-1.pdf.
Shaheen, S., E. Martin, A. Cohen, and R. Finson. 2012. Public Bikesharing in North America: Early Operator and User Understanding. MTI Report 11-26. http://transweb.sjsu.edu/PDFs/research/1029-public-bikesharing-understanding-early-operators-users.pdf.
Shaheen, S., E. Martin, N. Chan, A. Cohen, and M. Pogodzinski. 2014. Public Bikesharing in North America During a Period of Rapid Expansion: Understanding Business Models, Industry Trends and User Impacts. MTI Report 12-29. http://transweb.sjsu.edu/PDFs/research/1131-public-bikesharing-businessmodels-trends-impacts.pdf.
Shaheen, S., N. Chan, and H. Micheaux. 2015. One-Way Carsharing’s Evolution and Operator Perspectives from the Americas. Transportation, Vol. 42, No. 3, pp. 519–539.
U.S. BTS. 2015a. National Household Travel Survey Daily Survey Quick Facts. http://www.rita.dot.gov/bts/sites/rita.dot.gov.bts/files/subject_areas/national_household_travel_survey/daily_travel.html.
U.S. BTS. 2015b. U.S. Passenger Miles. http://www.rita.dot.gov/bts/sites/rita.dot.gov.bts/files/publications/national_transportation_statistics/html/table_01_40.html.
U.S. Census. 2014. San Francisco Quick Facts. http://quickfacts.census.gov/qfd/states/06/0667000.html.
White, M. C. 2015. Companies Adapt to Uber and Lyft Rides on the Expense Report. The New York Times, Mar. 23. http://www.nytimes.com/2015/03/24/business/companies-adapt-to-uber-and-lyft-rides-on-the-expense-report.html.


