
2
Interregional Travel Behavior and Patterns
This chapter provides a snapshot of interregional travel in the United States as revealed by the 1995 American Travel Survey (ATS), which is the most recent data source of sufficient detail to describe long-distance travel by people living in the United States.1 Developed from interviews of individuals from more than 80,000 households, the ATS concentrates on trips with one-way distances of 100 miles or more from the respondent’s home.2 The chapter’s focus is on ATS trips having distances up to 500 miles, which are defined as “interregional” in this report. Interregional trips dominate long-distance travel. More than three-quarters of all long-distance trips in the ATS were for distances of 500 miles or less.3
An examination of the ATS indicates a number of relationships among interregional trip making, mode choice, trip length, trip purpose, and household characteristics. Many of these relationships are similar to those of long-distance trips generally. For example, people from higher-income households tend to make more long-distance trips for all purposes (e.g., leisure, personal, and business) and across all trip lengths than do people from lower-income households.4 Because of their shorter lengths, interregional trips are better suited to the surface modes than
________________
1 The survey was conducted for the U.S. Department of Transportation’s Bureau of Transportation Statistics by the U.S. Bureau of the Census as a component of the Census of Transportation.
2 The survey consisted of four detailed telephone interviews conducted approximately every 3 months from April 1995 to March 1996. In most cases, one adult member of the household provided information for all members. Respondents were asked to report each round-trip taken during a quarter in 1995 in which one direction was at least 100 miles (i.e., each time a person in the household visited a place at least 100 miles away from home and returned). Because of the household-based structure of the survey, trips by visitors to the United States were not recorded.
3 ATS (see subsequent discussion and figures in this chapter).
4 ATS (see subsequent discussion and figures in this chapter).
are longer-distance trips, which are more often made by airline when the one-way distance exceeds 500 or 600 miles.5 While travel distance is a key determinant of mode use, the ATS shows the effect of other factors, including the purpose of the trip and whether the trip involves people traveling together. An understanding of these factors is important in planning transportation systems for long-distance travel, particularly for interregional travelers, who may be served in a comparable fashion by more than one type of interregional mode.
For 20 years, the ATS has been the only detailed source of information on long-distance travel in the United States. The relationships derived from it continue to be used by government transportation planners, transportation companies, and the tourism industry. However, many circumstances have changed since it was completed in 1995, and the survey’s relevance has likely diminished. Since 1995, the U.S. population has increased by more than 20 percent, grown older (the median age was 34.3 years in 1995 and 37.6 years in 2013), become more concentrated in metropolitan areas, and continued to shift further to the South and West.6 Average household size has declined as the number of households with children has grown at a slower rate than households consisting of couples and individuals living alone.7
Transportation technologies have also changed, in some cases dramatically. Advances in in-vehicle electronics have made travel by automobile more reliable and comfortable for longer-distance trips, not only by assisting with driving functions (e.g., adaptive cruise control, lane-keeping systems) but also by providing onboard entertainment and navigation assistance.8 The commercialization of the Internet and the introduction of the smartphone and other electronic and tele-
________________
5 ATS (see subsequent discussion and figures in this chapter).
6 For 1995 population and median age, see https://www.census.gov/popest/data/national/totals/1990s/tables/nat-agesex.txt; for 2013 population and median age, see http://factfinder.census.gov/faces/tableservices/jsf/pages/productview.xhtml?src=bkmk; for other demographic trends, see USDOT 2015, 12–31.
7https://www.census.gov/hhes/families/files/graphics/HH-4.pdf.
8 The individual modes and their supply characteristics are examined in Chapter 3, which discusses a number of these developments.
communications devices have created new means of marketing and shopping for airline, train, and bus fares (e.g., travel agency websites and online ticketing). Mobile computer and communications technologies have also allowed more productive use of time spent traveling. These technologies may be influencing travelers’ choice of modes (e.g., travelers may prefer modes that allow their portable devices to be used) and even their overall demand for travel because of the growing number of options for working remotely and staying connected to friends and family.9 Accordingly, an ATS-like snapshot of long-distance travel taken today would likely reveal distinct differences in where, why, and how people travel compared with circumstances a generation ago.
The 1995 ATS remains the most recent comprehensive source of information on long-distance travel in the United States. Some of the basic relationships it reveals, such as the ways in which trip purpose, party size, and household income affect mode use and trip-making propensity, have been observed in other travel surveys, such as the Census of Transportation from 1977 and the 2001 National Household Travel Survey (NHTS), which focused on local travel.10 Because there is no obvious reason to believe that these most basic relationships have changed markedly since 1995, they are summarized below for background purposes on the basis of the ATS. Nevertheless, the applicability of the ATS data is increasingly questionable for more detailed analyses of long-distance travel behaviors and activity. From the standpoint of public officials who are considering investments in long-lived transportation systems, which require forecasts of travel decades into the future, the lack of more recent data can be especially problematic.
________________
9 For example, Connolly et al. (2009) present the results of a survey conducted on Irish Rail to observe how the value of travel time may change if individuals are able to engage in another activity during travel.
10 The NHTS combined the surveys for long-distance and daily travel into one sample. Although the NHTS is more recent than the ATS, the NHTS sample was too small for detailed analyses of long-distance trips.
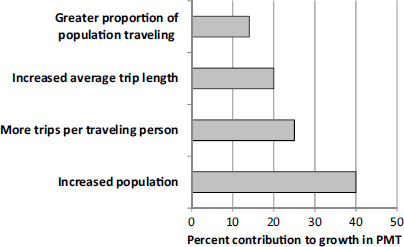
FIGURE 2-1 Factors contributing to increases in long-distance person miles of travel (PMT), 1977–1995. (Derived from Pisarski 2013.)
INSIGHTS INTO LONG-DISTANCE TRAVEL
FROM THE 1995 ATS
Historical Growth in Long-Distance Travel
Historically, between 15 and 20 percent of all person miles of travel, including local travel, are from trips of 100 miles or longer.11 During 1995, Americans averaged about four long-distance trips per person by all modes (BTS 1997, 1, 11, Table 1). The average one-way distance for a trip was 413 miles (BTS 1997, 11, Table 1), and total annual miles traveled averaged 3,075 per person (McGuckin 2013). People living in about one-third of U.S. households did not make any long-distance trips that year (BTS 1997).
In the years between the 1977 Census of Transportation and the 1995 ATS, the average number of long-distance trips per capita increased by more than two-thirds, while total person miles of long-distance travel more than doubled. The increase in person miles had several sources, as shown in Figure 2-1. First, more people took long-distance trips in 1995. This growth was caused both by a 20 percent increase in U.S. population and by a higher percentage of the population making at least one trip. Second, the share of the population that did travel took more
________________
11 As indicated by the 1995 ATS and 1977 Census of Transportation and by ATS analyses undertaken for this study by McGuckin (2013).
trips in 1995 than in 1977. Finally, the average trip length increased. About 40 percent of the increase in person miles was due to population growth; most of the increase was caused by the combination of long-distance trips becoming longer on average, a larger share of the population taking trips, and travelers taking more trips on average.
Mode Use and Trip Length
Figure 2-2 shows the share of person trips of varying lengths made by automobile, airplane, train, and bus according to the 1995 ATS. A relationship between trip length and mode use is apparent: automobiles dominated the shortest trips, and airlines dominated the longest ones. Because trips of 100 to 500 miles account for nearly 80 percent of all long-distance trips (Figure 2-3), the automobile is the most heavily used mode of transportation for long-distance travel.
Examination of Interregional Trips in the ATS
As indicated in Figure 2-3, nearly 80 percent of long-distance trips are for interregional distances of 100 to 500 miles. The following sections
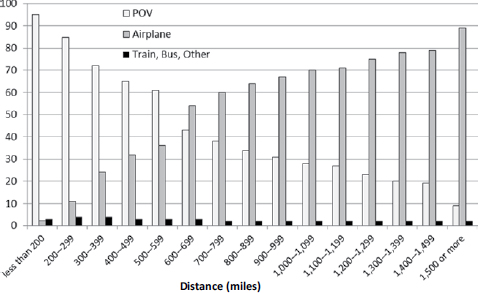
FIGURE 2-2 Percentage of person trips by mode and one-way trip distance, 1995 ATS. (POV = privately owned vehicle.) (SOURCE: McGuckin 2013.)
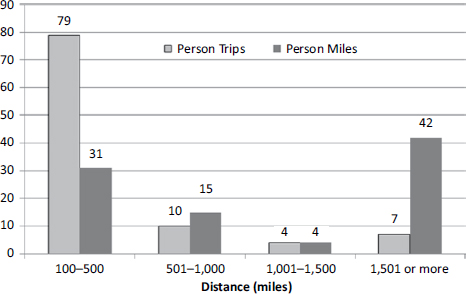
FIGURE 2-3 Percentage share of long-distance person trips and person miles by one-way trip length, 1995 ATS. (SOURCE: McGuckin 2013.)
examine these trips by trip purpose, travel party type and size, and household income and composition.
Trip Purpose and Travel Party Type and Size
For some activities such as participation in an out-of-town sales conference, client meeting, or family wedding, there may be no good substitutes for long-distance travel. For other activities such as vacationing, acceptable substitutes for a long-distance trip may exist. For example, a vacationer may drive to a nearby beach rather than fly to a distant resort. The person traveling for leisure tends to have more discretion about whether and where to travel. For a person traveling on business, decisions about the time, place, and even mode of travel are likely to be made or heavily influenced by the business itself, because it incurs most of the costs and benefits of the trip. People traveling for leisure and other nonbusiness purposes tend to pay their own way and are generally more concerned about the price of the trip, which they may try to minimize by adjusting the trip’s timing and transportation mode. As a result of these fundamental differences in the decision-making process, the elasticity of demand can be different for
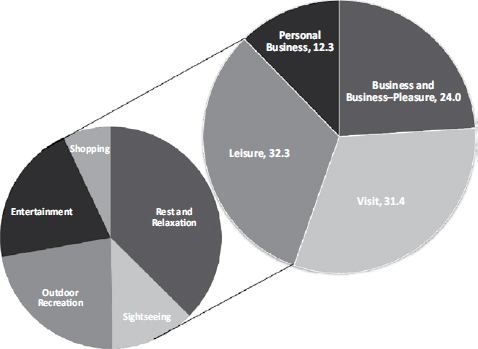
FIGURE 2-4 Percentage of interregional trips by trip purpose, 1995 ATS. (SOURCE: McGuckin 2013.)
trips made for business and nonbusiness purposes, and they are usually treated separately in analyses of travel data.12
According to the ATS, nearly one-quarter of interregional trips in 1995 were made for business reasons (including business combined with pleasure); about three-quarters were made for nonbusiness reasons, such as to visit family and friends, participate in leisure activities (e.g., sightseeing, shopping, entertainment, outdoor recreation), and conduct personal business (e.g., attend school, seek medical treatment) (Figure 2-4).
________________
12 In surveying price elasticity of demand estimates in the literature from the 1970s and 1980s, Oum et al. (1990, 170, Table 2) found that the range of price elasticities for vacation and leisure travel by intercity rail and airline was 1.1 to 2.7. The range for business travel was more price-inelastic: 0.4 to 1.2. Gillen et al. (2002) surveyed price elasticity estimates in the literature for air travel only. They separated the values by travel distance and purpose. The estimates are directionally consistent with those of Oum et al. They indicate that short-haul leisure travelers had a price elasticity range of 1.3 to 1.7, while short-haul business travelers had a range of 0.6 to 0.8. A full review of the literature on air travel price elasticity values can be found at https://www.iata.org/whatwedo/Documents/economics/Intervistas_Elasticity_Study_2007.pdf.
TABLE 2-1 Percentage of Interregional Trips by Travel Party Type and Trip Purpose
| Travel Party Type | Business Purpose | Nonbusiness Purpose | All |
| One adult | 76 | 34 | 44 |
| Two or more adults | 19 | 41 | 36 |
| Travel party with at least one child | 5 | 25 | 20 |
| All | 100 | 100 | 100 |
| One adult | 41 | 59 | 100 |
| Two or more adults | 13 | 87 | 100 |
| Travel party with at least one child | 7 | 93 | 100 |
| All | 24 | 76 | 100 |
SOURCE: McGuckin 2013.
Because many business trips are made by individuals traveling alone and many nonbusiness trips are made by people traveling together, such as vacationing families, knowledge of a trip’s purpose and travel party type can be helpful in explaining mode choice. Of the roughly 25 percent of interregional trips made for business purposes recorded in the 1995 ATS, 76 percent were made by a single adult traveling alone, 19 percent by two or more adults traveling together, and 5 percent by a travel party involving at least one child (Table 2-1). In comparison, of the nearly 75 percent of interregional trips for nonbusiness purposes, only about one-third were made by a person traveling alone; adults traveling together and travel parties involving at least one child accounted for 41 percent and 25 percent of trips, respectively.
Mode Use and Travel Party Type
A strong relationship between mode use and travel party type can be seen in the ATS for interregional trips. Mode shares for travel parties consisting of a single person, two or more adults, and one or more adults traveling with at least one child are shown in Figure 2-5. The data points represent the mode shares for each party type when they are indexed to the mode share for all interregional travelers. For example, the bus mode share for single travelers is 50 percent higher than the bus mode share for all interregional travelers and three times higher than the bus mode share for people traveling with children. The comparison indicates that two
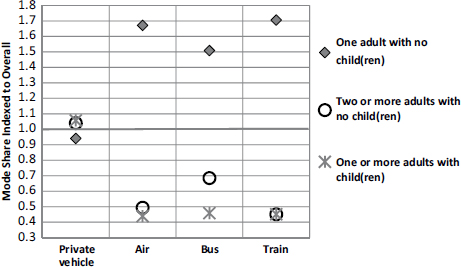
FIGURE 2-5 Interregional travel mode share for three travel party types indexed to the mode share overall, 1995 ATS. (SOURCE: McGuckin 2013.)
or more adults traveling together behave much like adults traveling with children in that both party types are far less likely than single travelers to travel by air, bus, or train.
Single travelers, as noted above, are more likely to be traveling for business than are people traveling in a group. Business travelers place a high value on time and can therefore accrue large benefits from modes having faster travel speeds or offering the ability to conduct work en route. Traveling long distances alone by private automobile does not offer these benefits, because the business traveler must concentrate on driving tasks. Conversely, because they are more likely to be traveling in groups and paying their own travel expenses, nonbusiness travelers may find the automobile mode, with its low cost per additional traveler, advantageous.
Variability in Interregional Mode Use by Region
The automobile dominates interregional trips when such trips are aggregated at the national level. However, the mode share for the automobile is generally lower for trips in which the origin or the destination consists of a large metropolitan area in the Northeast Corridor (NEC), which spans Boston, Massachusetts, to Washington, D.C. The ATS data
TABLE 2-2 Interregional Trip Mode Shares Nationally and in Selected Metropolitan Areas in the NEC and California, 1995 ATS
| Trips of 100 to 500 Miles, One Way: Mode Shares | |||||||
| Trips Not Made by Automobile, by Originating Metropolitan Area | |||||||
| Mode | All Trips | National | N.Y.N.J. (NEC) | D.C.-Va.Md. (NEC) | Philadelphia, Pa. (NEC) | Los Angeles, Calif. | San Francisco, Calif. |
| Automobile | 90 | ||||||
| Airline | 7 | 68 | 39 | 57 | 61 | 76 | 90 |
| Bus | 2 | 19 | 34 | 15 | 15 | 12 | 7 |
| Train | <1 | 5 | 24 | 23 | 15 | 6 | 1 |
| Other | <1 | 8 | 3 | 5 | 9 | 6 | 2 |
NOTE: N.Y.-N.J. = New York–New Jersey; D.C.-Va.-Md. = Washington, D.C.–Virginia–Maryland; Pa. = Pennsylvania; Calif. = California.
SOURCE: McGuckin 2013.
in Table 2-2 indicate that trains and buses have a significant role for the nonautomobile travel originating along this 400-mile corridor. The pattern is different for interregional travel originating in California, where air transportation plays a much larger role. The long distances between cities in California may favor flying, while the generally shorter distances between cities in the Northeast may favor buses and trains. Since travelers using buses and trains depend on public transit or walking to access stations, the more compact and transit-oriented Northeastern cities may be conducive to the use of these surface modes. Furthermore, as discussed in more depth later in this report, the NEC has a tradition of travel by train and bus and levels of train and bus service that are unmatched by other regions.
Household Income and Composition
Rates of interregional trip making are strongly associated with a number of socioeconomic factors including household income and composition. Figure 2-6 shows the impact of income on interregional trip rates per capita. The 1995 ATS data show a positive relationship between income and annual trips per capita. People in the lowest income quartile averaged about half as many interregional trips per year as people in the highest
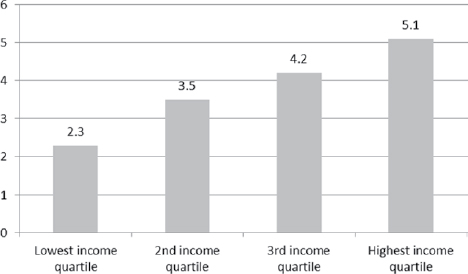
FIGURE 2-6 Annual interregional trips, 100 to 500 miles, per capita by household income quartile, 1995 ATS. (SOURCE: McGuckin 2014.)
income quartile.13 The positive effect of income on interregional trips in the ATS is not surprising, since most studies of long-distance travel have estimated that as income increases, the number of long-distance trips increases at a faster rate (i.e., real household income growth of 1 percent leads to a 1 to 2 percent growth in trips made).14
The ATS data also indicate that household income is associated with the use of specific transportation modes. Figure 2-7 shows the share of trips made by automobile for lower- and higher-income households when the main purpose of traveling is to engage in recreational activities. Regardless of trip distance, travelers from lower-income households use automobiles for a higher share of their recreational trips. Even when round-trip distances reach 800 miles, travelers from lower-income households (<$25,000 annually in 1995 dollars) drive more than three-quarters of the time, whereas travelers from higher-income households (>$100,000) drive only about
________________
13 More information on these patterns is given by Mallett (2001).
14 A comprehensive review of the literature by Gillen et al. (2002) suggests that the income elasticity for intercity travel is on the order of 1.5. Virtually all estimates of income elasticities for long-distance travel demand in the literature are above 1 and generally are between 1 and 2. See, for example, Gillen et al. 2002 (value of 1.5), Oum et al. 1986 (value of 1.5), Alperovich and Machnes 1994 (range of 1.6 to 2.1), and Njegovan 2006 (value of 1.5).
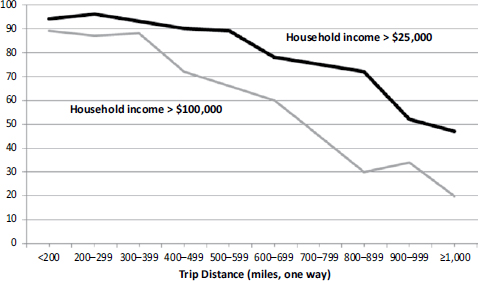
FIGURE 2-7 Percentage of all recreational trips by automobile for lower- and higher-income households (income in 1995 dollars), 1995 ATS. (Adapted from Mallett and McGuckin 2000, Figure 1.)
30 percent of the time. However, more than one-quarter of the low-income population surveyed in the ATS lived in a household without a vehicle. According to a review of the survey data by Mallett (2001), all households lacking a vehicle traveled less than households in the same income group with one or more vehicles, while trip making by low-income households was less than one-third of that of low-income households with one or more vehicles.15
Income is one of several household-related factors affecting the propensity to take interregional trips. According to the 1995 ATS, travelers from two-adult “couple” households average more trips per year than other households, particularly nonbusiness trips (Figure 2-8). People living in family households with children accounted for the next highest rates, with the variability affected by the age of the children. Family households tend to make fewer leisure trips than couple households, but they average more business trips. Single households average the fewest trips for both business and nonbusiness purposes, probably because they are more likely to contain retirees. Figure 2-9 indicates the effect of the
________________
15 More information on these patterns is given by Mallett (2001).
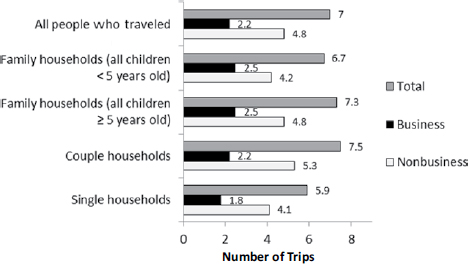
FIGURE 2-8 Average number of interregional trips per year by people who traveled for business and nonbusiness purposes, by household composition, 1995 ATS. (SOURCE: McGuckin 2013.)
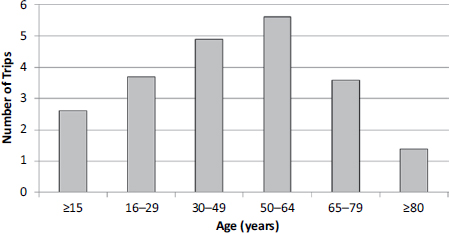
FIGURE 2-9 Annual interregional trips per capita, by years of age, 1995 ATS. (SOURCE: McGuckin 2013.)
age of the traveler on the number of interregional trips. People between the ages of 30 and 64 averaged the most annual trips.
Long-distance trips recorded in the 1995 ATS are examined in this chapter to illustrate some basic interregional travel behaviors and patterns. Although they are now 20 years old, the ATS data remain helpful for general characterizations of the effect of factors such as household income, trip purpose, and trip length on the likelihood of people making an interregional trip and using particular modes for the line-haul portion of transportation.
The data indicate that trips made for business and nonbusiness purposes differ in fundamental ways that affect a traveler’s choice of modes. They reveal how trip making varies according to household size and age composition. The data indicate that people traveling as families and in other groups for nonbusiness purposes have a strong tendency to use private automobiles for interregional trips under 500 miles; trips by bus, train, and airline are made disproportionately by people traveling alone or on business. Time-sensitive business travelers account for many of the interregional trips made by airline when market distances approach about 200 miles.
Despite the utility of the 1995 ATS for demonstrating such basic tripmaking relationships, its contribution to understanding current travel behavior and activity is diminishing as transportation service options, socioeconomic conditions, and technologies continue to change. Transportation planners and public officials need up-to-date and detailed data on long-distance travel to inform their decisions. For example, reliable forecasts of demand for the long-lasting infrastructure used for interregional transportation are necessary. The chapters that follow make the importance of such information evident.
REFERENCES
Abbreviations
| BTS | Bureau of Transportation Statistics |
| USDOT | U.S. Department of Transportation |
Alperovich, G., and Y. Machnes. 1994. The Role of Wealth in the Demand for International Air Travel. Journal of Transport Economics and Policy, Vol. 28, No. 2, May, pp. 163–173.
BTS. 1997. 1995 American Travel Survey: Profile. Report BTS/ATS95-US. Oct.
Connolly, D., B. Caulfield, and M. O’Mahony. 2009. Rail Passengers’ Preferences for Onboard Wi-Fi Internet Access. Presented at 88th Annual Meeting of the Transportation Research Board, Washington, D.C.
Gillen, D., W. G. Morrison, and C. Stewart. 2002. Air Travel Demand Elasticities: Concepts, Issues and Management. Department of Finance Canada. http://www.fin.gc.ca/consultresp/airtravel/airtravstdy_-eng.asp.
Mallett, W. J. 2001. Long-Distance Travel by Low-Income Households. In Transportation Research Circular E-C026: Personal Travel: The Long and Short of It, Transportation Research Board, National Research Council, Washington, D.C., pp. 169–177. http://onlinepubs.trb.org/onlinepubs/circulars/ec026/04_mallet.pdf.
Mallett, W. J., and N. McGuckin. 2000. Driving to Distractions. http://www.travelbehavior.us/Nancy-pdfs/Driving%20to%20Distractions--Long%20Distance%20 Leisure%20Travel.pdf.
McGuckin, N. 2013. Intercity Travel Market Analysis. Prepared for Committee for a Study of Intercity Passenger Travel Issues and Opportunities in Short-Haul Markets. http://www.travelbehavior.us/Nancy--ppt/Intercity%20Travel%20Market%20Analysis.pdf.
McGuckin, N. 2014. Homebodies and Road Warriors. http://www.travelbehavior.us/Nancy-pdfs/Homebodies%20and%20Road%20Warriors.pdf.
Njegovan, N. 2006. Elasticities of Demand for Leisure Air Travel: A System Modelling Approach. Journal of Air Transport Management, Vol. 12, No. 1, pp. 33–39.
Oum, T., D. Gillen, and Y. Noble. 1986. Demands for Fare Class and Pricing in Airline Markets. Logistics and Transportation Review, Vol. 22, No. 3, pp. 195–222.
Oum, T. H., W. G. Waters, and J. S. Yon. 1990. A Survey of Recent Estimates of Price Elasticities of Demand for Transport. Policy, Planning, and Research Working Papers, Transportation Infrastructure and Urban Development Department, World Bank, Jan.
Pisarski, A. 2013. Development of Methods for Enhancing Long Distance Travel O-D Data. FHWA Project DTFH61-07-07-D-00013-T1-002. March.
USDOT. 2015. Beyond Traffic 2045: Trends and Choices, Sept. https://www.transportation.gov/sites/dot.gov/files/docs/Draft_Beyond_Traffic_Framework.pdf.


