
Appendix C
Modeling the Economic Threat of Pandemics
Anas El Turabi and Philip Saynisch
Harvard University
Predicting the likely economic losses associated with future pandemic events is challenging. Pandemics are rare events, and we have relatively few data points to inform predictive models, with only three observed influenza pandemics in the 20th century.
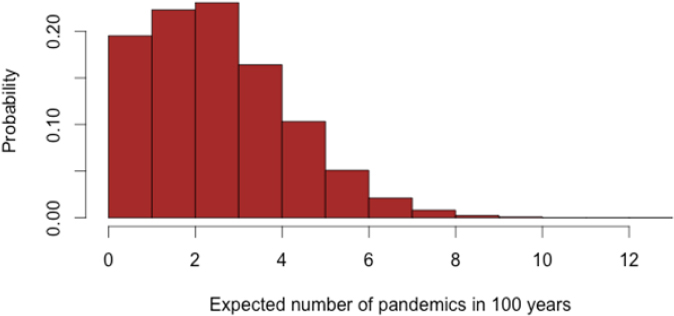
We can, however, use the limited data we have to help us get a sense of the scale of likely losses. We can start, for example, by estimating how many pandemics we might see this century. We know that the 20th century saw three pandemics, so it might be reasonable to assume that there is around a 3 percent chance that a pandemic might occur in any given year. This means that, while on average we might get three pandemics each century, because of random variation, some centuries might get more and some might get fewer. We can use simulation models to give us a feel for how much the number of pandemics each century might vary due to random chance, and doing this gives us the distribution shown in Figure C-1.1
One important feature of this chart is that, although we would expect to see three or fewer events the majority of the time, there is a chance of the world experiencing more. Indeed, the 19th century saw five pandemics of cholera alone, which, although not directly comparable to the situation today, gives us a sense that the order of magnitude predicted by our model is reasonable.
Our model probably represents a conservative estimate of the risk of pandemic events; that is to say, there are reasons to believe the true risk could be higher. Our model uses data from the 20th century; however, a key conclusion of this report is that the risk of pandemic events is higher than it has been before and without further action is likely to continue to rise (see Box C-1).
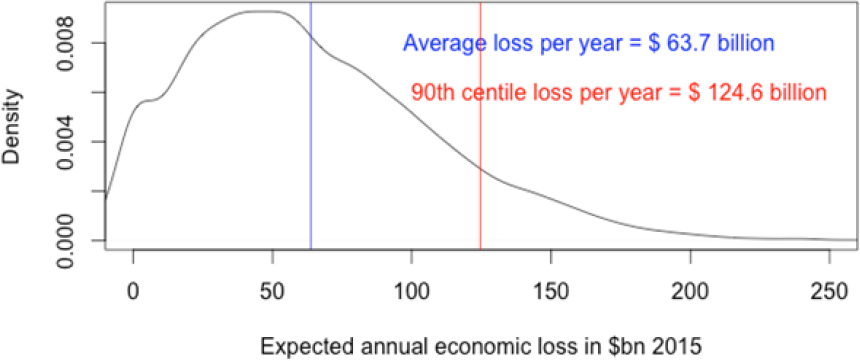
To estimate the scale of economic losses associated with future pandemics, we can apply the same strategy of using what we know about previous pandemics to model the impact of future pandemics. Previous work has estimated the economic loss that occurred as a result of each of the 20th-century pandemics as 0.7–4.8 percent of global gross domestic product (GDP) (McKibben and Sidorenko, 2006). We can use these estimates to develop models of how much damage might be done to the global economy during future pandemics. Again, we use simulation models that take into account the uncertainty associated with the number of pandemics that might happen, as well as uncertainty associated with the damage done by pandemics when they strike. Using the same approach we used for modeling the number of events per century, we model the economic losses of these events throughout a century and use these estimates to get a distribution of expected annual losses2 (see Figure C-2).
___________________
1 We use simulation to estimate the distribution of expected pandemic events per century by running 10,000 simulations of random draws from a binomial distribution, where the number of events, X, is distributed X~Bin(100,(3/100)). In doing this we are simulating the losses that might occur in 10,000 centuries and aggregating the results to show us how likely it is that we see different numbers of events per century, on average. Our principal modeling assumptions are that the probability of an event occurring in any year is fixed at 3 percent (derived from the observation of three influenza pandemics in the 20th century) and that the probability of an event occurring in any year is independent of whether events occurred in other years that century.
2 This model uses simulation to estimate the distribution of expected
SOURCE: Figure created for the GHRF Commission by El Turabi and Saynisch, Harvard University.
SOURCE: Figure created for the GHRF Commission by El Turabi and Saynisch, Harvard University.
We can see that our model estimates an average loss to the global economy of more than $60 billion per year—or more than $6 trillion per century. Again, an important feature of the distribution of expected economic losses is that they exhibit a long right tail; that is to say, there is a nontrivial chance of seeing much more extreme losses. For example, the model predicts a 10 percent chance that average losses this century will be more than $120 billion per year. Indeed, it is because our model accommodates for the possibility of these rarer but more extreme outcomes that our estimate of average losses is higher than the $30 billion calculated by the World Bank.
No model can perfectly predict the economic losses that will arise from future pandemics, and all models have their limitations. Our model is dependent on the validity and accuracy of our input data and the assumptions we make about how representative these data are of the underlying pandemic phenomena (frequency of occurrence and impact).3 Although our input data are not perfect (in that they relate to events stretching back to 1918 that may be of less relevance today), they are the same figures that a number of authorities, including the World Bank, have used when estimating the economic impact of pandemic events (Jonas, 2014). Additionally, using different input figures derived from those used by commercial insurers, as well as using different models to account for the uncertainty of these estimates, has little effect on the scale of our estimates.4 Put more plainly, the story remains the same, even when we use alternative input data and different statistical models.
A number of limitations mean that our model probably underestimates the economic threat of pandemic disease events. First, our model only estimates the risk associated with pandemics, and takes no account of the burden of pre-pandemic events such as outbreaks and epidemics, which are substantial. Second, our model assumes the risk of pandemic events this century will be broadly the same as they were in the 20th century; in reality, however, the risk of pandemic events is probably
___________________
economic losses due to pandemic events per century, which we then report in annualized form. It achieves this by first simulating for each year in a century whether a pandemic occurs (X) by drawing randomly from a Bernoulli distribution with a probability of 3 percent (X~Bern(0.03)). If an event occurs, the economic losses for that event are randomly drawn from a normal distribution with mean and standard deviation derived from the global GDP losses calculated by McKibben and Sidorenko for 20th century influenza pandemics (0.7 percent, 3.1 percent, and 4.8 percent) applied to a global GDP figure of $74 trillion U.S. dollars (the International Monetary Fund estimate for global GDP for 2015). These draws are repeated for each year in a century to give a total loss for that simulated century. The results of 10,000 such simulations are then aggregated to give the distribution of expected losses per century, and these results are then divided by 100 to give the annualized expected losses presented above.
3 This includes our parametric assumptions about the underlying distributions from which the historical data are realized.
4 We explored alternative parameterizations of the distributions of economic losses (uniform and beta) using alternative sources for economic loss inputs (Jonung and Roeger, 2006) and found that our expected annualized losses remained in the range of $60–$65 billion U.S. dollars with a similar right-tailed distribution as found in our main analysis. Using models which explored expected costs over shorter time horizons than 100 years led to no change in the average expected loss but greater uncertainty of expected losses, producing heavier-tailed distributions.
greater now and rising (see Box C-1). Finally, our model only predicts the economic losses associated with the first year after a pandemic event, while previous research suggests that the economic impact of pandemics probably extends 3 to 4 years (McKibben and Sidorenko, 2006). Our estimates might thus be considered conservative.
So, given the range of estimates for the economic losses as a result of pandemic events, which number should we have in mind when considering the risk posed to the global economy? In one sense it does not matter. All of the proposed figures, from $30 billion to more than $120 billion, represent losses large enough to warrant concerted action. And, with only one-third of countries declaring that they have met the standards for infectious disease control mandated by the International Health Regulations (WHO, 2015), it is clear that we have failed to invest properly to address these risks. On the other hand, there is good reason to believe that our model represents a conservative estimate of the losses that will occur, so we may be justified in focusing on the higher numbers. The argument for this approach is strengthened when we consider the asymmetric consequences of over- versus under-investment in pandemic prevention and response and the tendency of societies to be risk averse. Governments, because they are responsible for the protection of citizens’ welfare, are especially likely to be risk averse to outcomes with potential to cause catastrophic damage to the health and prosperity of their nations. For these reasons, it may be reasonable to consider our estimate of expected annual losses from the global economy of $60 billion per year a “low” realistic estimate.
REFERENCES
Jonas, O., 2014. Pandemic risk. Washington, DC: World Bank.
Jones, K. E., N. G. Patel, M. A. Levy, A. Storeygard, D. Balk, J. L. Gittleman, and P. Daszak. 2008. Global trends in emerging infectious diseases. Nature 451(7181):990-993.
Jonung, L., and W. Roeger. 2006. The macroeconomic effects of a pandemic in Europe—a model-based assessment. Brussels, Belgium: European Commission.
McKibben, W. J., and A. A. Sidorenko. 2006. Global macroeconomic consequences of pandemic influenza. Sydney, Australia: Lowy Institute for International Policy.
WHO (World Health Organization). 2015. Implementation of the International Health Regulations (2005). Report of the review committee on second extensions for establishing national public health capacities and on IHR implementation. Geneva: Sixty-Eighth World Health Assembly.


